Rates as of 04:30 GMT
Market Recap
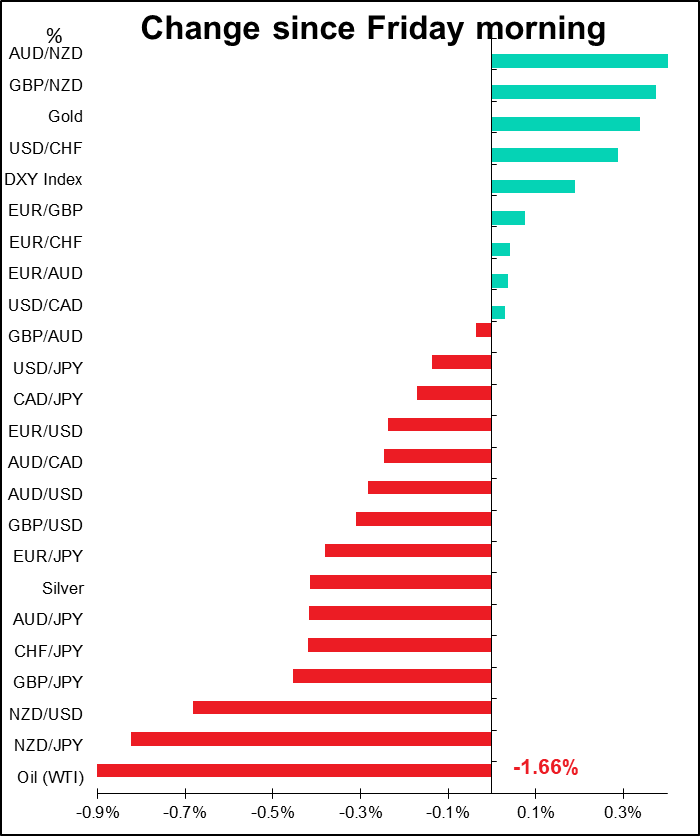
As I said a few days ago, it’s either “Day A” or “Day B” nowadays. “Day A” is “risk-on,” “Day B” is “risk-off.” Friday and this morning were definitely “Day B.” The New York market was down 0.5% and virtually every Asian market is down this morning.
However, we are seeing some unwind of the risk-off after the People’s Bank of China (PBOC) offered the first batch of special re-lending funds in an effort to keep the economy going during the coronavirus shut-down. Also, Chinese authorities denied earlier reports that they had told Foxconn it couldn’t restart its iPhone production facilities today as scheduled. Reuters reported that Shenzhen authorities are still conducting checks and have yet to make a final decision, but that Foxconn apparently expects to receive permission and “tens of thousands of workers” have already returned to the area. The restart of this facility, the most critical iPhone production site, would be a major boost to confidence that the virus is not going to have that big an impact on the global economy and would probably be a major “risk on” signal. I think we could see a quick reversal in trend – some temporary short-covering at least – if an announcement along those lines comes out.
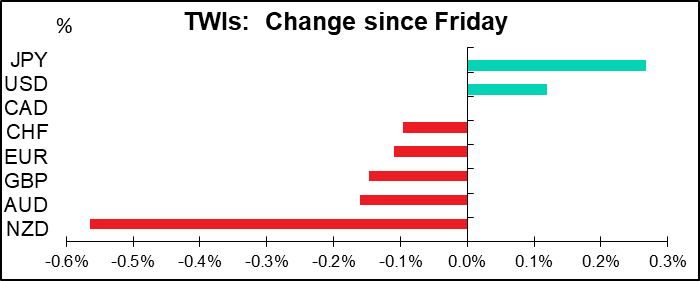
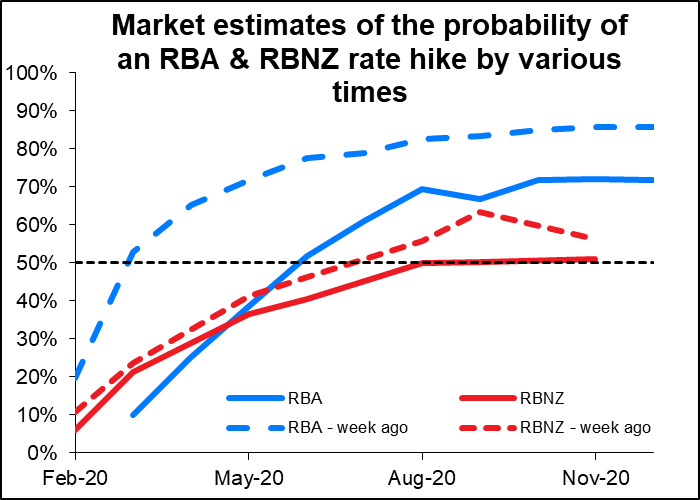
NZD was the biggest loser. I don’t think there was any particlar trigger – it just fell steadily during the European and US day Friday. My guess is that traders are anticipating a dovish tone from the Reserve Bank of New Zealand (RBNZ) at its meeting Wednesday morning. Probably the pressure is coming from buying of AUD/NZD, partially in response to Reserve Bank of Australia (RBA) Gov. Lowe’s testimony to the House of Representatives Economic Committee on Friday, where he signalled that a long pause in rates was likely. As the graph shows, expectations of a rate cut in Australia have come down sharply over the last week, while barely changing in New Zealand. It’s this dynamic that’s pushing AUD/NZD higher, I would assume, even though in my view Australia is likely to be hit harder by the coronavirus crisis in China than New Zealand is. Traders pushed AUD/NZD back up to 1.0461, just past the recent high (1.0459, set on Jan. 15th) but it’s come back down from there. That will leave 1.0460 as the major resistance level.
That’s not to say AUD was particularly strong. AUD/USD fell to 0.6660 at one point, below 0.6671, which was the previous post-2009 low made in October last year.
Elsewhere it was a typical risk-off day, with JPY and the safe-haven USD gaining. USD is not only benefiting from safe-haven flows but also from good economic performance, as shown by the better-than-expected nonfarm payrolls and average hourly earnings on Friday.
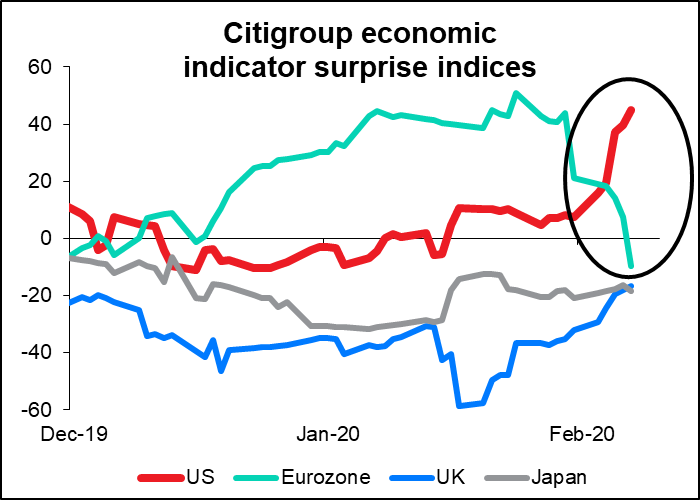
EUR/USD continued its recent decline but has started to bounce this morning a bit above 1.0940, a prior low and what seems to be the technical target for the market at the moment. The US economy’s outperformance vs Europe is becoming more evident as US data suprises to the upside, while EU data surprises to the downside – Friday’s German industrial production (IP) data was very weak, coming in at -3.5% mom vs -0.2% expected, similarly France IP was -2.8% mom vs -0.3% expected. The Citi EU economic indicator surprise index has now turned negative, whereas the US indicator is continuing to climb higher (see graph).
Germany Q4 GDP figures are out on Thursday, but since a) Germany has already issued full-year figures and b) the EU has already issued its preliminary Q4 GDP estimate, these should be no surprise.
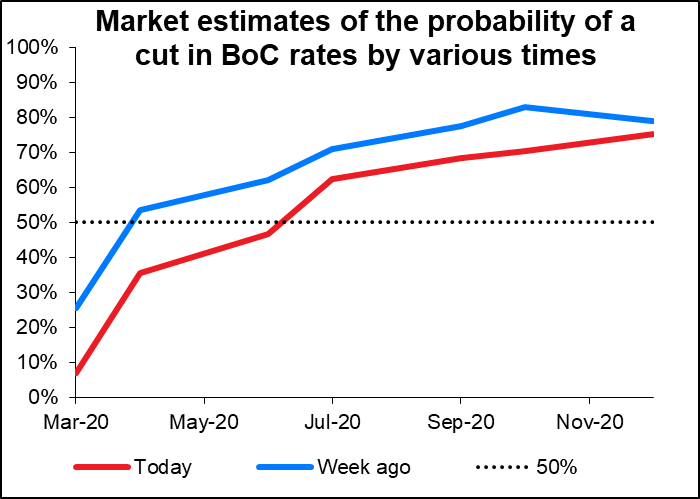
CAD was relatively strong among the commodity currencies, with USD/CAD barely changed. Friday’s Canadian labor market data was stronger than expected, with the unemployment rate falling rather than rising as expected and net change in employment around double what the market expected (plus it all came through full-time employment, with part-time employment actually falling a bit). Hourly wages also rose more than expected. The news resulted in the market cutting back its estimate of the likelihood of a rate cut by the Bank of Canada this year and thereby supported CAD despite the further fall in oil prices. I think CAD will probably perform the best of the commodity currencies during this coronavirus scare and would expect CAD to gain vs AUD and NZD.
GBP was hit by comments Friday from US VP Pence, who said the US is “profoundly disappointed” with Britain’s decision to include the Chinese company Huawei in its 5G mobile phone system. Asked whether the decision could prove to be a “deal breaker” in the upcoming US-UK trade talks he replied only, “we’ll see.” It was reported last week that Trump was “apoplectic” about the decision, and as we’ve seen with the decision to fire everyone who testified against Trump in the recent impeachment process, this administration doesn’t hesitate to take revenge against people who cross it. The UK is pinning a lot of its Brexit hopes on negotiating a successful and beneficial trade agreement with the US to compensate for what’s inevitably going to be a worse trade agreement with the EU. If it winds up with a worst agreement with the US too, that will only confirm that Brexit will be an economic disaster for the UK.
Nonfarm payrolls update
For those of you who were on the conference call with me about Friday’s US nonfarm payrolls (and also those who weren’t), I was pleased to note that this week’s Economist magazine had an article echoing what I said: “Traders lose interest in America’s jobs report. Markets react less to jobs data than they did before the financial crisis” They agreed with me that “The reason for the subsequent lack of interest is that falling unemployment is no longer a good guide to the Fed’s actions.”
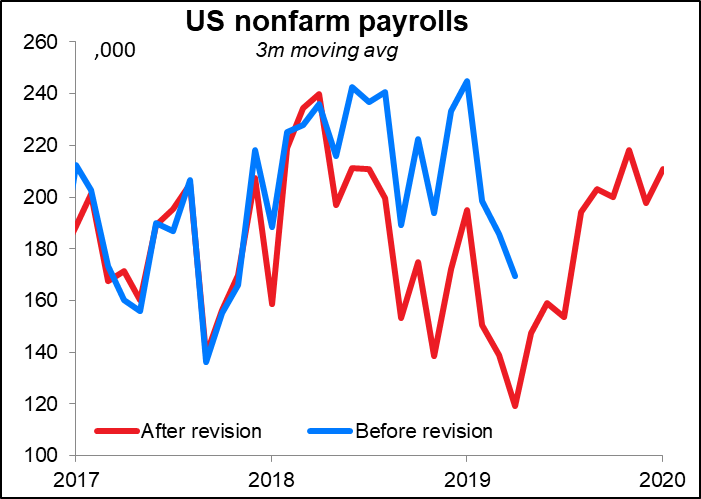
When the report came out much better than expected, I was surprised that the impact lasted only seconds. The reason may be because of something that I wasn’t monitoring: the annual benchmark revisions. These took 505k jobs (-0.3%) off from the level of payroll employment through March 2019, which cut the average 12-month gain in jobs through March 2019 down to 169k from 210k previously. On the one hand, that’s bad. On the other hand, it means job growth has clearly reaccelerated from the April 2019 lows, back to where it was for most of 2018. (Sorry, I don’t have the pre-revision data after May of last year, which is why the blue line is incomplete.) I still say the figures were exceptionally good and should support USD at least in the beginning of this week.
Commitments of Traders report
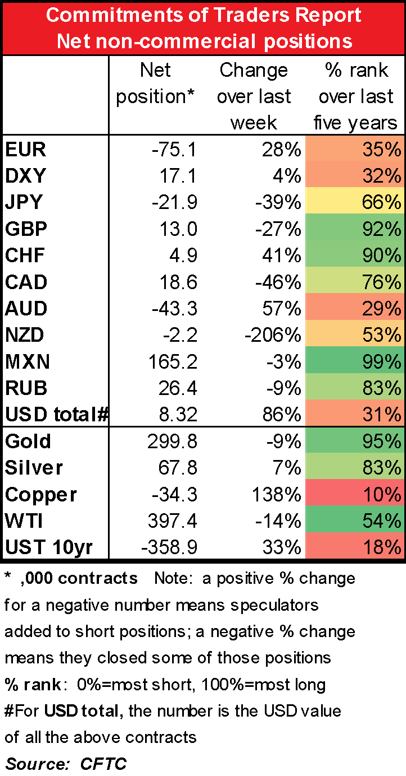
Again, some big changes in positioning, but that isn’t being reflected in volatility, which remains low.
The main point I’d make is that speculative positions are not yet fully reflecting a “risk off” environment. There’s plenty more room for specs to get long the safe-haven currencies and short the commodity currencies.
Speculators added to their long DXY positions, but they remain historically low. Spec cut their JPY shorts but remain fairly short there. CHF longs went up a lot in percentage terms and are fairly high in historical terms, but are quite low in absolute terms. Lots more room to go there too.
Meanwhile, specs are still long CAD (but cut back). After two weeks of being modestly long NZE, they went short NZD again, but only modestly so. They are short and getting shorter AUD. That seems to be the favored trade, as one might well imagine, since it’s the G10 economy most closely tied to China.

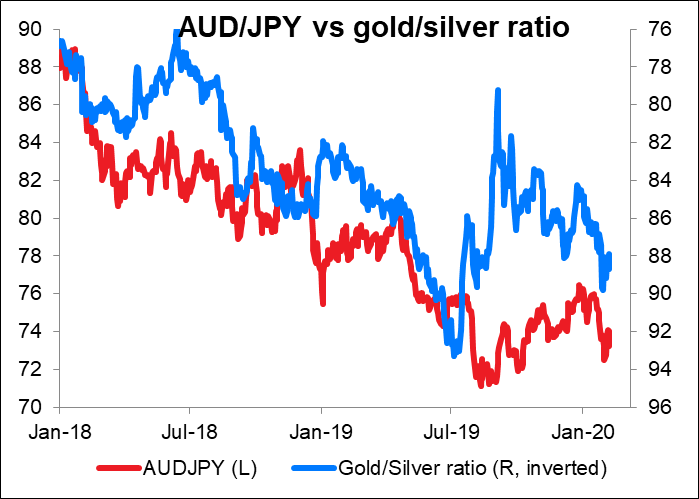
Specs cut their gold longs but added to silver longs. This worked out for them as gold fell during the week in question but silver rose. The gold/silver ratio is a pretty good “risk on/risk off” indicator, as is AUD/JPY.
Today’s market
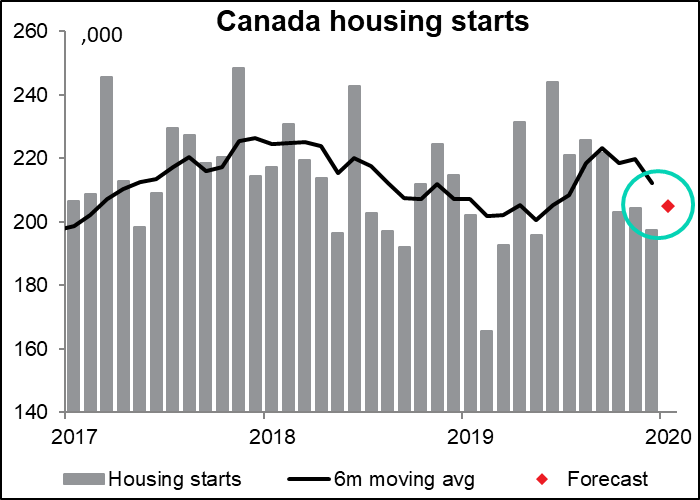
There’s barely any economic indicators on the schedule for today, except for Canadian housing starts & building permits. Starts are expected to rebound above the level fo the last three months (205k vs average of 201.5k in Q4). In its last statement, the Bank of Canada said that “residential investment was robust through most of 2019, moderating to a still-solid pace in the fourth quarter.” If the BoC thought 201.5k was a “solid pace,” they’ll think 205k is even more solid. CAD positive
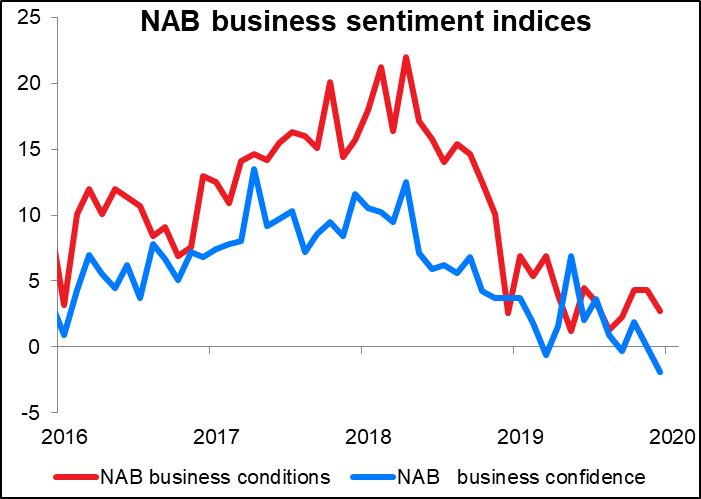
There are no forecasts for the National Australia Bank (NAB) business indicators, but I love to make graphs, so here’s one of just the actual data so you can see the trend. It wouldn’t surprise me to see both indicators decline further.
