Rates as of 04:00 GMT
Market Recap
You’ll want to keep this picture as a memento of one of the more memorable days you were trading:
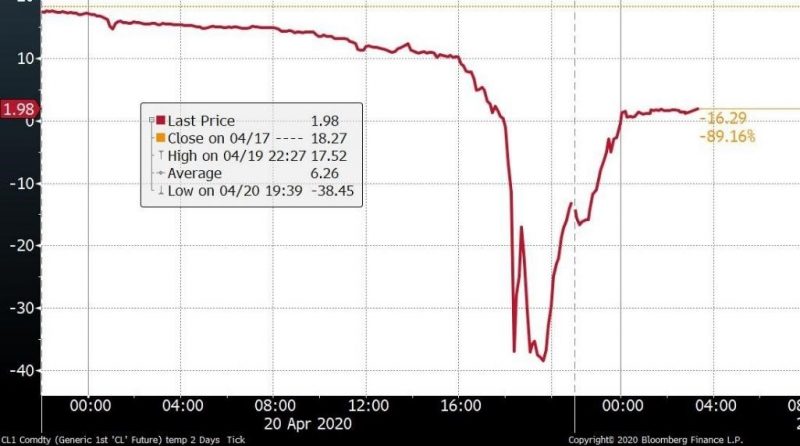
It’s a graph of the May 2020 West Texas Intermediate (WTI) futures contract (CLK0), which as I pointed out yesterday was under pressure as people who were long the contract desperately tried to close out their positions before today’s expiry. Well, apparently the shorts held the longs’ feet to the fire and the contract went negative for the first time ever — -$38.45 negative at one point, to be exact!
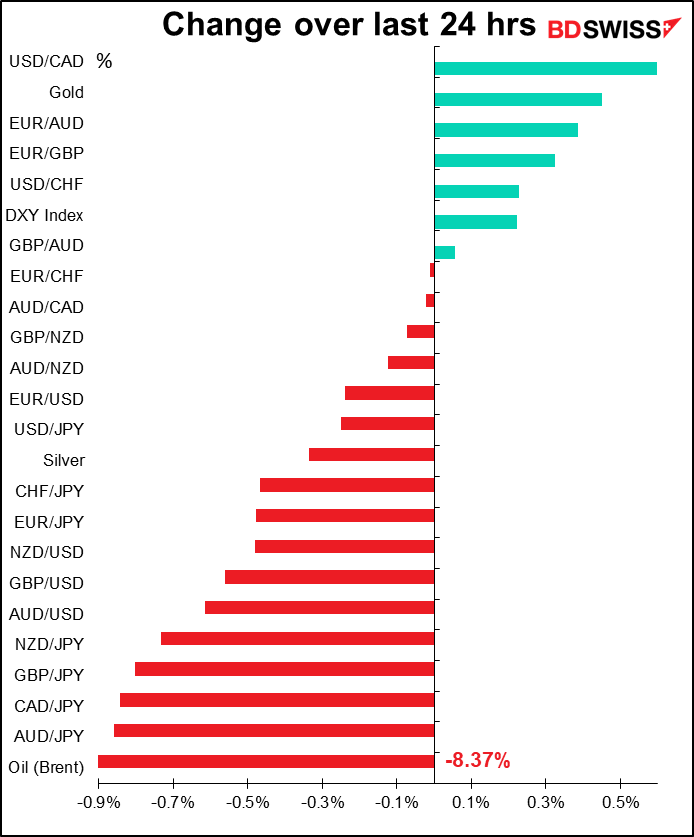
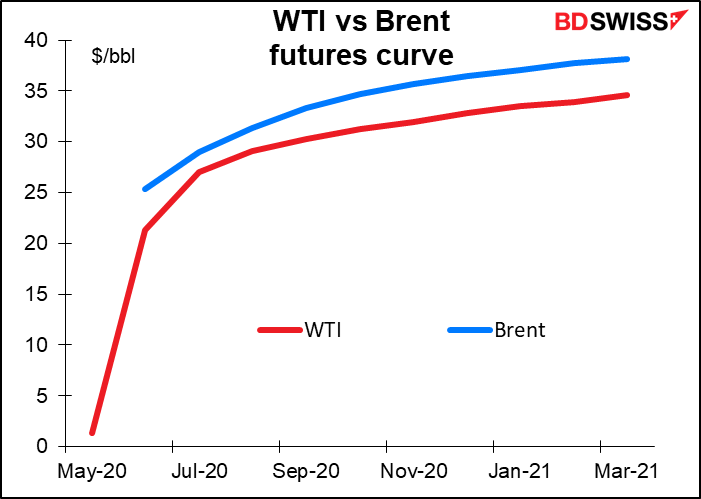
Note that this bizarre circumstance happened only to the May contract (plus some other oil for immediate delivery – see below). Other months were still positive. The May-June contract roll – the difference between the May and June contracts – is an incredible $19.93 this morning – it normally ranges between -38 cents and +86 cents (that’s cents, not dollars). So it’s not strictly accurate to say that “oil prices went negative,” but rather than “some oil prices went negative.” Nonetheless, oil was hit across the curve – the June WTI contract was down $4.94 or 20% at one point and is currently trading at $21.33, down $3.77 or 15% from Friday’s close. Meanwhile, the near Brent contract (June) fell 8.4% over the last 24 hours.
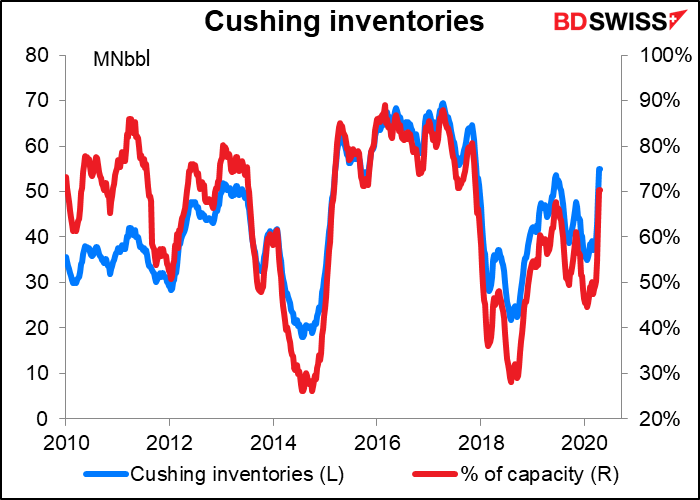
Is this a one-off or will the near contract oil go negative every month as no bid exists to take delivery, given the lack of storage? It’s beginning to look that way: storage at the main delivery terminal for the futures, Cushing, Oklahoma, is getting rather full — it’s about 70% full now.
You might ask, “well, why don’t they just put it in the remaining 30% that’s empty?” Because you have to reserve space, and apparently all the space is already booked (maybe the shorts booked it to freeze out the longs! No idea, I’m just speculating.)
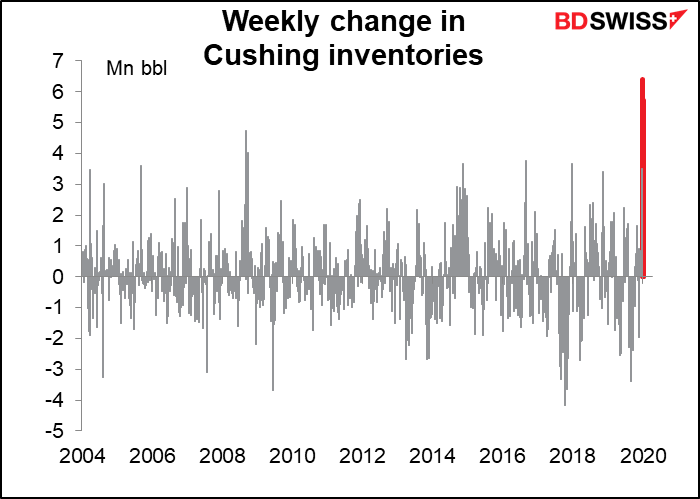
The last three weeks have seen a tremendous increase of 15.7mn barrels in the amount stored in Cushing – more than double the previous record three-week increase (7.5mn barrels in Jan 2015). The weekly increases of 3.5mn barrels in the week to 27 March, 6.4mn the next week, and 5.7mn the next compare with the previous record one-week increase of 4.7mn barrels (Dec 2008). So even if it’s only at 70% of capacity now, at this pace the writing is on the wall – the wall of the storage tanks.
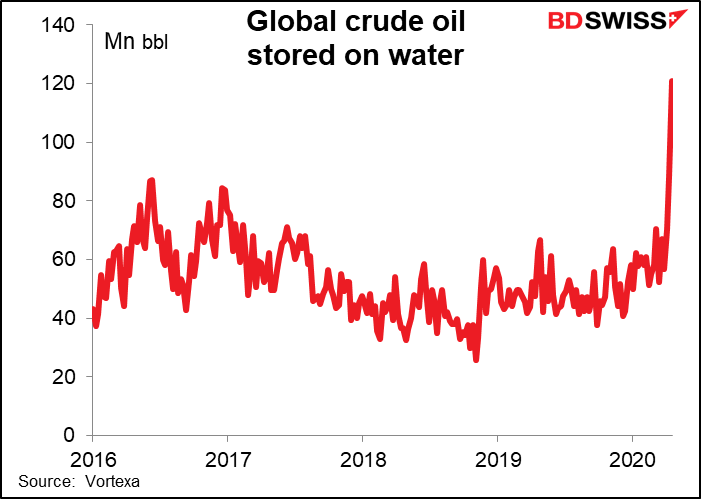
The amount of oil stored in tankers on the water has also gone shooting up.
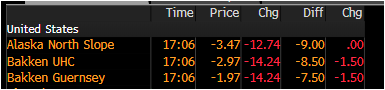
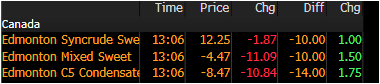
As a result, it’s not just the futures market — some inland crudes that are expensive to transport are already trading negative. IE, the oil company will pay someone to take it off their hands. Why would a crude trade negative? Why doesn’t the oil company just turn off the tap? Because that can damage the geological formation and reduce the amount of oil that can be extracted over the long term. If the company thinks that the problem is temporary, they may prefer just to absorb the loss for a limited time rather than writing off the whole project.
Negative oil prices are not only bad for oil – they create a massive risk to all financial markets. That’s because there are a lot of commodity derivatives — $2.1tn outstanding, according to the BIS. Falling commodity prices mean margin calls means demand for dollars. It’s also likely to mean bankruptcies, as whoever was holding those long positions is in a heap o’ trouble now.
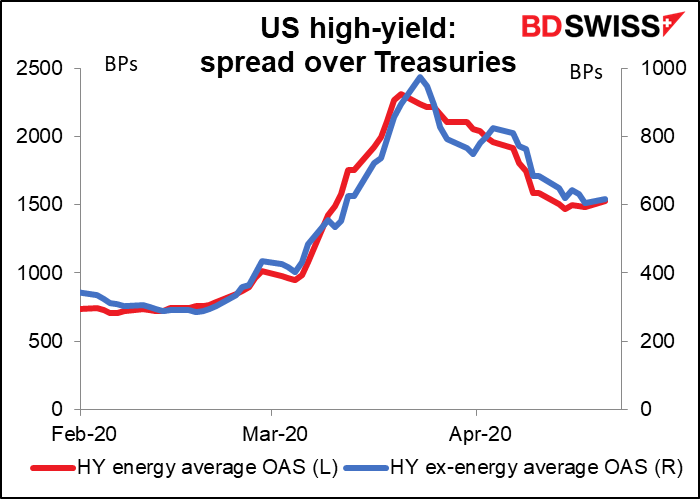
Oddly enough, the spread of “high yield” (aka junk bonds) in the energy sector didn’t rise that much – probably due to the Fed’s backstop (the Fed said it’s willing to buy bonds that were downgraded as long as they were investment grade before the crisis began). Also, the energy sector in the S&P 500 was down only 3.3% vs a 1.8% fall in the market overall – not the kind of carnage one might have expected.
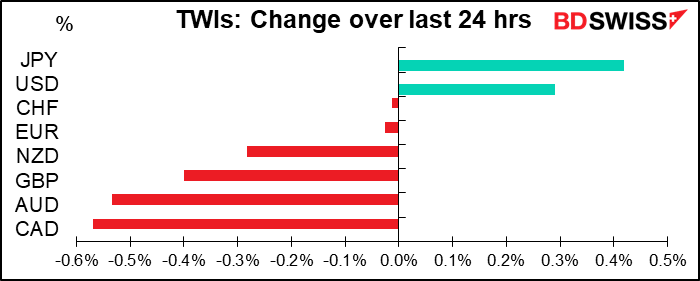
Currencies: Given the upheaval in the oil market, it’s no surprise that CAD was the worst-performing currency (worse even than NOK) and that the commodity currencies in general were weak. Also that JPY was the best performer as stock markets sagged. USD got a safe-haven bid, not to mention margin calls as I pointed out above.
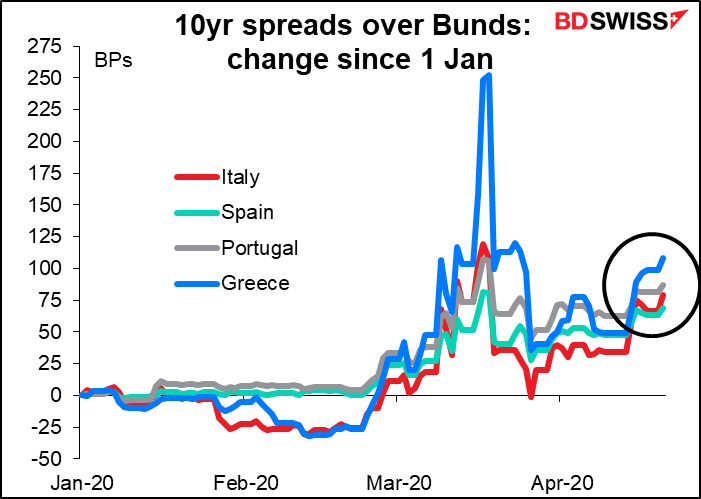
EUR is suffering as markets contemplate the increased borrowing that will be necessary to fund the recovery. There was another wave of bill issuance yesterday from Germany (EUR 3.2bn), the Netherlands (EUR 920mn), and France (EUR 1bn). Belgium reported that its 2019 budget deficit was already 1.9% of GDP before the virus even hit – more than double the previous year’s 0.8% of GDP — not what investors want to hear after Friday’s projection of increased bond issuance this year. Italy announced it would issue 5-year and 30-year bonds. The Bank of Spain came out with some pessimistic economic projections (2020 GDP is likely to contract by 9.5% this year, could be as bad as -12.5%; the budget deficit could widen to between -7% to -11% of GDP; and unemployment, already near 14%, could average 18%-22%). Germany’s Bundesbank said in its monthly bulletin that a rapid economic recovery was unlikely.
With all the funding concerns, peripheral Eurozone bond spreads have been widening, led Italy as Italy seems reluctant to tap the European Stability Mechanism (ESM) because of concerns about what conditions may be attached to borrowing from it. Thursday’s European Council videoconference is becoming more and more crucial.
GBP also weakened against a stronger dollar. The resumption of trade negotiations between the UK and EU leaves GBP open to Brexit headlines and therefore more distinct idiosyncratic movements than other currencies, which are mostly still in thrall to the “risk on, risk off” wave.
Wondering what affect the pandemic may have on the global economy? The Bank for International Settlements (BIS) just released a study, “Macroeconomic effects of Covid-19: an early review.” Their conclusions, in short, were:
- Past epidemics had long-lasting effects on economies through illness and the loss of lives, while Covid-19 is marked by widespread containment measures and relatively lower fatalities among young people.
- The short-term costs of Covid-19 will probably dwarf those of past epidemics, due to the unprecedented and synchronised global sudden stop in economic activity induced by containment measures.
- The current estimated impact on global GDP growth for 2020 is around -4%, with substantial downside risks if containment policies are prolonged. Output losses are larger for major economies.
The most important takeaway that I got from the article was that no one really knows – we’ve never had a global “sudden stop” like this before. And as the article points out, the shutdown will have its own long-term effects:
There are also possible long-term damages from a prolonged economic shutdown, harder to quantify but potentially significant. Bankrupt firms will make no output contribution after containment is lifted, and could disrupt supply chains of surviving firms. Unemployed workers could lose skills and long-term relationships with firms which are costly and take time to re-establish. Hardship and demoralisation could in turn have an impact on labour productivity. Experiences from past recessions suggest that these scars on the economic fabric can be deep and persistent.
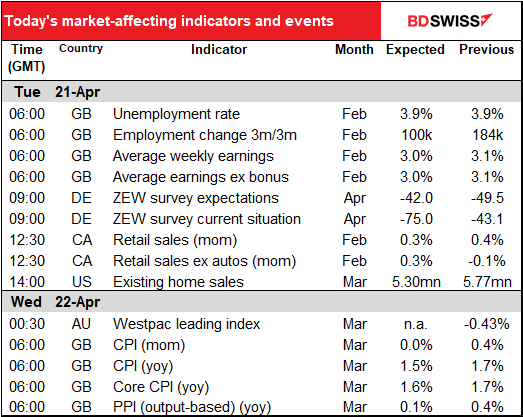
Today’s market
We discussed the UK employment data yesterday. In brief, no one cares because it’s February’s data and the UK didn’t go into lockdown until 23 March. We won’t be able to get a good grasp of what’s happening in the UK until we see the April data.
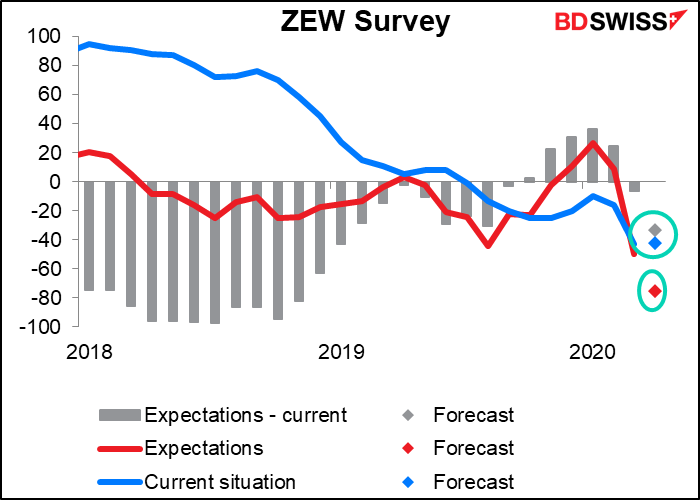
The ZEW survey is a survey of analysts, pundits and other useless types who don’t actually do anything. This month’s figures are interesting – the “current situation” indicator is forecast to improve slightly, for reasons beyond my imagination, while the “expectations” indicator is forecast to fall further. The net result will be that people expect the future to be worse than the current situation, although not so much worse.
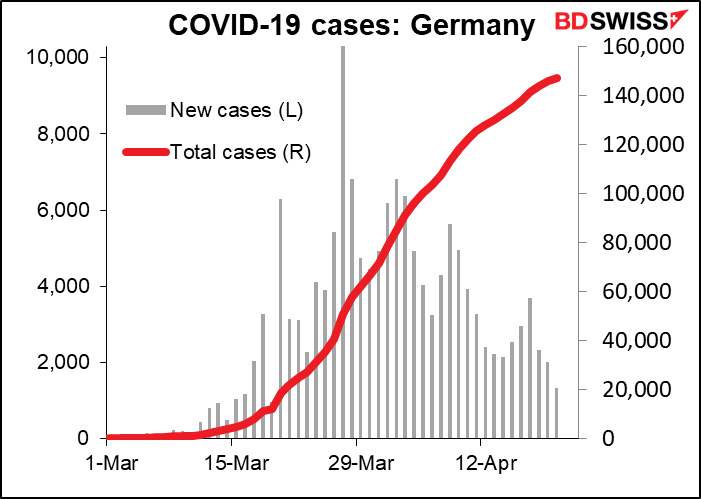
That may be because the number of new virus cases in Germany seems to have peaked some time ago, although it remains significant.
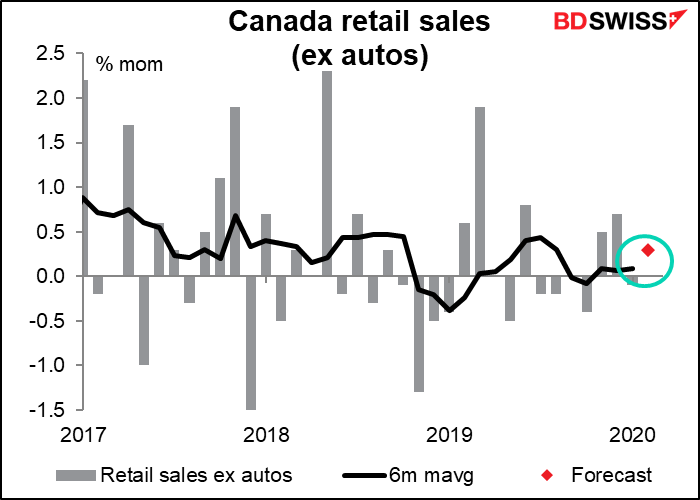
Canadian retail sales are for February data and so are of purely historical interest. They do show though that the Canadian economy was hardly roaring along back in February.
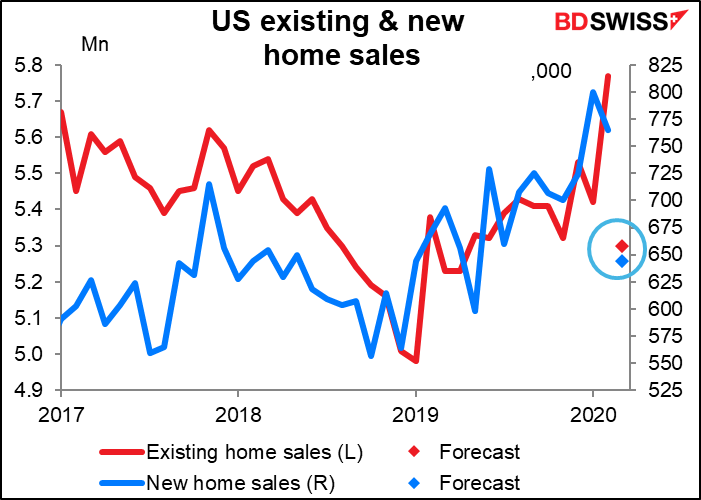
US existing home sales for March are expected to be lower, but not dramatically lower. The February figure was the highest of the post-GFC period and so some pullback would be normal anyway. We’ll have to wait to see the impact of the lockdown on home sales.
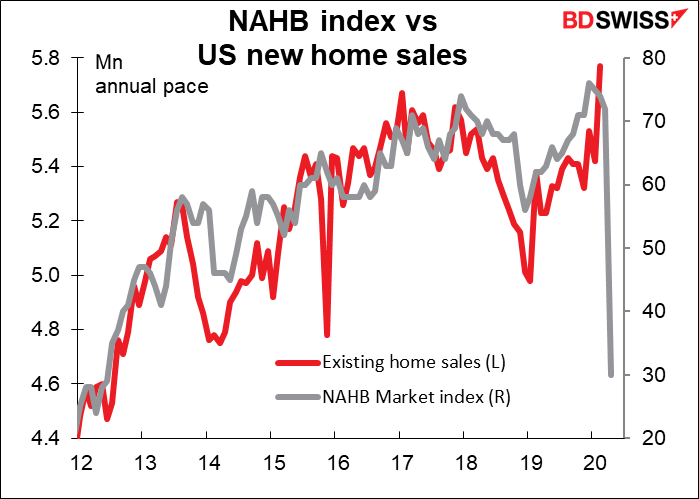
Looking at the National Association of Home Builders’ (NAHB) index, I think there’s a lot worse in store for the US housing market. But that was April’s NAHB index, not March’s, which was still fairly high at 72.
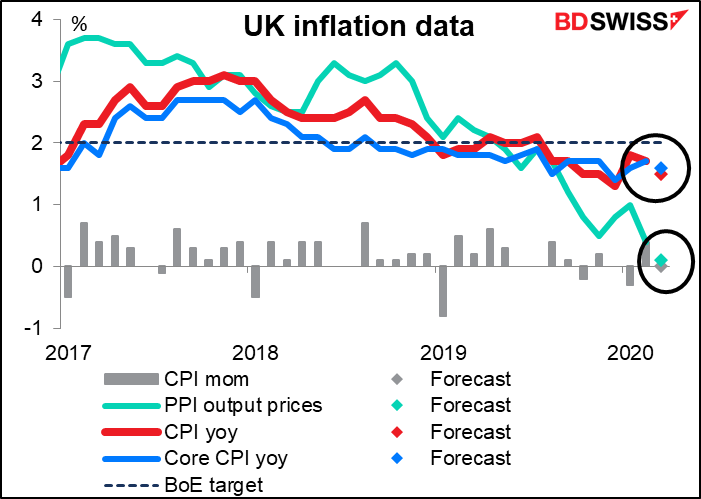
Then once again, we move ahead to the next day in Europe and the early morning UK statistics – this time the UK inflation data. The data are expected to show slowing inflation, with no upstream pressure from producer prices. Ordinarily this might ring alarm bells at the Bank of England, but of course the bells have long since rung and the fire engines left the station. In fact the financial markets are getting hosed down with liquidity even as we speak. So while it’s interesting, it’s not likely to provoke any change in policy, which is already at maximum.