With labor markets in focus all around the world, next week’s US nonfarm payrolls is going to be…well, as important as it always is.
What’s the market looking for? At the moment, a rather encouraging rise of 623k (subject to change without notice). This would be the biggest increase since October.
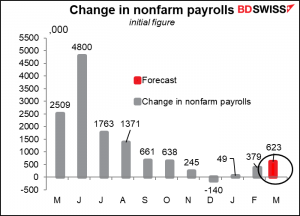
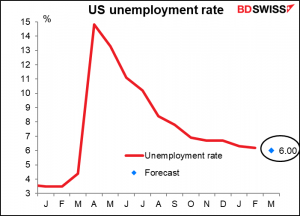
The unemployment rate is expected to fall to 6.0% from 6.3%.
People may be getting encouraged by the recent decline in the initial jobless claims.

I think it might be a little early to break out the champagne, though. We don’t have the data yet for the total unemployment insurance payments for the week of March 12th, the week that the employment survey was taken, but the week before there were 18.953mn people total claiming unemployment insurance in the US – up from 18.029mn the week that the February unemployment survey was taken. So, I think it’s possible that unemployment could actually have risen over the month.
The weekly US jobless claims, which cover people claiming state unemployment insurance, attract the most attention because they’re the most up-to-date data series, but they’re by no means the most complete. They are only small part – about 25% — of the total number of people claiming some sort of unemployment insurance.

How is the US doing relative to other countries? It’s hard to judge, because each country measures unemployment differently and has different programs during this period. The US tends to pay unemployed persons, whereas in many European countries, Australia, and Japan the governments prefer to offer companies support to keep people in employment. Thus, the unemployment rate has risen a lot more in some countries (Canada, US, Norway) than in others (EU overall, UK, Japan). It’s risen a lot in Australia despite this program.
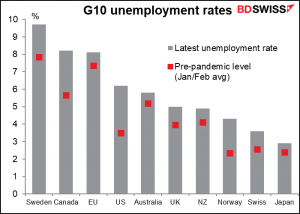
If we normalize* the unemployment rates to put them all on a similar basis, we can see that they basically fall into two groups. The US, Canada, Australia and Switzerland have suffered unusually high unemployment for those countries, whereas the Eurozone, UK and Japan have seen their unemployment rates rise but not to unusual levels. (This says nothing about the actual level of unemployment – for example, in Switzerland it’s 3.6%, which is less than half the EU-wide figure of 8.1%. It’s just that Switzerland normally has extremely low unemployment of 3.0%, whereas the EU average unemployment rate is a much higher 9.4%.)
The leap in unemployment in Australia came despite their JobKeeper Payment scheme, which supports businesses to retain people on their payroll. The program ends at the end of the month so we may see an even higher unemployment rate then.

Note that the US is almost back to normal, in this case normal being the average from 2000 to 2019, which is 5.9% Even if we just take the last 10 years, from 2011, the average unemployment rate was 5.8%, so the results are not so different. The pre-pandemic unemployment level of 3.5% was the historical anomaly, not the recent higher unemployment rate.
*This technique involves taking the average for the period as a whole and then taking the difference between the unemployment rate at any give time and the long-term average, divided by the standard deviation. This tells us how many standard deviations away from the average the unemployment rate is, thereby putting them all on an equal footing with regards to both level and amplitude. This figure is known as the z-score.
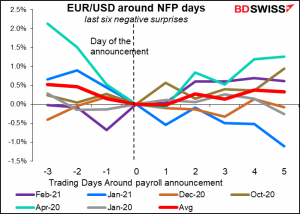
For those interested in taking a position ahead of the figure, or even immediately afterward, I’d like to point out that the NFP doesn’t seem to have had much of a lasting impact on EUR/USD even on the day of the announcement. As you can see from the table below, EUR/USD has generally fallen – i.e., the dollar has strengthened – on NFP days regardless of whether the figure beat estimates or missed estimates.

On average EUR/USD does tend to dip (i.e. USD gets stronger) for a day or two following a positive surprise, although the trend doesn’t last very long.

Similarly, it does tend to rise (i.e. the dollar tends to weaken) after it misses expectations, although the trend here seems to be less pronounced.
Note that next Friday is the Good Friday holiday, meaning that Australia, New Zealand and most of the European centers will be closed. In the US, the NYSE is closed as are some of the futures markets, it’s a half day for the bond market, but it is not a US government holiday so the NFP will be announced as usual.
There’s little else coming out next week from the US. Thursday we get the final manufacturing purchasing managers’ indices for the major economies that have already announced preliminary ones, plus the ones for most of those countries that don’t have preliminary versions. As usual this also brings us the Institute of Supply Management (ISM) version of that index as well, always a biggie on the US calendar.
There are few Fed speakers on the schedule as of today, but one that is, is of great interest: on Monday, newly appointed Gov. Chris Waller will take part in a virtual discussion hosted by the Peterson Institute for International Economics. This is his first speech since joining the Board of Governors last December. Waller is thought to be a confirmed dove, which is why He-Who-Must-Not-Be-Named appointed him. We’ll get to confirm that for ourselves on Monday.
As next week is the end of the month and end of the quarter, there are going to be large rebalancing flows throughout all the financial markets. Generally speaking, this involves buying assets whose prices has fallen and selling assets whose price has risen in order to keep the fund’s allocation steady in percentage terms. For bond investors, this might mean selling NZD and AUD and buying USD and CAD.

Or for global equity funds, it could mean reallocating money out of Japan and into the US. There might also be some flows from EU into the US.
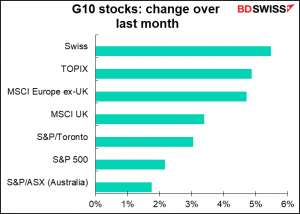
And just to complicate matters there will of course be many investors with balanced portfolios who will be moving money out of some stock markets and into some bond markets. So for example while just looking at equities might suggest flows out of EUR and into USD, the bond market flows suggest the exact opposite, meaning balanced funds might have little or no EUR/USD to trade at all.
These flows, if indeed there are any, may have a significant influence on the market next week as there are no major indicators out before the month-end rebalancing takes place (except perhaps for Wednesday’s ADP report on the last day of the month, so it depends on exactly when the investors choose to rebalance).
The end of the month and end of the quarter brings us a number of Japanese indicators, including employment & retail sales (Tue), industrial production (Wed), and the #1 indicator out of Japan, the Bank of Japan’s quarterly Short-Term Survey of Economic Conditions, universally known by its Japanese acronym, the tankan (Thu).
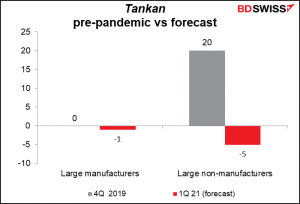
The tankan diffusion indices (Dis) for the large companies, which is what everyone watches, are both expected to rise and the outlook for Q3 is expected to be even better. This would be a good result that could boost confidence in the Tokyo Stock Market and support a “risk-on” mood in Japan that might be negative for the yen, although there is precious little data to go on to see whether that actually happens.
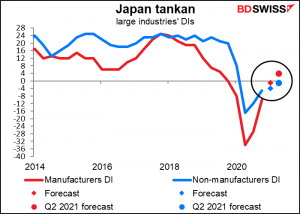
If the consensus forecasts turn out to be correct, it would bring large manufacturers almost back to where they were before the pandemic, but non-manufacturers still have far to go to climb back up.
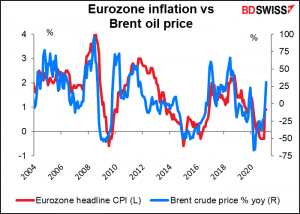
In the EU the focus will be on the German consumer price index (CPI) on Tuesday and the EU-wide CPI on Wednesday. They’re expected to leap higher, with the German CPI even coming back to the European Central Bank (ECB)’s 2% target! Rising oil prices, index-reweighting, and VAT changes in Germany are some of the temporary reasons for the higher inflation. The ECB’s recently revised forecasts for inflation are 1.5% this year, 1.2% next year and 1.4% in 2023 – all below their target. Their explanation was:
Inflation has picked up over recent months mainly on account of some transitory factors and an increase in energy price inflation. At the same time, underlying price pressures remain subdued in the context of weak demand and significant slack in labour and product markets. While our latest staff projection exercise foresees a gradual increase in underlying inflation pressures, it confirms that the medium-term inflation outlook remains…below our inflation aim.

Just looking at the change in oil prices, a higher headline inflation rate seems inevitable – but fleeting, as the higher oil prices will inevitably drop out of the calculation a year from now unless they keep rising and rising.
Canada announces its monthly GDP on Wednesday. No forecast yet available.
Australia has a number of indicators coming out during the week, including private sector credit and building approvals on Wednesday and the trade balance on Thursday. Of these, building approvals are probably the most important. Following the previous month’s sharp 19.4% mom decline, they’re expected to rebound around 5% as owner-occupiers take advantage of the Government’s extended HomeBuilder package.

