PREVIOUS TRADING DAY EVENTS – 15 Sep 2023
Factory activity in the state rose to 1.9 this month from negative 19.0 in August. Readings above zero indicate expanding activity.
The index’s six-month outlook on capital spending weakened, being in line with expectations of slower growth and falling to 10.3 basis points from last period’s 13.6 points.
Source: https://www.reuters.com/markets/us/new-york-state-factory-activity-picks-up-new-york-fed-2023-09-15/
The survey’s barometer of current economic conditions fell, but its gauge of consumer expectations edged higher.
Household expectations for near-term inflation fell to the lowest in more than a year.
“Both short-run and long-run expectations for economic conditions improved modestly this month, though on net consumers remain relatively tentative about the trajectory of the economy,” survey director Joanne Hsu said in a statement.
The survey’s one-year inflation expectation fell to 3.1% – the lowest since March 2021 – from 3.5%, while the five-year inflation outlook slid to a one-year low of 2.7% from 3.0%.
______________________________________________________________________
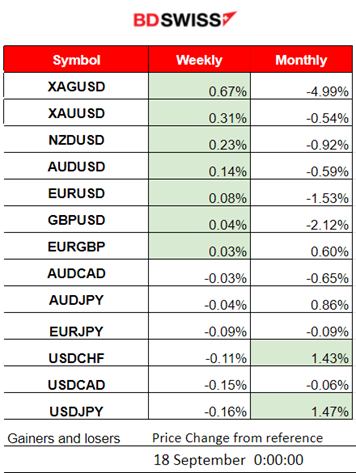
Winners vs Losers
______________________________________________________________________
News Reports Monitor – Previous Trading Day (15 Sep 2023)
Server Time / Timezone EEST (UTC+03:00)

- Midnight – Night Session (Asian)
No special news announcements or important scheduled figure releases.
- Morning–Day Session (European and N. American Session)
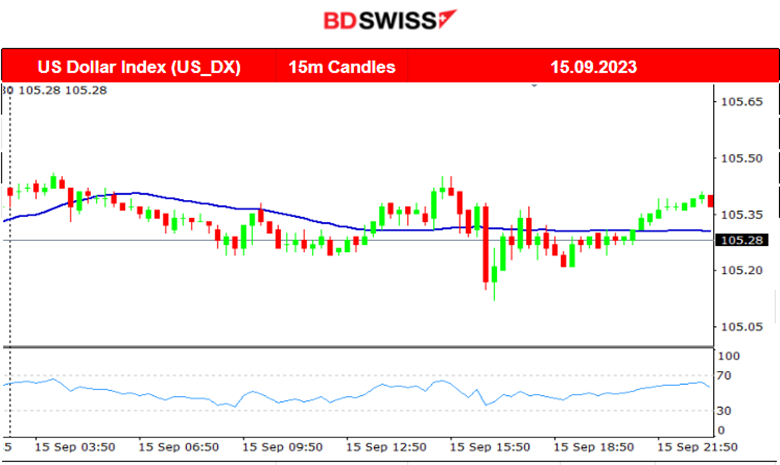
According to the Empire State Manufacturing survey Business activity did not change much in the State of New York. The relevant index rose to 1.9, a 21-point increase. The impact on the dollar was minimal.
The Preliminary UoM Consumer Sentiment report showed that inflation expectations plunged, 5-10 years 2.7% vs. the prior 3.0%. U.S. Sept prelim UMich consumer sentiment 67.7 vs. the expected 69.1. Some effects were observed concerning the dollar but no major shock was observed at the time of the release.
General Verdict:
____________________________________________________________________
FOREX MARKETS MONITOR
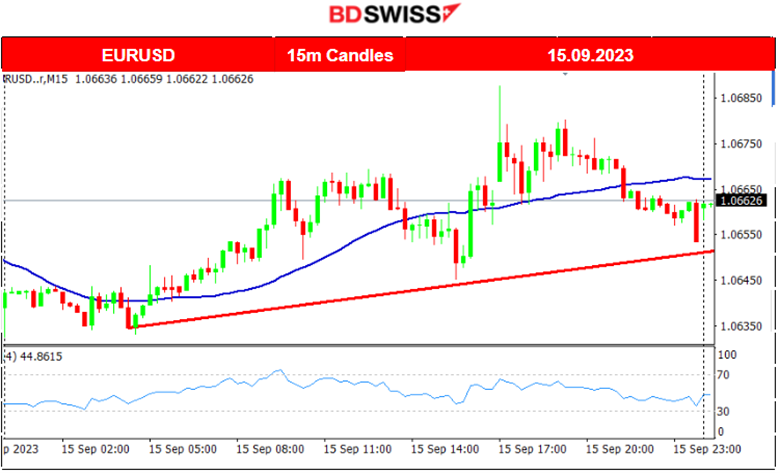
EURUSD (15.09.2023) Chart Summary
Server Time / Timezone EEST (UTC+03:00)
Price Movement
The pair experienced low volatility during the trading day but however, moved more to the upside. The dollar-related figures had no major impact and that is why the pair moved sideways around the mean (30-period MA).
___________________________________________________________________
CRYPTO MARKETS MONITOR
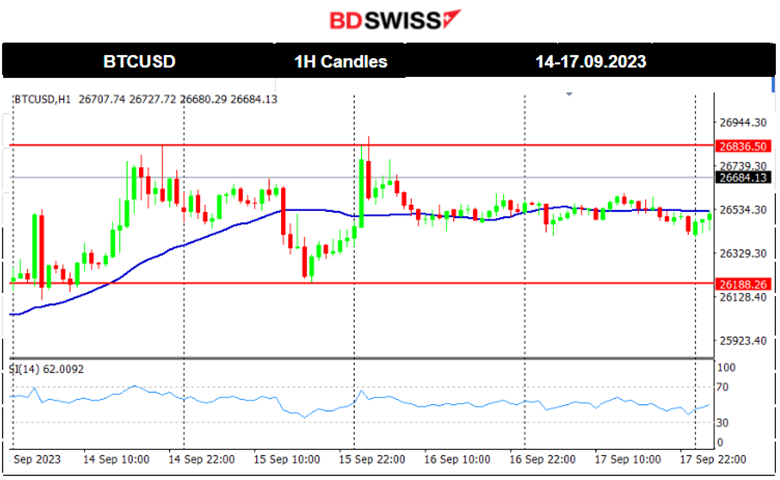
BTCUSD (Bitcoin) 4-Day Chart Summary
Server Time / Timezone EEST (UTC+03:00)
Price Movement
Bitcoin does not see much movement these days. Since level 25800, it has significantly moved to the upside steadily. Even though U.S.-related figures and reports are released, the impact on BTCUSD is minimal. Inflation bumped modestly higher during the August CPI reading to a rate of 3.7% change for example. This caused some volatility but the overall path was sideways the last couple of days after it moved to the upside.
Crypto sorted by Highest Market Cap:
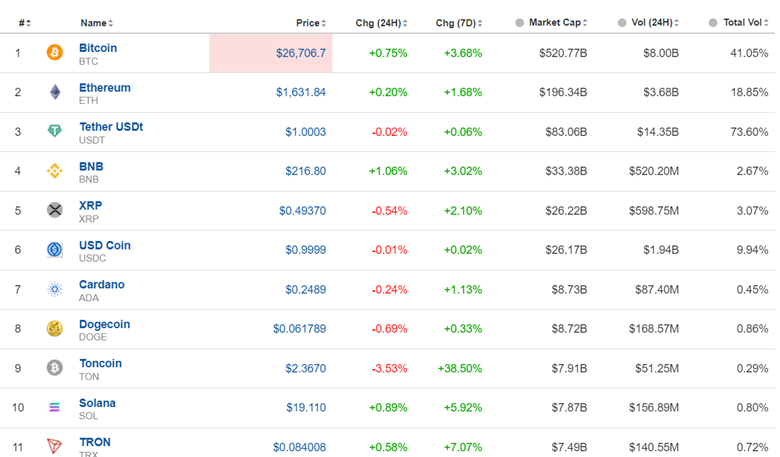
It is clear that Bitcoin and the other Crypto moved more to the upside in the last 7 days. Toncoin experienced a 38.5% change this time.
Source: https://www.investing.com/crypto/currencies
______________________________________________________________________
EQUITY MARKETS MONITOR
NAS100 (NDX) 4-Day Chart Summary
Server Time / Timezone EEST (UTC+03:00)
Price Movement
All the benchmark indices suffered a downfall on Friday. The market is quite volatile for stocks. Businesses see high costs as U.S. oil is moving higher and higher, inflation is still moving upward according to the latest report and a risk-off mood is probably dominating at the moment. A retracement back to 15290 might happen next.

______________________________________________________________________
COMMODITIES MARKETS MONITOR
USOIL (WTI) 4-Day Chart Summary
Server Time / Timezone EEST (UTC+03:00)
Price Movement
Crude price has been following a long-lasting upward trend and is now over 90 USD/b. It remains above the 30-period MA even though it moves with high volatility. Significant support was found at near 88.70 USD/b. RSI suggests that the price might test that level again since it forms a bearish divergence.

XAUUSD (Gold) 4-Day Chart Summary
Server Time / Timezone EEST (UTC+03:00)
Price Movement
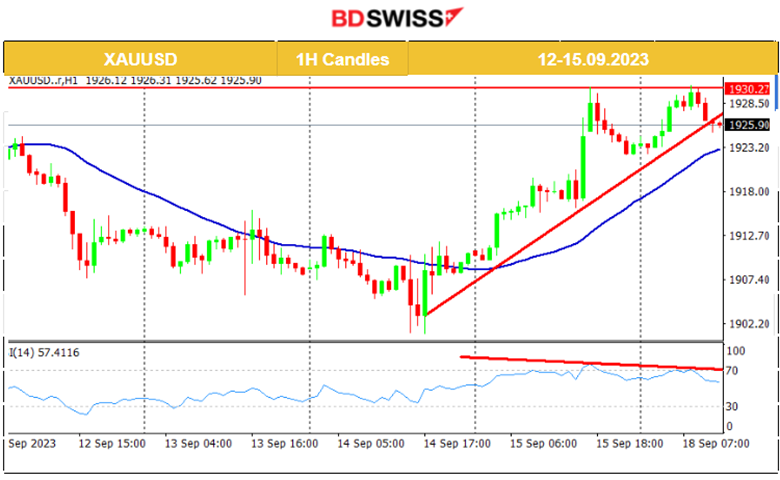
Gold started to move significantly upwards since the 14th, reversing and crossing the 30-period MA as it went upwards. There was an obvious increase in demand for metals the last week and as it seems the dollar strengthening had not kept their price stable. The price found resistance at around 1930 USD/oz and the RSI signals a probable fall next.
______________________________________________________________
News Reports Monitor – Today Trading Day (18 Sep 2023)
Server Time / Timezone EEST (UTC+03:00)

- Midnight – Night Session (Asian)
No special news announcements or important scheduled figure releases.
- Morning–Day Session (European and N. American Session)
No special news announcements or important scheduled figure releases.
General Verdict:
______________________________________________________________


