Note: This week we have added a section on equity positioning. This includes the Commitment of Traders Report data on DJIA and NASDAQ futures, put/call ratios in the options market, and a survey of retail investors. We also added graphs of the gold and silver holdings of exchange-traded funds (ETFs), which are key players in those metals.
FX
Commitments of Traders (CoT) report
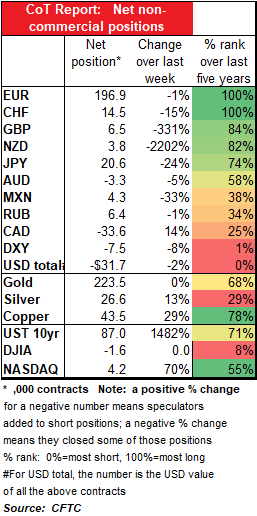
Speculators mostly just cut positions over the last week, except for CAD, where they increased their shorts. This would be typical behavior if everyone were just going on vacation.
NZD and GBP both flipped from negative to positive.
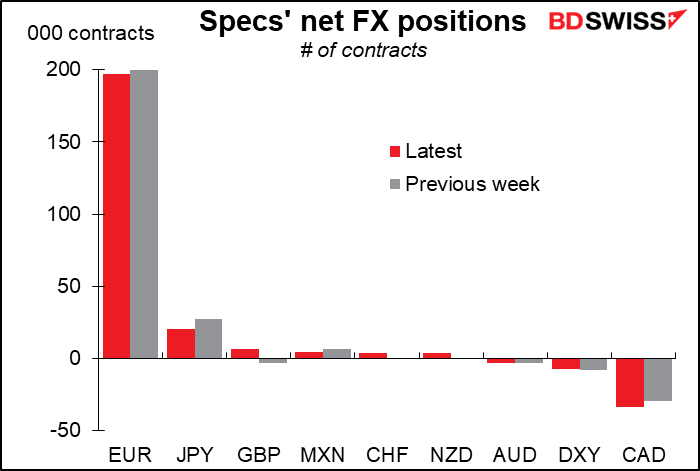
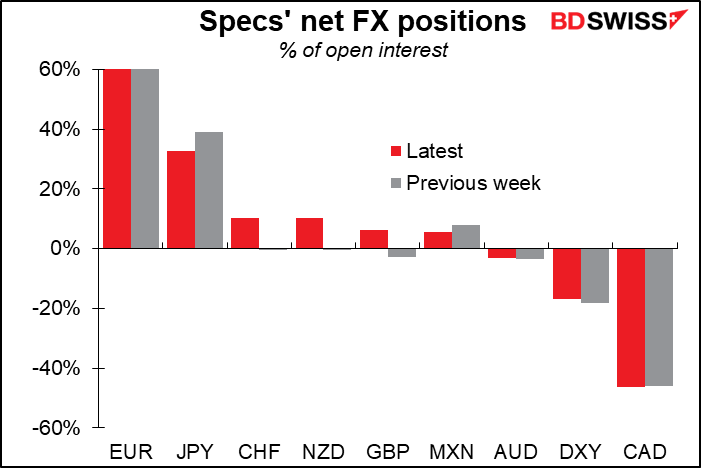
None of the positions is extremely concentrated relative to its size in comparison with the others.

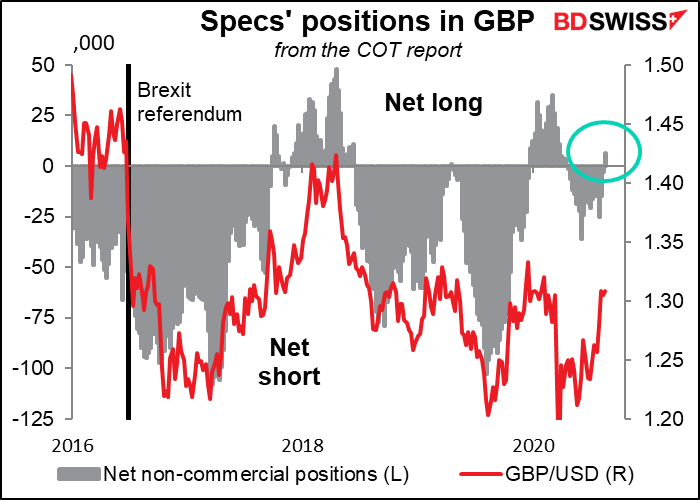
GBP positioning had been negative since 21 April.
Since the Brexit referendum, sentiment toward GBP has been quite volatile and mostl negative. It has only gong modestly positive (net 43k contracts) compared with extremely short (-108k contracts). This time, the change in positioning had nothing to do with the Brexit talks, which continue at an impasse even while the clock clicks down to the deadline.
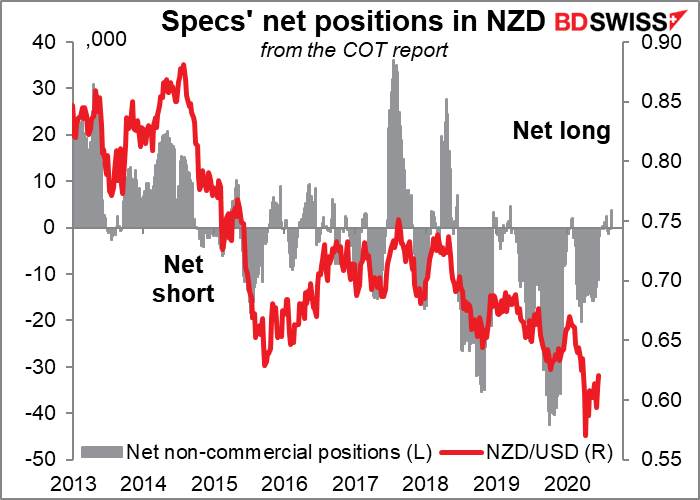
NZD has gyrated around flat since 16 June, moving in an extremely narrow range between -1.9k contracts (16 June) to +3.8k (this week). As the graph shows, this is typical for NZD. It frequently goes through periods when positioning is small and moves back and for the between positive and negative before finally the market takes a view and goes extremely long or short. In this case I’m just surprised it hasn’t gone extremely short by now. Either they’re waiting for the Reserve Bank of New Zealand (RBNZ) to pull the trigger on negative rates or they’re looking for the timing to go long. I think this positioning suggests that we could be in for a big reversal in NZD, which has been the worst-performing G10 currency so far this year.
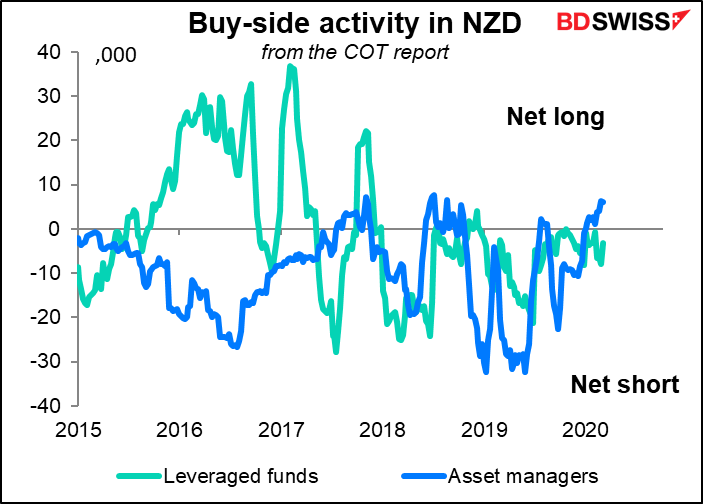
Asset managers vs leveraged funds: Breaking down the participants further, it astonishes me to see that leveraged funds (i.e., hedge funds) are barely participating in the NZD trade even though as I said it’s been the worst-performing currency this year. There should be more momentum traders & trend-following funds that want to get involved! The absence of leveraged funds when the currency is going down like this suggests to me that either they are out of the currency because of liquidity concerns (which weren’t a problem back in 2017) or they suspect something’s up. Asset managers have in fact started going long NZD
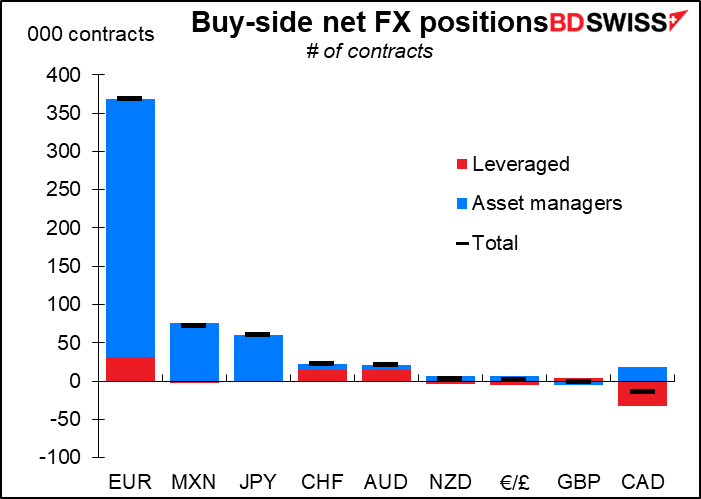
In fact, leveraged funds remain relatively unimportant in the futures market overall. They’re most active in EUR and CAD.
Last week GBP was the larges6 net short position among these investors but this week it’s CAD, one of the two currencies where hedge funds are most active.

Retail investors
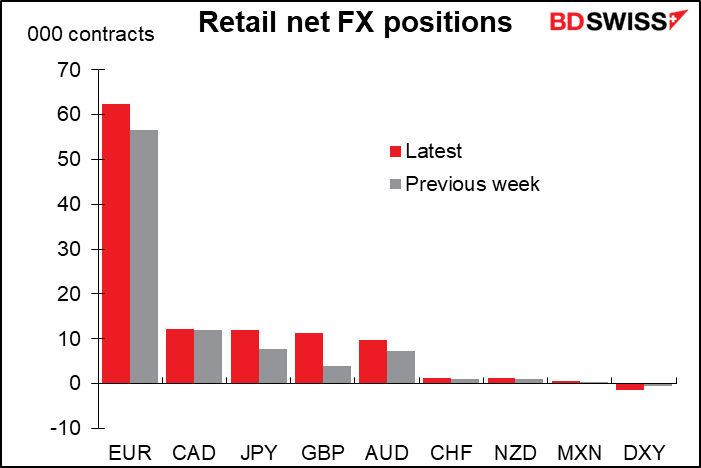
While professional speculators took risk off last week, retail investors added risk. Net positions of retail traders increased in all currencies.

Risk reversals (RR)
No major changes in the ranking of the risk reversals. A few currency pairs changed place with the one next door, notably USD/NOK moved from 4th to 3rd place and USD/SEK moved from 6th to 5th.
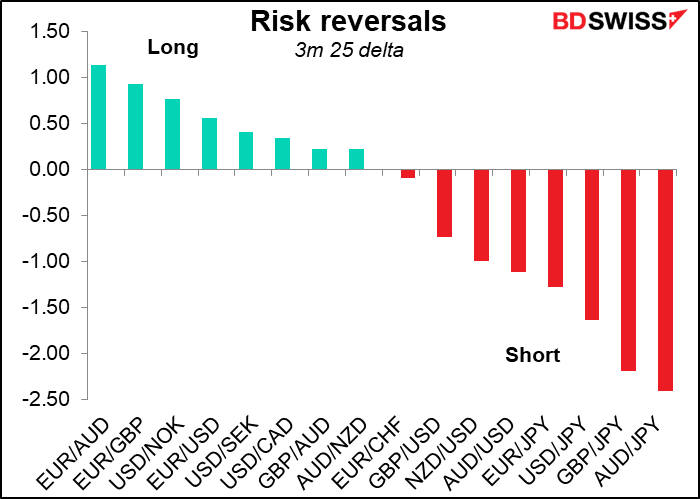
RR rates changed a lot more this past week than the week before.
There’s been a lot of change in USD/NOK RR. They were the biggest decliner in the previous week, but this last week they were the biggest gainer. They went from the bottom of the table to the top, probably connected with last week’s Norges Bank meeting.
AUD/USD RR continues to climb while EUR/AUD fell the most. That means the market sees notably less risk around AUD now than it did in the previous week, perhaps because of the improvement in the manufacturing purchasing managers’ indices.
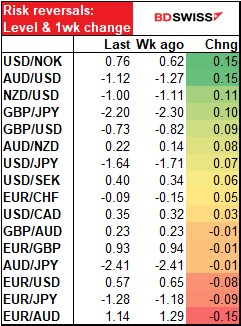
AUD/NZD was an outlier, but that’s only because the RR is usually so steady – normally it’s zero. So even a small rise stands out as a big move when normalized.

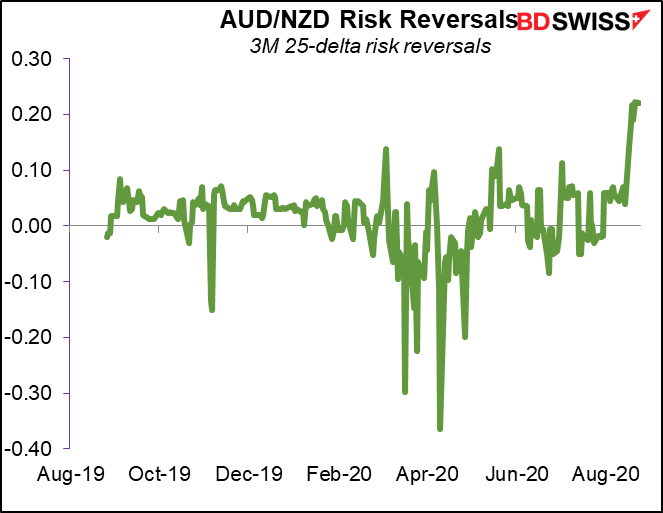
You can see how this week’s rate of 0.22 for the AUD/NZD RR is nothing copared to the other AUD RRs, which are order of magnitude greater.

Gold & Silver
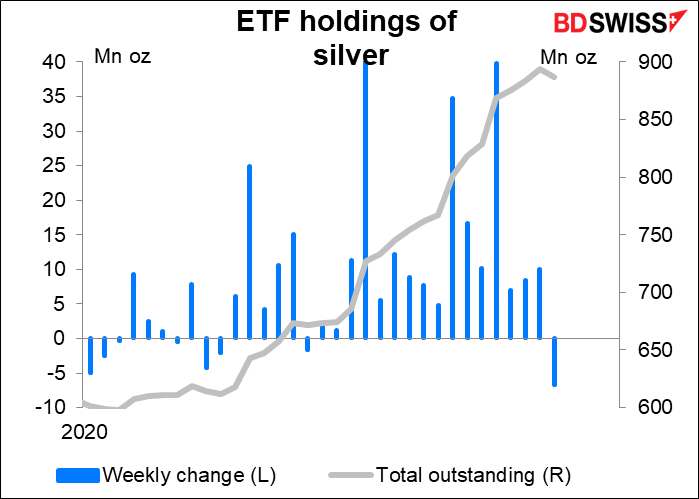
It looks like some people are getting nervous about silver, or at least the euphoria is starting to calm down.
It’s hard to find who’s behind the rally from the futures market. No one seemed to be pursuing either metal particularly aggressively last week. Perhaps all the action was in the physical market.
Exchange-traded funds (ETFs): ETFs were small buyers of gold and net sellers of silver in the past week. This was the first week they were net sellers of silver since 24 April.

Commitments of Traders (CoT) report
As we saw in the table above, speculators in the futures market reduced their net longs in both gold and silver during the week (i.e., sold). (Same with copper, so it wasn’t just the precious metals). Positioning isn’t extreme either way, which is surprising given the speed and degree of the rally and the recent volatility.

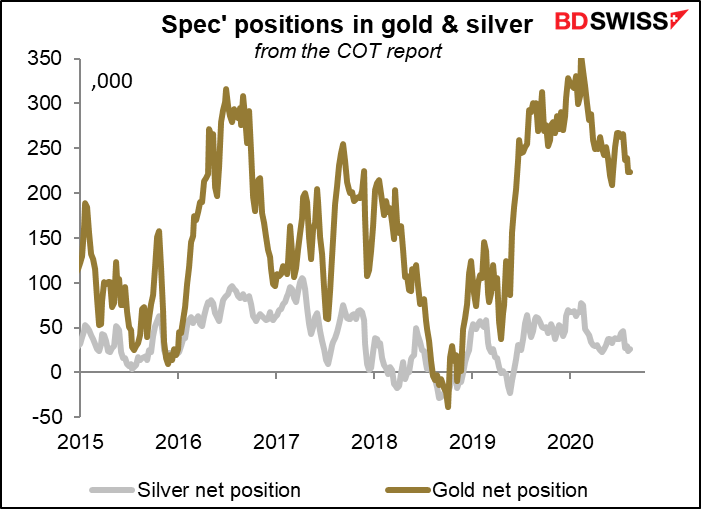
Professional positioning
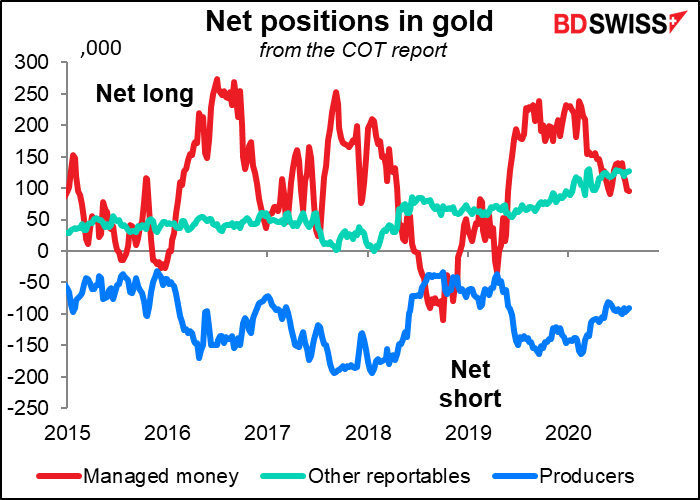
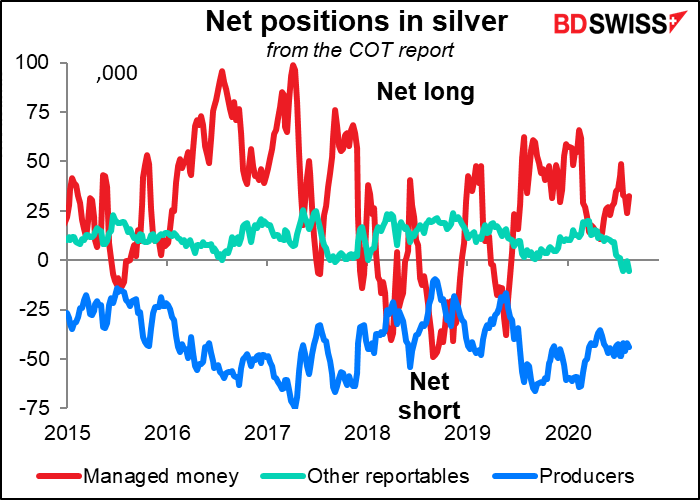
No major changes in gold positioning. “Other reportables,” which went short silver the week of 21 July, increased their short positions. (See “explanations and definitions” for explanations and definitions.)
Retail positions
Retail cut their positions in both metals last week, by a small (-0.1%) in gold but a significant (-20.5%) amount in silver.

Risk reversals
The RRs also suggest people are getting less euphoric about silver. While the gold RR was down only slightly over the week (from 2.67 to 2.60), the silver RR fell sharply to 5.52 from 8.04.

Equity positioning
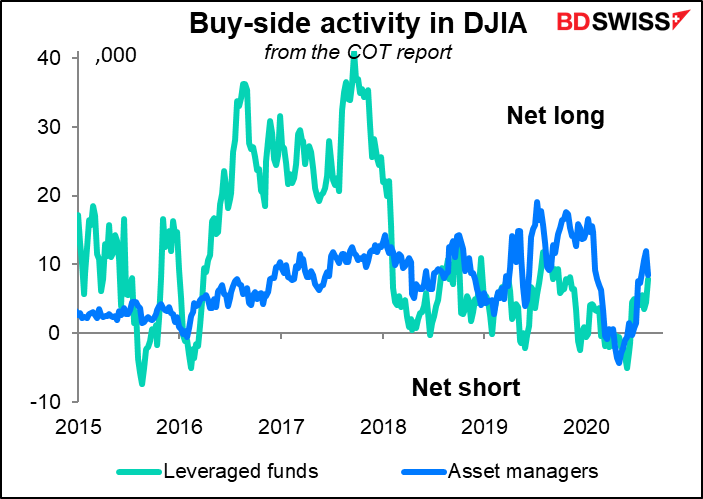
Speculators remained tiny shorts in the DJIA and increased their small longs in the NASDAQ 100.
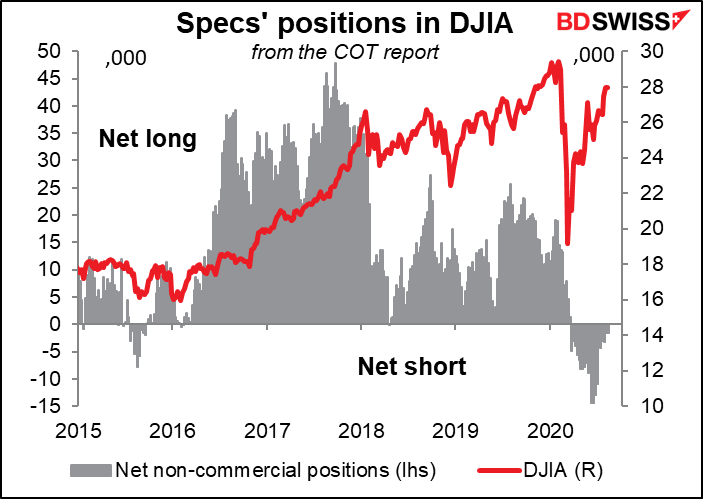
Money managers reduced their DJIA longs by 30% but hedge funds increased theirs by 70%. Which is the “smart money”?
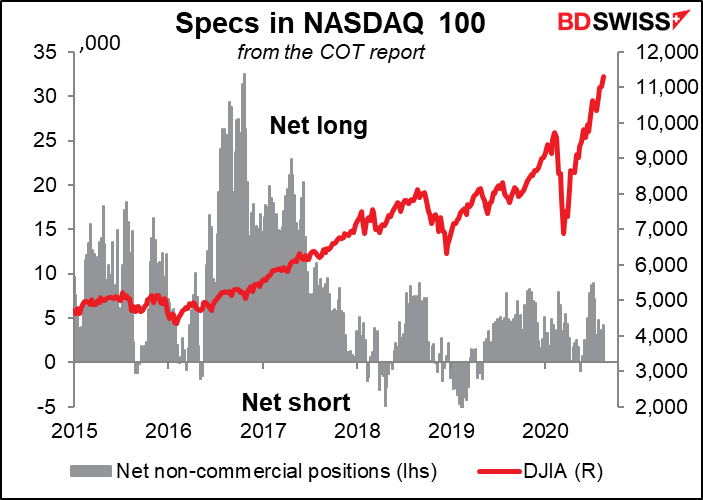
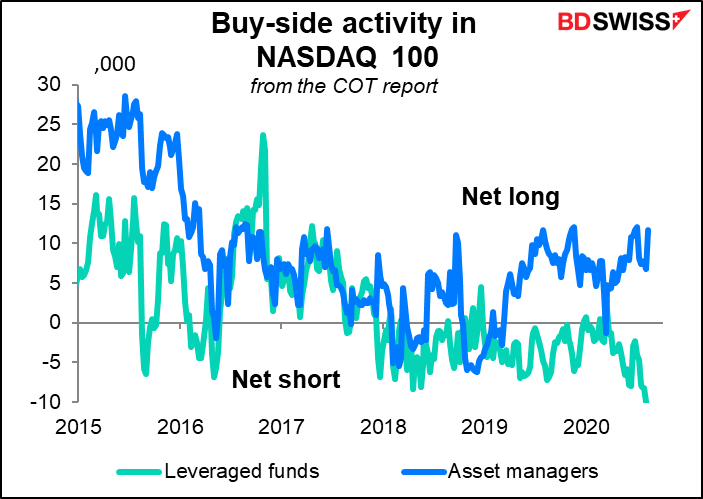
Here too, asset managers are short the NASDAQ 100 and got even shorter, while hedge funds are long and increased their longs last week.
Put/call ratios
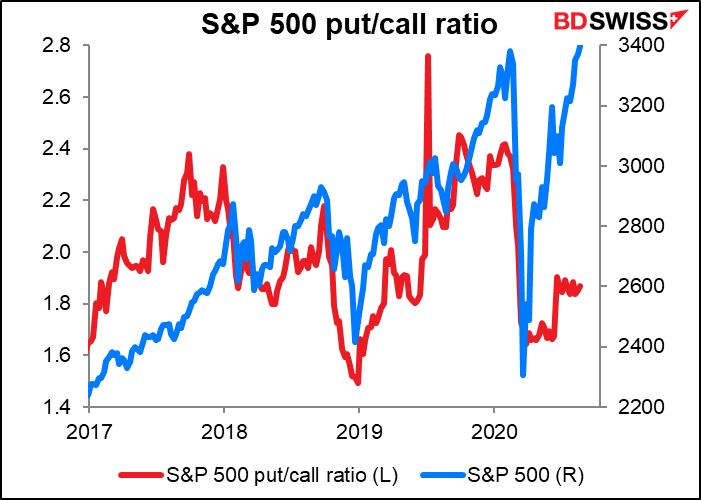
The put/call ratio for the S&P 500 edged up over the last week while it edged down for the NASDAQ 100, even as both indices rose. Perhaps investors have more faith in the NASDAQ rally than in the broader stock market.

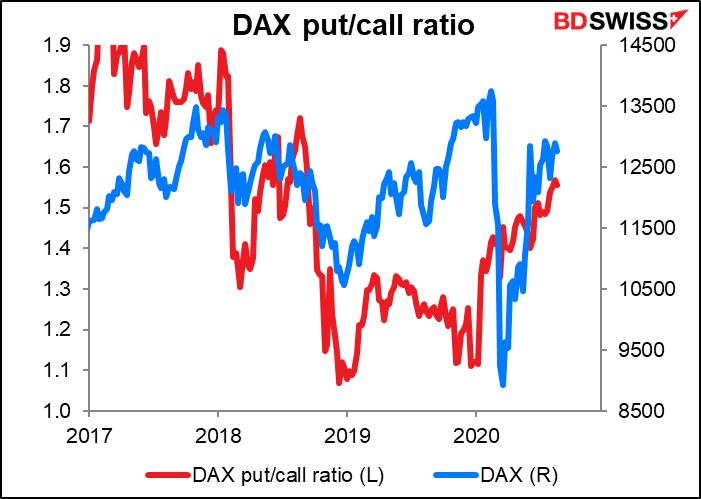
The DAX put/call ratio last week hit the highest it’s been since the week of 14 Sept 2018 but edged down a tiny bit (to 1.56 from 1.57).
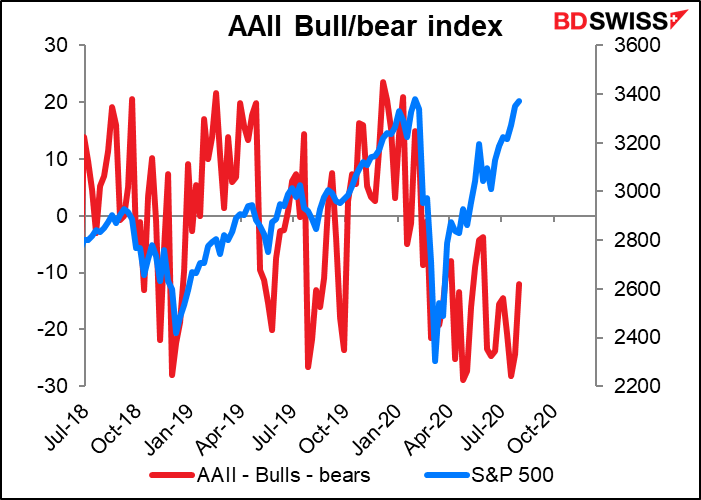
AAII “Bull/Bear” Index (see “Explanations and definitions” below)
The AAII bull/bear index has been bearish ever since the pandemic hit, which confirms the old saying that “stocks climb a wall of worry.” The net bearishness decreased notably over the last week, but it’s been oscillating for the last few months so I hesitate to call it a trend. We may see some change this week after the Republican convention. The poll is released on Wednesday so it will capture a day or two of the convention.
According to the AAII, pessimism is unusually high (more than one standard deviation above average), while optimism and neutral sentiment are within their typical historical ranges
The AAII said, “The ongoing high level of pessimism reflects concerns about the coronavirus pandemic and the economy. However, some AAII members have been encouraged by the rebound in the stock market from its March lows. Other factors influencing AAII members’ sentiment include the economy, corporate earnings, valuations, the November elections, and interest rates.” Unfortunately while they say that the election is a concern for the market, they don’t say which way: are people concerned that Trump might lose or might win?
Explanations and definitions:
The Commitments of Traders (CoT) report, from the US Commodity Futures Trading Commission, presents data on all the futures markets in the US. The data is taken on Tuesday and is released on Friday evening in the US.
For the financial futures, such as currencies, there are three broad classifications of traders. Professional traders are separated between “commercial” and “non-commercial” participants “Commercial” accounts are those that largely using futures to hedge their positions. “Non-commercial” accounts are largely those that are using the futures to speculate in the markets, such as hedge funds, asset managers, and individual traders. We refer to them here as “speculators.” There is another category, “non-reportable,” that consists of small investors whose transactions are individually too small to report on. We present them here as “retail.”
For the financial futures, the data on professional traders are further broken down into “asset manager/institutional,” which includes pension funds and insurance companies – so-called “real money” investors – and “leveraged funds,” which are typically hedge funds and other types of speculators. (There are other categories as well, but we don’t cover them here.) These categories do not necessarily add up to the “non-commercial” figure because of overlap.
For the physical commodities, such as gold, the “commercial” category, which we don’t worry about, is broken down between “producers/users” and “swap dealers.” “Producers/users” are those that mostly produce, package, or handle a commodity. “Swap dealers “are entities that trade with other firms and use the futures market to hedge, such as investment banks. We ignore the swap dealers, as their activity mostly reflects what they are doing in response to other business, but include “producers” in our gold & silver charts.
The “non-commercial” category, which we refer to as “speculators,” is broken down into “managed money” and “other reportables.” “Managed money” consists of registered commodity trading advisors (CTAs), registered commodity pool operators (CPOs), or other funds that trade commodities on behalf of clients. “Other reportables” are all the other professional investors that are not in the other three categories.
“Open interest” is the number of both long and short contracts that have yet to be closed out. The “net position as a % of open interest” shows the net position as a percent of the total contracts still open. It’s important because it shows how tilted the activity is to either the long or short side.
You can think of the contracts as being like people in a boat. The “net position” tells you how how many people are on the left-hand or right-hand side of a boat, while the “% of open interest” tells you what percent that is of the total people in the boat. You can see that even if the net position is small, if the “% of open interest” is high, it’s more likely that the boat tips over.
The full CoT report includes data on both futures and options. We use only the data on futures.
The Risk Reversal (RR) is a gauge derived from the FX options market of whether the market thinks there’s a greater chance of a currency pair rising or falling. If the market thinks it’s more likely that the pair will rise, then the RR will be positive; if falling, then negative. The more positive (negative) it is, the greater the chance that the market places on the pair rising (falling). Formally speaking, the risk reversal is the implied volatility of the calls minus the implied volatility of the puts.
Z-score is a measure of how many standard deviations away from the average something is. It allows us to compare series with different volatilities.
Put/Call ratio: The put/call ratio is the same concept of the risk reversal, but uses trade volume instead of price. It shows the number of puts that have been bought on a market index (in this case) or a stock divided by the number of calls. Note: the direction of the signal that this gives is the opposite of the risk reversal. That is, when it’s positive, it means more puts are being bought than calls, which means there is more of a demand for downside protection than for upside.
AAII Bull/Bear ratio: the American Association of Independent Investors (AAII) every week polls their members and asks a simple question: what direction do you think the stock market will be in the next six months? The bull/bear index is a diffusion index of the percent of people who think it will be up minus the percent who think it will be down. For more information see the AAII’s website.


