

Rates as of 04:00 GMT
Market Recap
Yesterday morning I suggested that the end of Q1 and the portfolio rebalancing flows would give us a clearer view of what the underlying support for the markets was. We got a really clear answer: a Bronx cheer or a “raspberry,” as we say in America. Europe was down uniformly and US stocks down 4.4%, with every sector and industry group declining.
The mood seems to have improved a bit this morning however as Asian markets are mixed, and most of those that are down are only down less than 1% (the big exception being India, which continues to be one of the worst-performing markets in the world). S&P 500 futures are indicated up 1.3% at the time of writing.
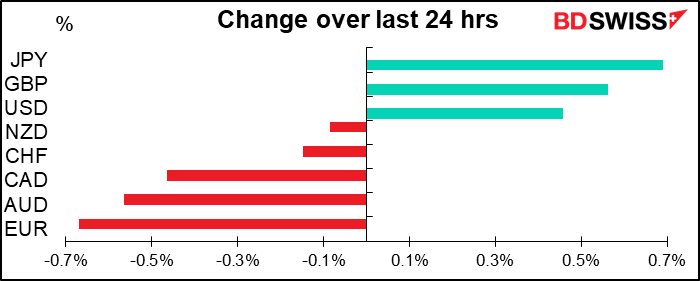
The “risk off” mood was reflected in the FX market as well, with JPY up and AUD & CAD down. CAD’s decline was notable in my book because it came even though oil showed remarkable resilience.
I was amazed to see oil rise even after the US Dept of Energy (DoE) announced an astonishing 13.8mn barrel rise in inventories, far above the 3.3mn estimate and even higher than the American Petroleum Institute’s (API) 10.5mn figure. (The DoE and the API have slightly different samples and different ways of estimating figures from producers who don’t report their output, which causes their figures to vary on a week-by-week basis, but over the longer term it all evens out and they’re almost exactly the same.) This was the second-biggest rise in inventories ever in data going back to August 1982 – the only bigger one was 14.4mn bbl in October 2016, when the US was swimming in oil. At the same time, gasoline demand hit a record low as Americans are staying home and not driving anywhere.

Oil’s rise may be due to hopes that Friday’s meeting between Trump and some oil executives could turn up some way of dealing with the problem. Trump was also optimistic on getting some agreement between the Saudis and Russians, saying “I think they’ll come up with something.” This is of course the guy who said the COVID-19 virus was “totally under control” and would soon disappear like a “miracle.” You can invest based on what he says if you want to. There were also some slightly hopeful comments from Russia, which said that it won’t boost crude production for now as it’s not profitable. But with many countries extending their lockdowns, which means no one driving, flying or even taking the train, the outlook for oil and therefore CAD still looks grim to me. Just thinking about my own plans, even if the lockdown ended tomorrow, I wouldn’t travel for pleasure for some time. I think many other people are likely to be cautious as well.
A word about seasonal oil demand: there’s usually a build-up of oil inventories in the autumn as companies prepare for the winter heating season, and then another build-up during the spring as companies prepare for the summer driving season. The other main energy demand in the summer is air conditioning, but that’s electric, and electricity in the US is mostly generated through natural gas, coal, nuclear and renewables. Only 1% of US electricity is generated with petroleum. That’s why if people aren’t moving during the summer, they don’t use much oil.
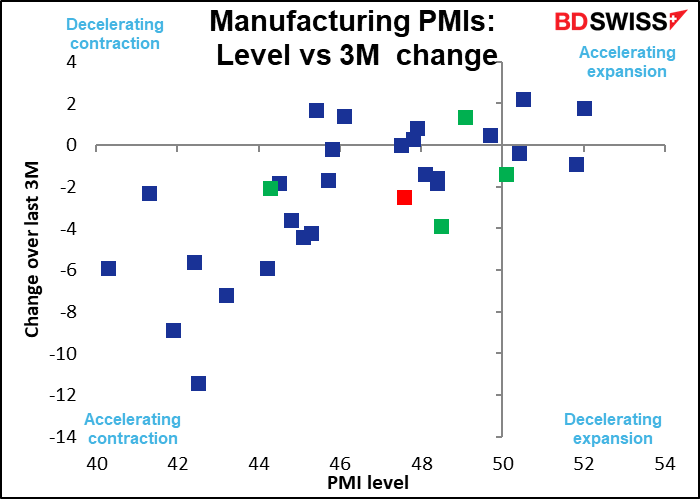
The manufacturing purchasing managers’ indices (PMIs) from around the world were almost uniformly negative. Manufacturing in most countries is not contracting, but contracting at an accelerating pace. This is likely to continue for some time, in my view.
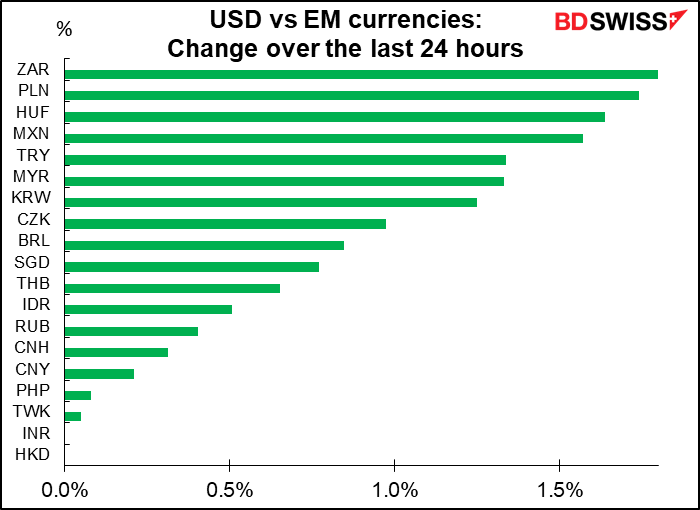
Emerging market (EM) currencies had a bad day in general, thanks to the risk-off mood. ZAR is vying with BRL as the worst-performing major currency so far this year (ZAR down 20.56% vs USD, compared with -20.98% for BRL).
Today’s market
Jobs are again the main theme in the market, as they may well be in your personal life too.
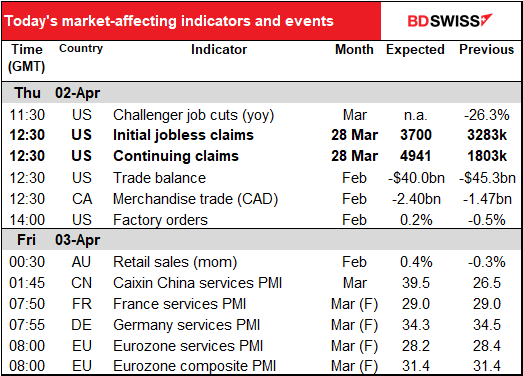
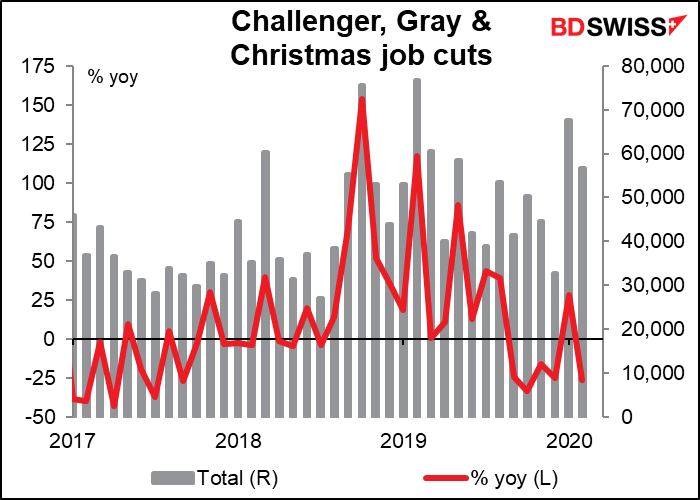
I don’t usually cover the job cut announcements data from the outplacement firm Challenger, Gray and Christmas as it’s not market-affecting. But nowadays anything having to do with the job market is worth looking at. This report is valuable to see not only the overall level of job cuts but also what industry they’re in.
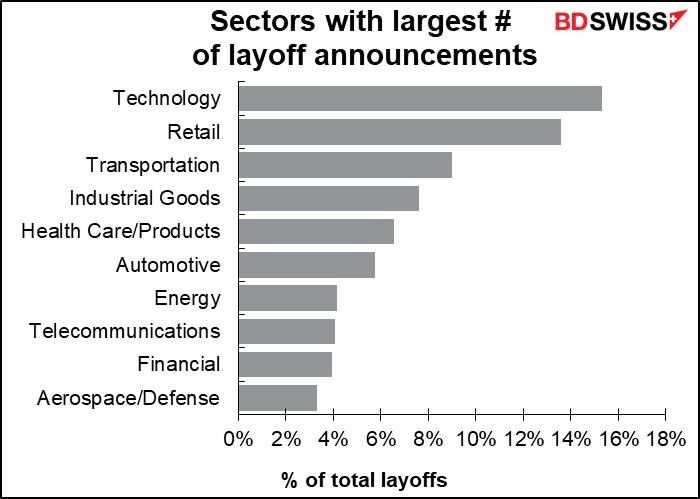
Over the last three months, most of the job losses have been in technology, retail, transportation and industrial goods. We’ll see how food (3.2% of job losses) and entertainment/leisure (2.7%) fare from here – I’d expect to see them rise up the ranks. On the other hand, I’d expect health care to be absent from the list for a long, long time. Telecommunications is also likely to be one of the few bright spots – we saw from Japan’s tankan how people working from home and people home watching Netflix (some at the same time, no doubt) has boosted demand in that sector.
A few words of caution about this series. First, it only measures layoff announcements. Many places, especially small employers, may not announce their layoffs, and even if they do, the layoffs may take place over time. Secondly, the figures are not seasonally adjusted. Finally, the announcements cover foreign as well as domestic workers. Accordingly, the series is only indicative, which is why I never covered it before.
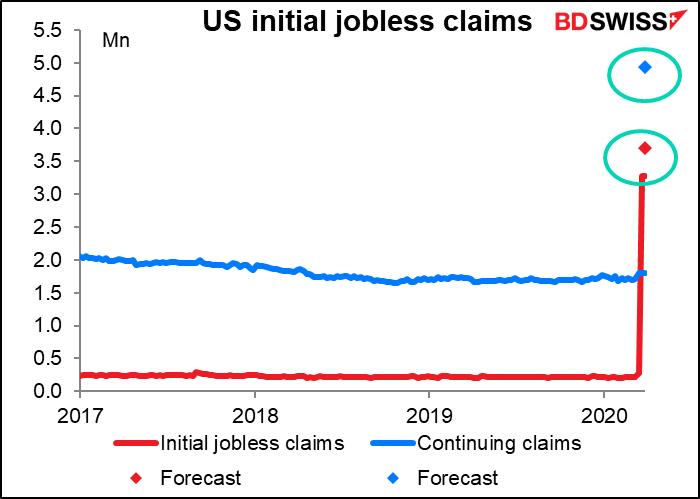
An hour later, we get the new shining star of the indicator firmament, the weekly data on filings for unemployment data, or US initial jobless claims as it’s commonly known. It’s kind of pointless to make a graph of the data when last week’s number and this week’s forecast are some 14x bigger than those preceding them. This week’s “forecast,” like last week’s, is more of a guess than a forecast.
The initial jobless claims is for now a much better gauge of the state of the US labor market than the monthly nonfarm payroll figures. That’s because of the way the payroll data is collected. Anyone who is on a payroll during the period that includes the 12th of the month is considered employed. So for example if you’re paid monthly and you get laid off on the 2nd of the month, you will still have worked one day during your payroll period that includes the 12th of the month (since your payroll period is the entire month) and hence you won’t be counted as unemployed. Even weekly employees laid off on the 16th will still be counted as on the payrolls. They will also be counted as employed for purposes of the unemployment rate, as that is derived from a different survey that’s taken on the week containing the 12th.
As a result, the weekly jobless claims represent the most up-to-the-minute view of the catastrophic US labor market. While last week was a record high, most analysts think this week is likely to be even higher. Not only did more people lose their jobs as the month went on, but also the state unemployment filing systems have been overwhelmed by the deluge of applicants and were unable to keep up. It’s likely then that there are still a lot more applicants to be processed, not to mention people who’ve yet to file for benefits.
After the layoffs stop, the figure to watch will be the continuing claims. That’s the number of people who are receiving benefits – in other words, those who haven’t managed to find a job yet.
If you’re interested in getting the news straight from the source, you can find the data at the website of the US Department of Labor. Click on “Weekly Claims Report” to get the full details.
For this week, the median estimate compiled by Bloomberg is 3500k and the average is 3670k. The range of the 49 estimates is between 800k and 6500k (although most are between 2500k and 4500k). But really, who knows? The wide range of estimates shows just how little we really know about what’s going on around us these days.
FYI yesterday’s ADP report was better than expected, showing only a 27k decline in jobs vs -150k expected. However the report only uses data through 12 March and therefore doesn’t cover the full impact of the coronavirus.
The US balance of trade in goods and services is expected to narrow further. Ordinarily that might be good news for the US. Now? Is anyone watching? Longer term though it would tend to be a dollar-positive trend if it comes about thanks to, say, lower imports of oil.

Canada’s trade deficit on the other hand is expected to widen noticeably as lower oil prices and disruptions to rail service reduce exports.

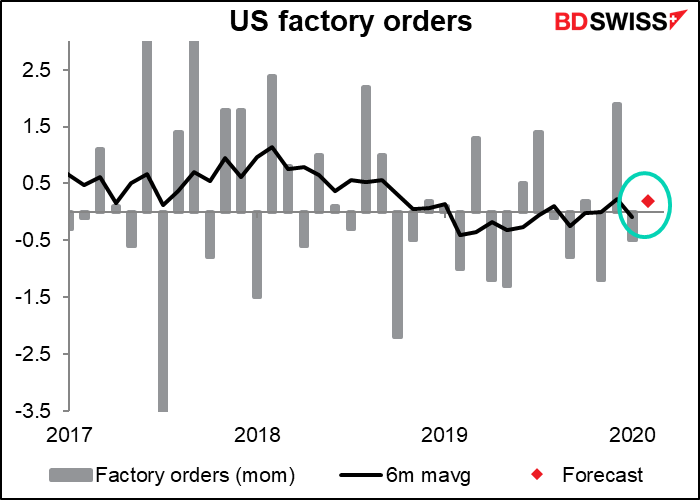
US factory orders are expected to be up a bit. That’s for February. Let’s see how they are in March.
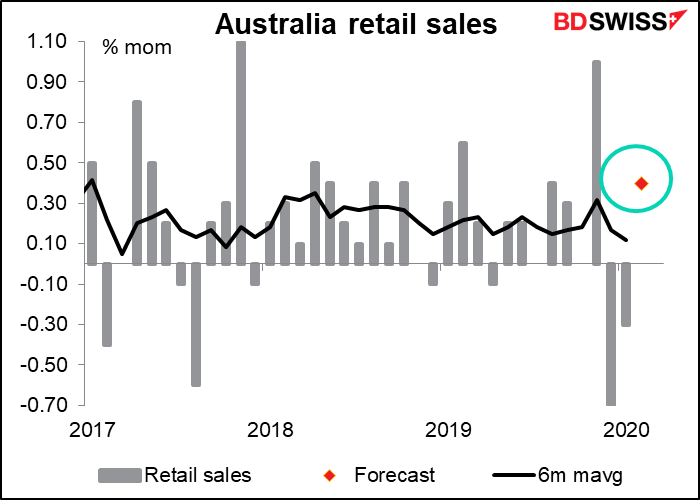
Australian retail sales are expected to have risen well above trend in February. That’s nice. We could even see a rise in March, as lockdown measures didn’t go into place nationwide until 23 March (although some places instituted them earlier). Come April though I expect we’ll see a different story, at least temporarily.
The Caixin/Markit China service-sector PMI is expected to bounce back somewhat, but still be a pretty miserable 39.0. That’s only good relative to the previous month’s record low 26.5. The official service-sector PMI by the way bounced back all the way to 52.3, however its data sample includes more state-owned enterprises and companies throughout the country, whereas Caixin/Markit concentrate their sampling on firms near the coast, where the economy may be more influenced by export conditions.

Then at the opening of the European day we get the revised service-sector PMIs for the major industrial countries, plus the readings for everyplace else. Yesterday’s manufacturing PMIs were mixed; France was revised up slightly and the US somewhat more, while Germany and the Eurozone as a whole were revised down one tic.


