Rates as of 04:00 GMT
Market Recap
No need for an April Fool’s joke this year – it feels like my whole life is an April Fools’ joke, and later today people are going to jump out of my closet and shout “Surprise! You don’t have to stay locked in here 24/7! Your retirement savings haven’t gone up in a puff of smoke!” and we’ll all go out for a beer and shake hands and hug and kiss three times on the cheek Swiss style and everyone will be happy.
Not this year, unfortunately.
The markets are so-so. We had a good day in Europe yesterday, but Wall Street closed slightly lower (-1.6%) and is indicated -1.6% at the time of writing. Asian stocks are mixed this morning.
There’s a big debate about what yesterday’s close means. Yesterday was the end of the month and the end of the quarter. There have been a lot of mutual funds rebalancing their books. That is, if you’re running a fund that’s supposed to have the traditional asset allocation of 60% in stocks and 40% in bonds, the value of your stocks has gone down over the last quarter and the value of your bonds has gone up. So to rebalance you should buy stocks and sell bonds. That kind of flow should’ve been supporting the stock market over the last several days. Now with it ended, we’ll see how much “natural” support there is for equities.
The concern is that the index is 18% off the bottom, almost the 20% that often signals the end of a retracement. Furthermore, it’s reached almost exactly the 38.2% Fibonacci retracement level from the lows. This is a typical point at which technically minded people with a bearish bent would come in and sell.
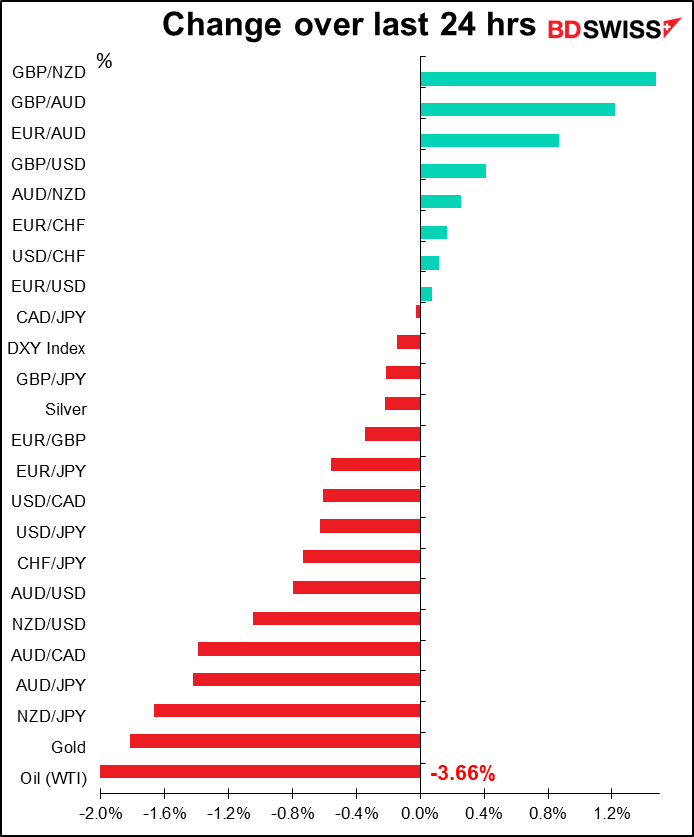
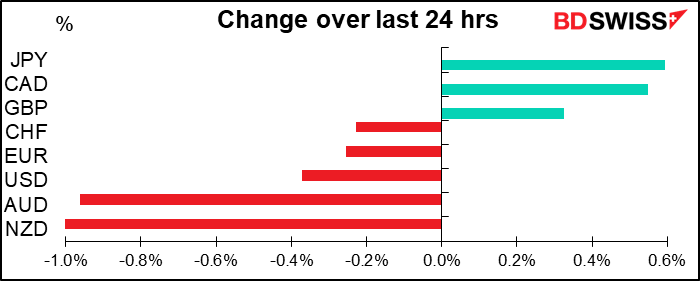
In the FX market, JPY and CAD were the biggest gainers. End-month flows probably explain why these two were up. CAD was also probably reacting to the previous day’s gain in oil prices, although oil came off during the US session as the American Petroleum Institute (API) reported a much larger-than-expected build in inventories in the latest week (see below).
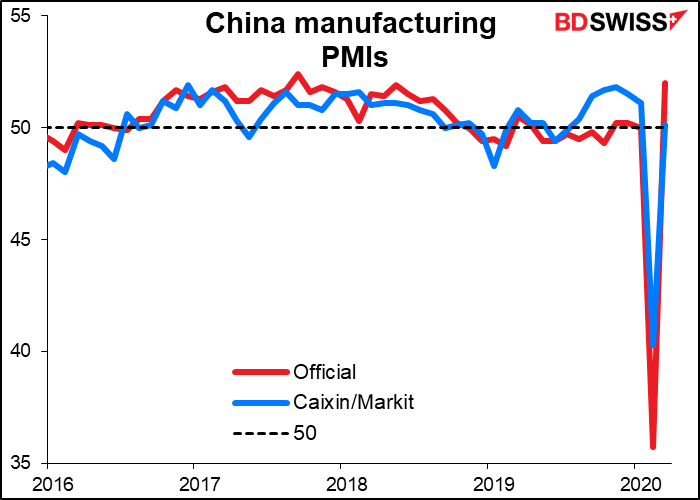
On the other hand, AUD and NZD failed to gain any benefit from the rebound in the Caixin/Markit China manufacturing purchasing managers’ index (PMI). It rebounded back above the “boom or bust” line of 50 as both output and new orders were up. This echoes the good performance of the official manufacturing PMI, released on Tuesday morning. Taiwan also rebounded above 50, although it had a very small dip to begin with (50.4, up from 49.9) and part of the rebound was from longer supplier delivery times, which is usually a good thing (but not necessarily so nowadays).
However, China was alone in Asia in showing such a sizeable rebound: Japan was at 44.8 and South Korea at 44.2, both the worst readings since the Global Financial Crisis. Philippines (39.7), Indonesia (45.3) and Vietnam (41.9) were dreadful still. And with the US consuming less now, new orders – one of the components of the overall index – are likely to plunge.
Yesterday the Fed announced that it would establish a temporary repurchase agreement facility for foreign and international monetary authorities (FIMA Repo Facility). Central banks and other international monetary authorities use these accounts at NY Fed to hold their Treasury bonds. The facility will allow them to use these bonds to get dollars through repurchase agreements with the Fed. The Fed statement said, “This facility should help support the smooth functioning of the US Treasury market by providing an alternative temporary source of US dollars other than sales of securities in the open market. It should also serve, along with the US dollar liquidity swap lines the Federal Reserve has established with other central banks, to help ease strains in global U.S. dollar funding markets.” In other words, this is to some degree a dollar-negative development.
Today’s market
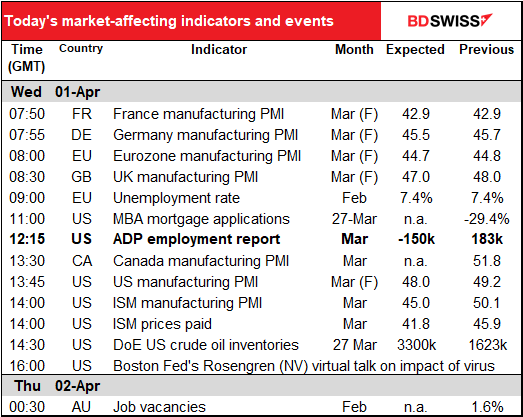
The day starts with the final version of the March manufacturing purchasing managers’ indices (PMIs). They’re expected to be revised down. Given how the lockdowns progressed as the month went on, this wouldn’t surprise me at all.
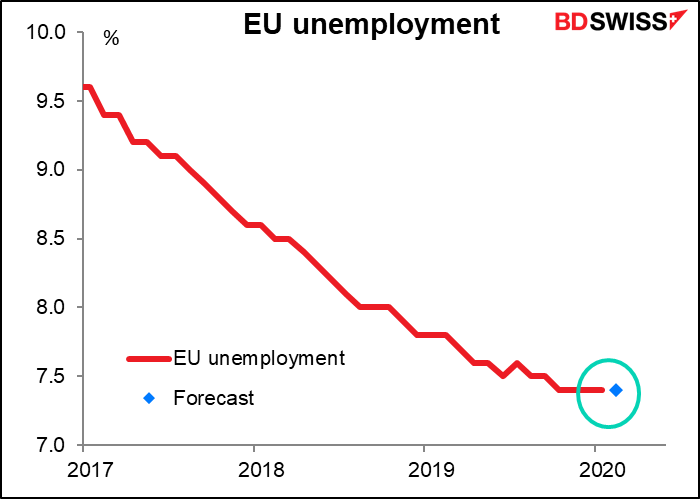
Next comes EU unemployment. This usually isn’t a market-moving indicator, and I’m not sure it’s going to be now, either. I just think it’s worth tracking for one’s own view of what’s happening in the EU. The figure is not particularly volatile – it’s been 7.4% for four consecutive months and it’s expected to be 7.4% again in February. We’ll see about March.
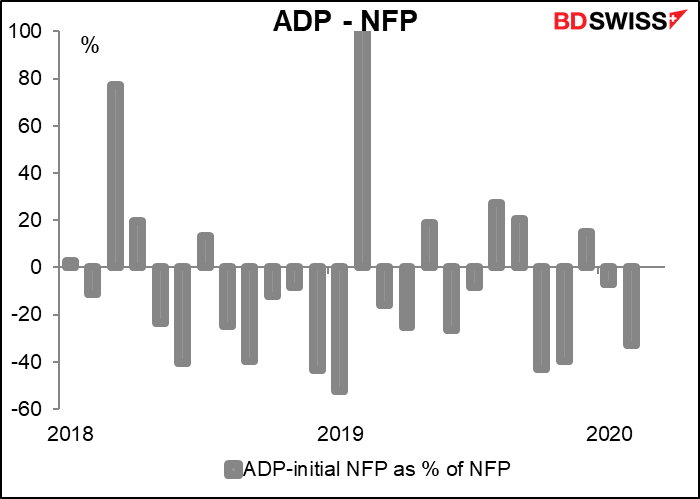
Next up is the ADP employment report. Automated Data Processing Inc. (ADP) is an outsourcing company that handles about one-fifth of the private payrolls in the US, so its client base is a pretty sizeable sample of the US labor market as a whole. It’s therefore watched closely to get an idea of what Friday’s US nonfarm payrolls (NFP) figure might be. One point to note: the ADP adjusts its figures to match the final estimate of NFP, not the initial estimate that we get this Friday. So while it’s one of the best guides to the NFP that we have, it’s not perfect by any means – in fact, neither is the NFP figure itself, since it’s always revised. Over the last two years, the ADP report has ranged from 77% higher than the NFP number to 52% lower (excluding February 2019, when the NFP was up only 1k). On average it’s around ±56k wrong, which is 29% of the average NFP number.
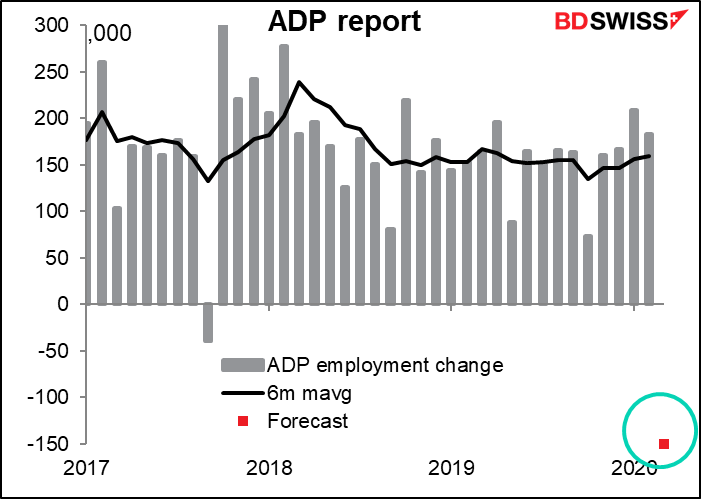
This month, the figure is forecast to be -100k, the lowest since -123k in November 2009. Given what we saw in last week’s jobless claims (-3.3mn), this would be quite a modest number. Since we don’t really have a good idea what the nonfarm payrolls will be – timing is more important than usual this month, as things got progressively worse and worse during the month – this number is likely to be watched even more closely than usual, even though it has virtually no predictive value for the NFP figure.
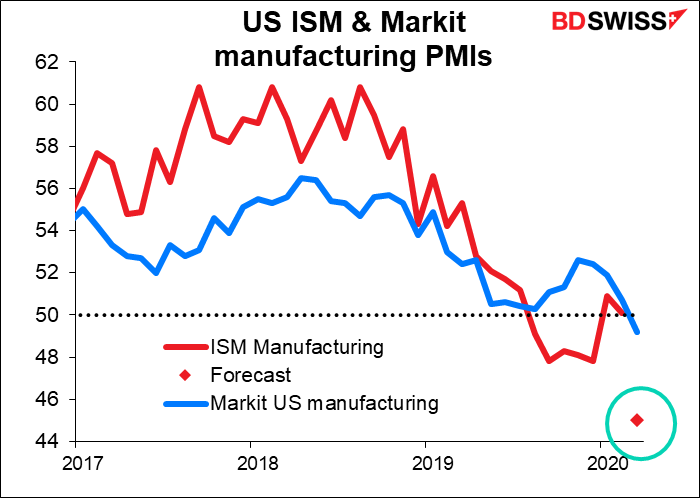
The Institute of Supply Management (ISM) manufacturing PMI is expected to plunge. The Markit version of this indicator didn’t. One of the differences between the two indicators is that Markit asks exclusively about the companies’ domestic US operations, while the ISM asks about the company-wide operations, and since most of the contributors are big companies that either have operations abroad or have part of their supply chain abroad, the ISM index is likely to reflect international conditions more than the Markit version does.
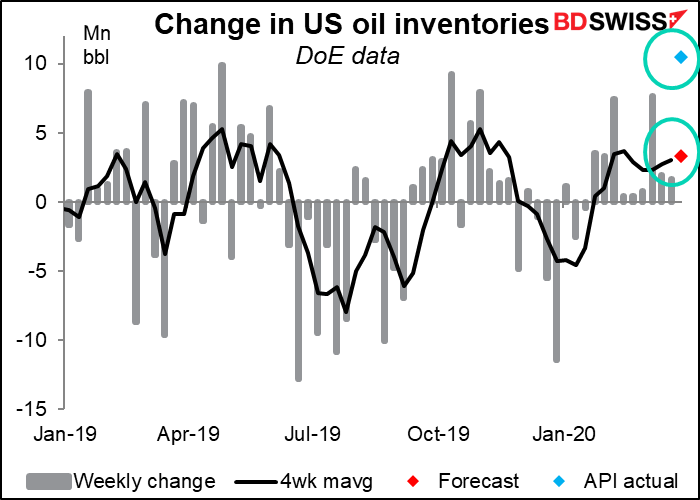
Crude oil inventories are forecast to be up 3.3mn barrels over the latest week. However, the American Petroleum Institute (API) reported an enormous 10.5mn barrel increase, the highest since February 2017, so the market consensus forecast may underestimate the actual figure.
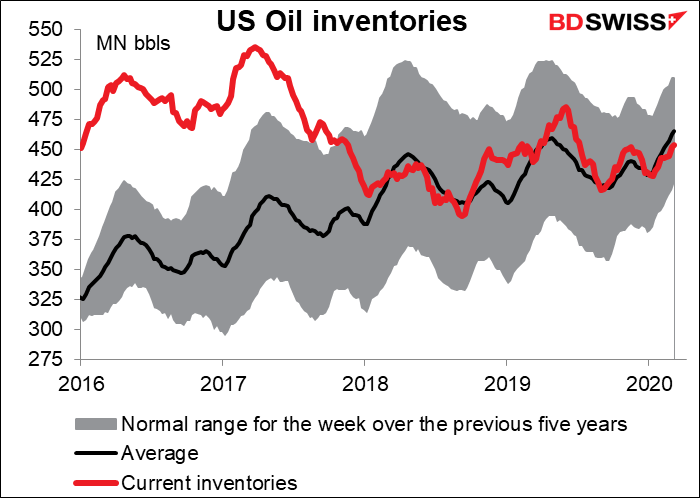
There’s a lot of concern in the oil market nowadays about inventories. The concern is early, but not premature.
At the moment, US oil inventories are right on average for this time of year. In particular, inventories at Cushing, Oklahoma, the crucial delivery spot in the US, are less than half (46%) of capacity. It looks like it should be no problem.
However, Fatih Birol, the head of the International Energy Agency (IEA), recently said that global demand for oil was in “freefall” and could drop by as much as 20mn barrels a day (b/d) out of total production of around 100mn b/d, or about 20%. The US consumes about 20mn b/d, so if its demand fell by 20% as well, that would be 4mn b/d.
US oil storage is about half full and so has room for an estimated 135mn barrels more. If US supply stays the same but demand falls by 4mn b/d, then in 34 days or so, the tanks will be full. Even assuming that US demand doesn’t fall by that much, we’re still talking around two or three months before there’s nowhere left to put the oil coming out of the ground. (The US might least out space in the Strategic Petroleum Reserve, after plans to buy more oil fell through due to lack of funding. That would add some 77mn barrels of capacity.)
Just to put that 20mn b/d supply glut in perspective: Saudi Arabia and Russia together pump about 21mn b/d. So the two countries would have to shut down production entirely in order to balance the market. Ain’t gonna happen. What could happen though is that a lot of the US shale oil producers may go out of business, which may well be one of the aims of the Saudis and Russians. Watch the Baker Hughes oil rig data every Friday evening for news about that.
The health of the US shale producers is important for the FX market for two reasons. One, the US has become independent in oil thanks to their production. If they shut down and the US goes back to being a net importer of oil, the trade deficit will widen.
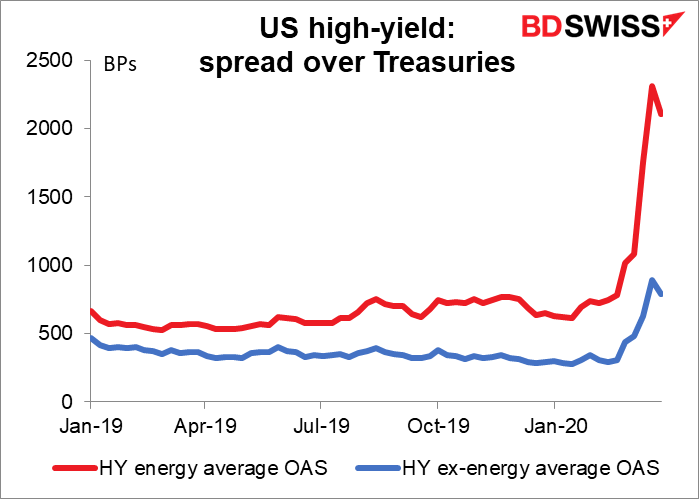
Secondly, and perhaps more importantly, these companies owe over $1tn to banks and bondholders. US oil and gas companies have an estimated $936bn in bonds outstanding, not to mention their borrowings from banks. Spreads of energy-related companies have blown out tremendously over the last few weeks, more than those of other kinds of businesses (3x the Q4 average, vs 2.4x for the ex-energy index). Usually, 1,000 basis points above Treasuries is considered “distressed;” currently, the average for energy companies is around 2,100 bps above Treasuries. These companies’ financial health has repercussions for the entire US financial system.
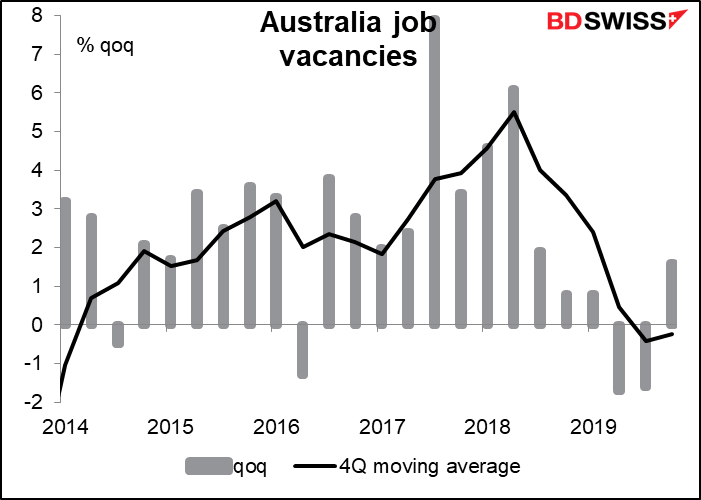
There’s no forecast for Australia job vacancies. It’s probably not market-moving, but since the Reserve Bank of Australia is watching the labor market closely, we should too.