Rates as of 05:00 GMT
Market Recap
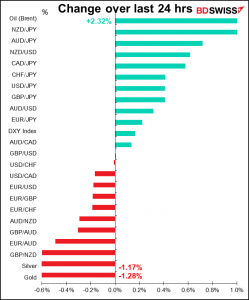
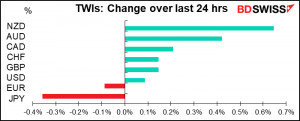
JPY weakness continued to be a focus of the market as USD/JPY hit the highest it’s been since March 25th last year – almost exactly a year ago. This is despite better-than-expected data out of Japan: the February unemployment rate stayed at 2.9% (vs. 3.0% expected) and retail sales rose +3.1% mom (vs +0.8% expected). This confirms the uselessness of Japanese economic indicators as a way of predicting where USD/JPY will head, or maybe just confirms their function as a “reverse indicator.” But in this case even that didn’t work – the TOPIX was down 0.83%, so the better-than-expected data failed to trigger a “risk-on” sentiment in the stock market (perhaps because of the problems of Nomura? See below).
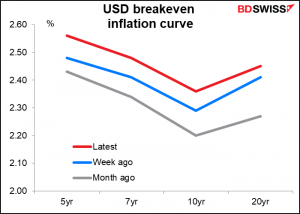
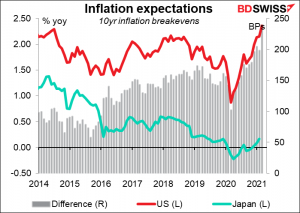
One culprit for the recent rise in USD/JPY seems to be higher inflation expectations in the US. Ten-year inflation expectations have reached their highest level since March 2013.
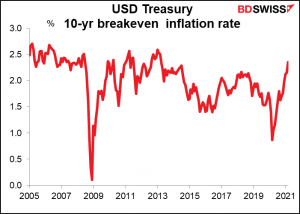
Inflation expectations are up substantially even from a week ago. Perhaps the market is already discounting the economic impact of the Biden Administration’s planned $3tn infrastructure spending plan, to be announced tomorrow. The Washington Post reported that it would focus on repairing physical infrastructure, reviving domestic manufacturing, investing in R&D, and supporting clean energy. Other measures, such as childcare and healthcare, will be unveiled next month. The Post said that the plan could have “as much as $4 trillion in new spending and more than $3 trillion in tax increases” on companies and wealthy Americans.
While the details aren’t even out yet, Standard & Poor’s predicted that the plan would create 2.3mn jobs by 2024, inject $5.7tn into the economy (10 times what was lost during the recession), and raise per-capita income by $2,400
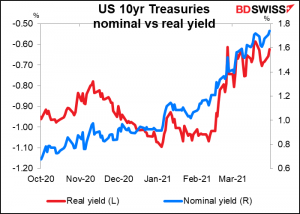
The point is that investors expect US bond yields to at least keep pace with inflation expectations. In fact, they are rising by more than inflation expectations, resulting in a rise in real yields.
By contrast, inflation expectations have risen only a tiny bit in Japan, nothing near as much as in the US. And with 10-year Japanese government bond yields restrained by the Bank of Japan’s Yield Curve Control program, even if inflation were to move up, it would only mean lower real yields in Japan, making Japanese bonds even less attractive and foreign bonds more attractive.
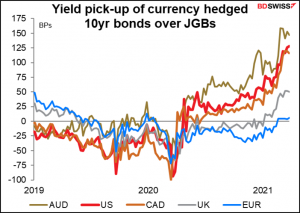
Just to repeat the graph I showed yesterday about the yield pick-up available to Japanese investors in foreign markets.
The counterpart of the weaker yen seems to be a stronger NZD and AUD as investors discount stronger global growth. There are significant international spillovers from faster domestic US growth, particularly if it’s fuelled by infrastructure investment, which requires all sorts of industrial materials. For example, the OECD estimated that President Biden’s first economic support package, the $1.9tn package, would boost global growth this year. “This will not only boost the US economy, but it will fuel global growth through increased demand in the US and from the US to the rest of the world,” OECD Chief Economist Laurence Boone said at a presentation in Paris in early March. One can expect the same or more for this larger package.
In case you’re interested, this is what the OECD said about the global impact of the Biden Administration’s first package. Note that this second package is expected to be much bigger and probably more resource-intensive, hence have a bigger impact on the commodity countries.
Illustrative simulations on the NiGEM macroeconomic model suggest that the proposed measures could raise US output by around 3-4 per cent on average in the first full year of the package (from 2021Q2 to 2022Q1), broadly equivalent to the spare capacity currently estimated to exist in the US economy. This helps to stimulate demand in other economies, with output rising by between ½-1 percentage point in Canada and Mexico, and between ¼-½ percentage point in the euro area and China. In the near-term, US employment is also boosted, rising by between 2¼-3 million at the end of 2021, but inflation also rises, by around ¾ percentage points per annum on average in the first two years of the shock. Strong US import growth widens the US current account deficit by around ¾ per cent of GDP on average in the first four quarters of the shock. (emphasis added)
While NZD and AUD were the best-performing currencies overnight, the OECD’s analysis of the previous package suggests that CAD is likely to be a major winner as well, thanks to the close trade ties with the US. Also note that oil prices rose yesterday, supporting CAD as well. OPEC meets on Thursday and is expected to hold output steady.
Elsewhere in the financial world, there was some trepidation yesterday as stock markets started up again following Friday’s forced liquidation by a hedge fund. But in the event the broader market wasn’t much affected. The S&P 500 closed down only 0.09% from Friday’s record close, which is hardly worth noting. A few companies at the center of the storm continued to suffer however, such as Nomura and Credit Suisse, which both warned that they face sizeable losses due to the selling. ViacomCBS and Discovery were also down further.
On the other hand, Boaty McBoatface, aka the Ever Given, was refloated! So that story ends relatively happily.
By the way, I looked yesterday for some stories in the press about the “Euro Summit” that took place on Friday. It didn’t seem to be widely covered (which is another way of saying I couldn’t find anything about it) but the EU did put up a Statement following the meeting. Among the conclusions was a “call for a stronger and more innovative digital finance sector and more efficient and resilient payment systems. In this context, exploratory work on the possible introduction of a digital euro should be taken forward…” So, the European Central Bank is encouraged to continue with its exploratory work, which it is pursuing anyway. We’ll have to wait for some conclusion from them then.
Today’s market
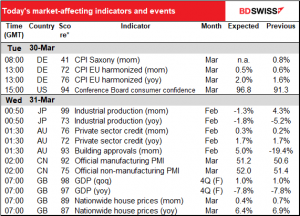
Note: The table above is updated before publication with the latest consensus forecasts. However, the text & charts are prepared ahead of time. Therefore, there can be discrepancies between the forecasts given in the table above and in the text & charts.
Another day with few pressure points during the European and US days.
Germany’s harmonized index of consumer prices (HICP) is expected to rise slightly, thanks to rising oil prices, reweighting of the index constituents, and changes to the country’s VAT in response to the pandemic. Although there are both upside and downside risks as the economies reopen, there does seem to be some upward pressure on goods prices nowadays (and there’s likely to be more if that ship remains stuck in the Suez Canal for much longer). Nonetheless with unemployment still high around the world, wage pressures are non-existent and so service-sector inflation is likely to remain low, offsetting higher goods prices.

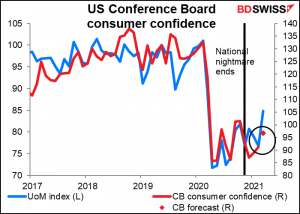
The Conference Board measure of consumer confidence is expected to rise, although not as much as Friday’s U of Michigan consumer sentiment index did. But maybe economists just haven’t had a chance to revise up their forecasts yet. With another “helicopter drop” of money coming soon and vaccinations far exceeding expectations, there are plenty of reasons for US consumers to be more optimistic. I can think of one big one, in fact. A huge reason. The best reason.
And once again that’s it for the European and US days.
The Asian day has some indicators worth watching though if you’re trading those currencies.
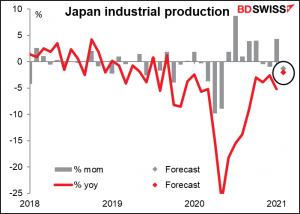
Japan’s industrial production is expected to be down on a mom basis, thanks to a fall in shipments destined for export and stoppages after the earthquake near Fukushima Prefecture during the month. Moreover, some decline was likely after the relatively strong 4.3% mom rise in January. As usual, attention will be focused more on companies’ production forecast for March and April than on the number for February, which is over.
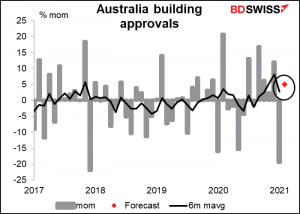
Australia building approvals are probably the most important indicator of the week for this country. Following the previous month’s sharp 19.4% mom decline, they’re expected to rebound around 5% as owner-occupiers take advantage of the Government’s extended HomeBuilder package.
China’s official purchasing managers’ indices (PMIs) are both expected to rise slightly but remain well below recent peaks. I would put this down to just random fluctuations. The rise could have a modest “risk-on” effect that would boost AUD but I’m not sure whether a change as small as that which is being forecast is significant enough to move the market.

Then for those who either get up early or get home late – I know which one I am these days! – we have a couple of UK indicators at the crack of dawn. Actually, not so much at the crack of dawn nowadays. According to Bloomberg, they’re still being issued at the same time as before on a GMT basis (0700 GMT), which is now 8 AM in London.
The third and final revision of 4Q GDP is not likely to set off any fireworks.
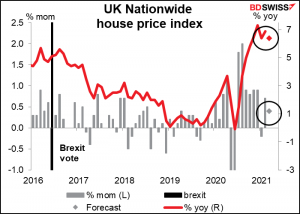
The UK house price index put out by the Nationwide Building Society is expected to show house prices still rising but less rapidly than the month before. Good, because prices hit a record high the month before. Remember yesterday’s mortgage approvals figure, which fell to 87.7k from a revised 97.4k. That’s still pretty high – in February 2020, before the pandemic hit, it was 73.4k. That shows that demand for houses is still strong as the stamp tax holiday has been extended and people are still moving out of the crowded city centers into more rural areas where they can enjoy viewing verdant vistas from their very own veranda.
