")
Rates as of 05:00 GMT
Market Recap
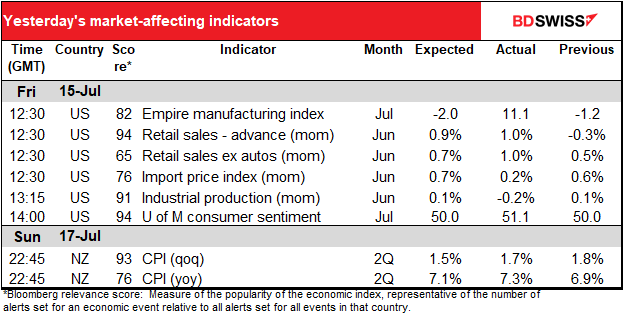
The US news on Friday was what’s called a “Goldilocks” scenario: not too hot, not too cold, but just right (if you know the story of Goldilocks and the three bears.) US retail sales came out above expectations (see table above) while the closely watched but virtually worthless U of Michigan consumer sentiment index bounced off its record low.
What was particularly important in the U of M survey was that the 5yr/5yr inflation expectations – inflation expectations for the five years beginning five years from now – fell to 2.8% from 3.1%. The minutes of the June meeting of the rate-setting Federal Open Market Committee (FOMC) showed that one reason the Committee decided to hike rates by 75 bps at that meeting instead of the widely anticipated 50 bps was the rise in this indicator from 3.0% to 3.3% — later (sometime after the meeting revised down to 3.1% but the damage was done. In any case it showed the weight that the members put on inflation expectations, which are now receding. The 1-year inflation expectations also fell modestly to 5.2% from 5.3%.
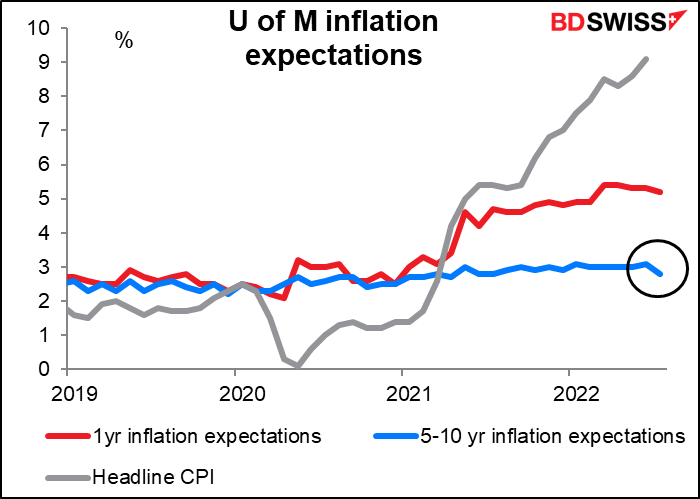
So the data showed resilient US consumption and falling inflation expectations – the best of both worlds. (Never mind that in real terms, i.e. after adjusting for inflation, US retail sales were down – that fact was dismissed.)
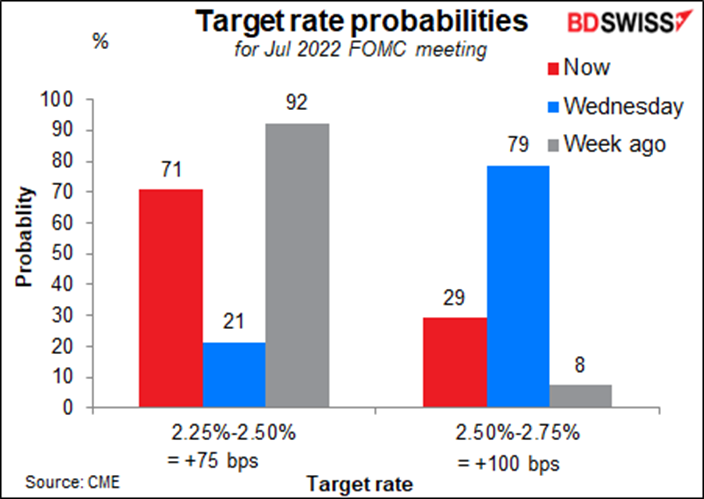
Moreover several Committee members pushed back on the idea of a 100 bps hike in July. EG Atlanta Fed President Bostic (non-voter) commented about the risks of “moving too dramatically” and observed that the 75 bps rate hike in June was very large relative to what the Fed has done in the past and stressed that Fed policy action should be “orderly.” This was a change in tone from what he said earlier n the week, which was that “everything is in play.” St. Louis Fed President Bullard (voter) followed a similar message as he noted the Fed has shifted policy “dramatically” in recent months. These were the last public Fed comments about policy as the Committee has now entered the blackout period ahead of the July FOMC meeting and members aren’t allowed to comment on policy.
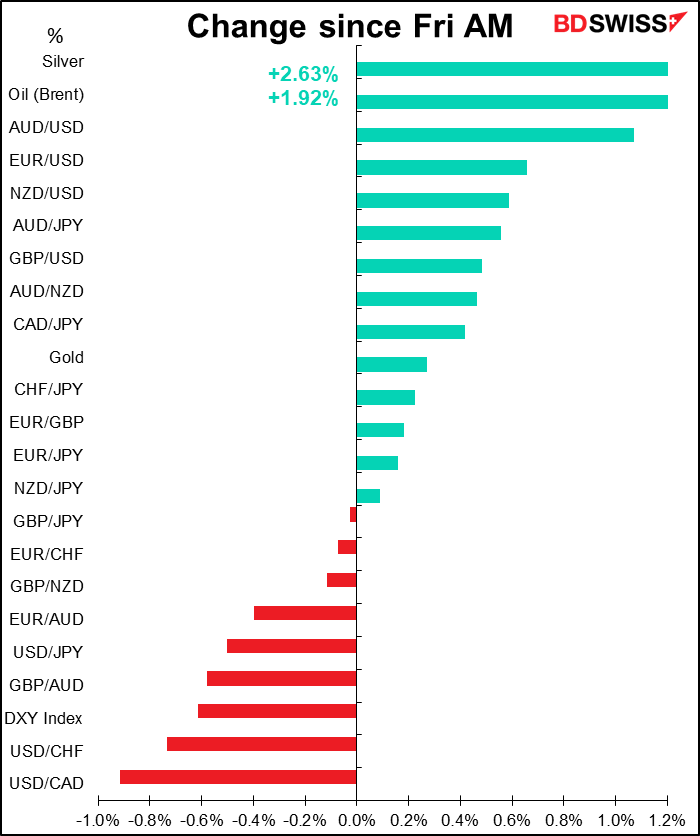
In response to the comments, the market repriced fed funds futures for July to favor a 75 bps hike, vs a 100 bps hike favored in the middle of last week. This is why the dollar has come off somewhat.
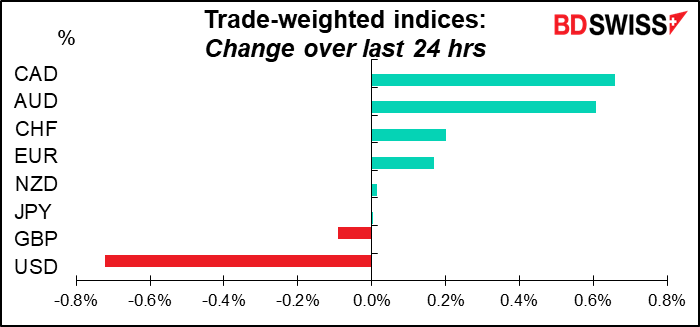
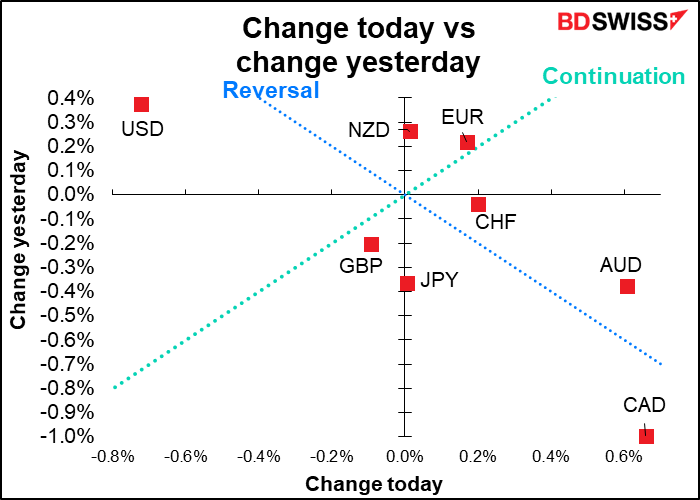
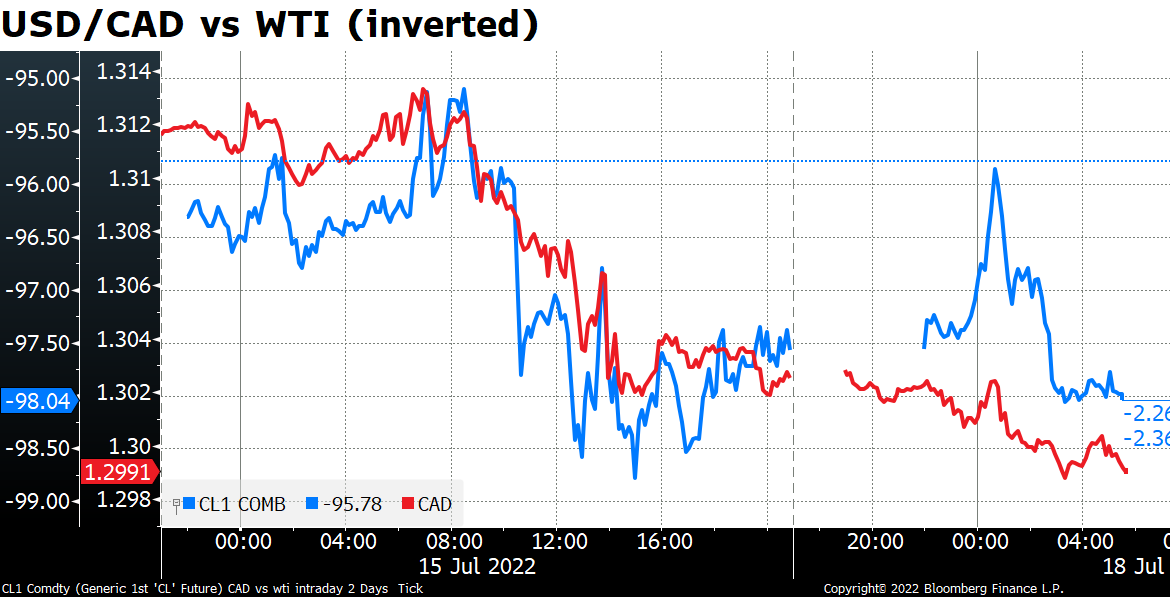
As for why CAD was the best-performing currency…here’s the usual graph.
So then why was oil higher? Two reasons: one, the idea that the Fed isn’t going to crush the economy (which also helped the S&P 500 to rally 1.9%) and secondly, US President Biden wrapped up his trip to the Middle East without a firm commitment from Saudi Arabia to increase production.
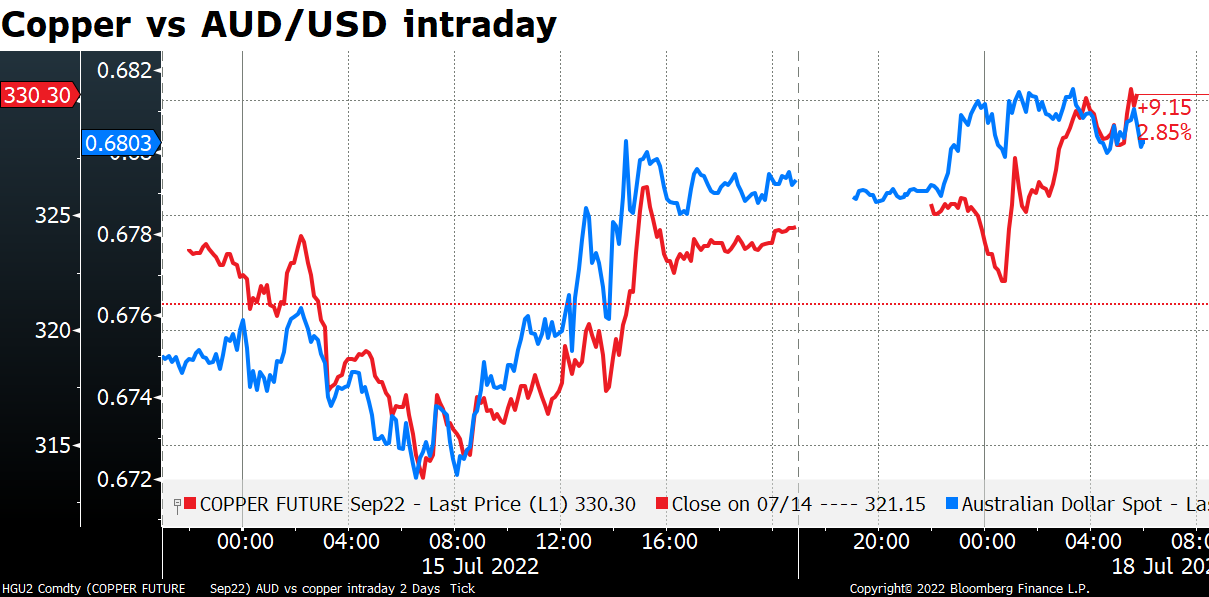
The US news also helped other commodities as well, such as copper, which has had a hard time recently. Copper futures have fallen34% over the last few months, from a high of $489.40 in March to $321.15 recently. Copper is one of the main proxies for global growth because it’s necessary for anything electric, such as the wiring in a new house or the heat exchangers in a new refrigerator.
The recovery in global growth sentiment expressed in the rise in copper prices boosted AUD.
As I mentioned in my Weekly Outlook, this coming week is usually the least volatile week of the year. Given all the volatility we’ve had recently, I suspect that this year will be different.
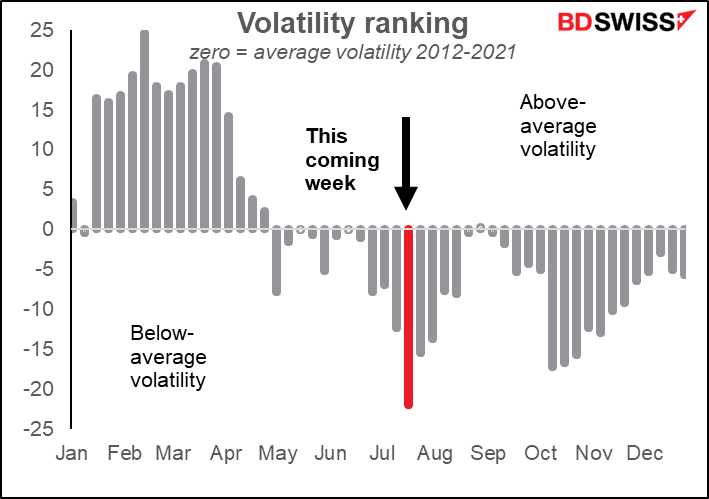
Currency volatility for each week is ranked from most volatile (100) to least volatile (0) of the year. We then take the average for 2012-2021. If volatility were distributed randomly, over time each week should have an average ranking around 50. The graph shows the divergence from 50. Weeks with positive bars have been more volatile than average, those with negative bars are less volatile
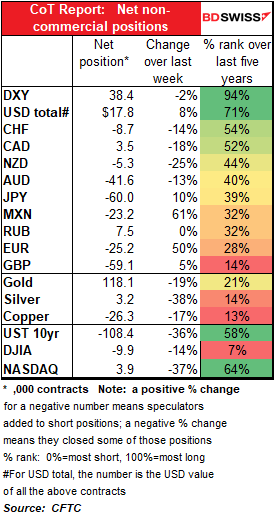
Commitments of Traders (CoT) report
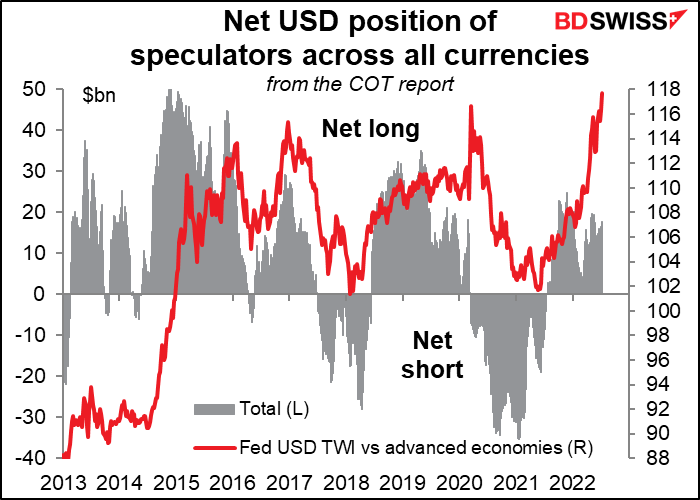
Speculators went further long USD in the latest week as they increased their short MXN, EUR, GBP, and JPY positions. They also trimmed their long CAD further, their only long currency position. On the other hand they trimmed their short NZD, CHF, and AUD positions.
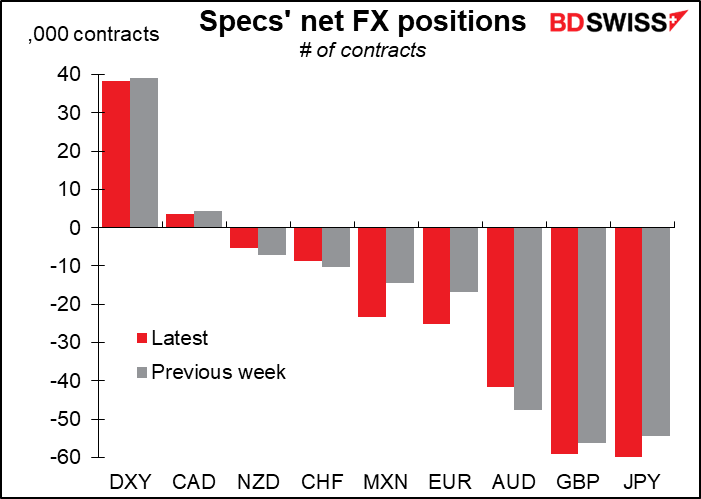
There’s still plenty of room for them to get longer though. Positioning in the DXY index is quite high on a historical basis but not so for the individual currencies.
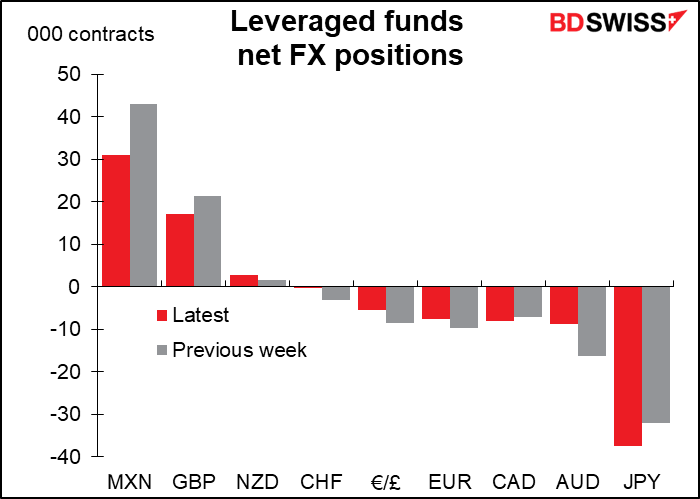
Hedge funds particularly cut their long MXN and short AUD positions. They also reduced their long GPB and increased their short JPY.
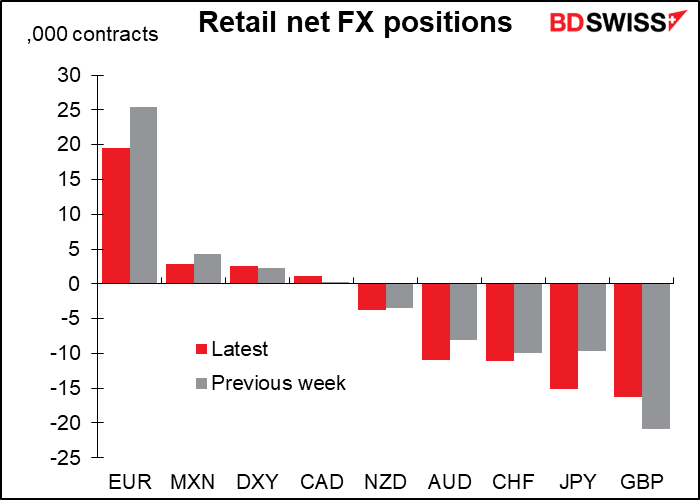
Retail investors cut their long EUR and short GBP while adding to their short AUD, CHF, and JPY positions.
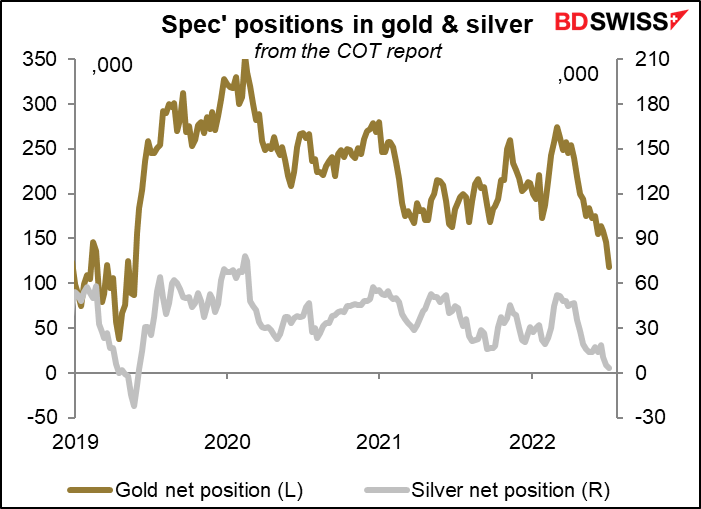
Speculators further cut their long positions in precious metals. They’re almost flat silver now (3,204 contracts vs 5,139 in the previous week).
Today’s market
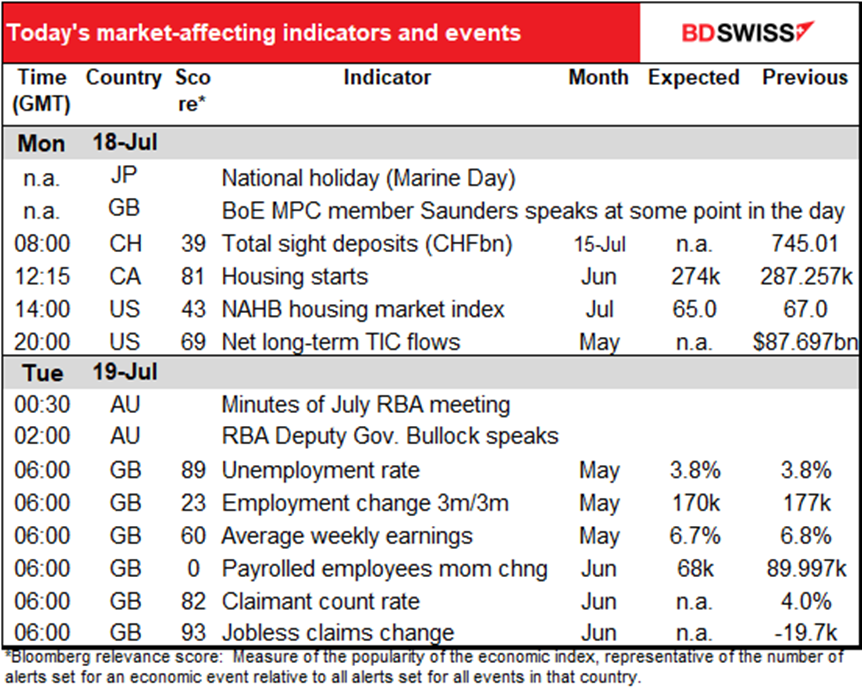
Note: The table above is updated before publication with the latest consensus forecasts. However, the text & charts are prepared ahead of time. Therefore there can be discrepancies between the forecasts given in the table above and in the text & charts.
I hope you all enjoyed a happy Marine Day, today’s national holiday in Japan. Most days are Marine Day for me as during the summer in Cyprus I spend most of my afternoons at the beach.

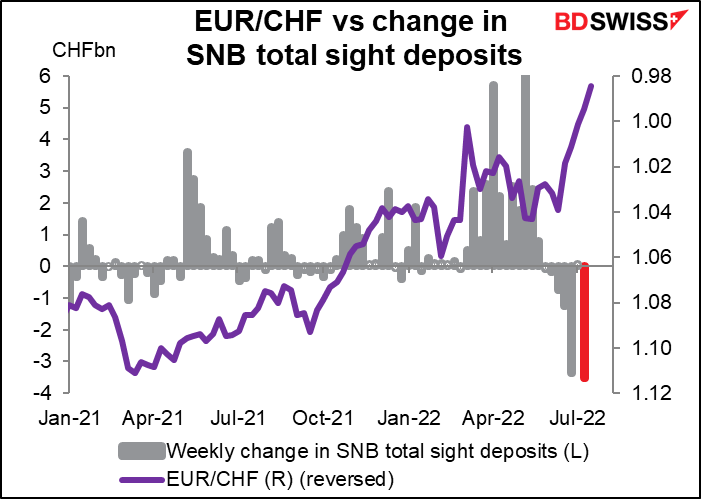
Speaking of the beach, it looks like parity was no “line in the sand” for the Swiss National Bank (SNB). Last week the SNB was at it again, reducing Swiss sight deposits even as EUR/CHF traded below 1.0. We now have no idea what line they want to hold.
Canadian housing starts took off after the pandemic, when everyone started moving out of the cities and into the suburbs. They’ve been slowing for some time and are continuing to slow and are likely to this month as well, judging from the data on building permits. And with the Bank of Canada raising rates by leaps and bounds, they’re likely to slow more in the future, too.

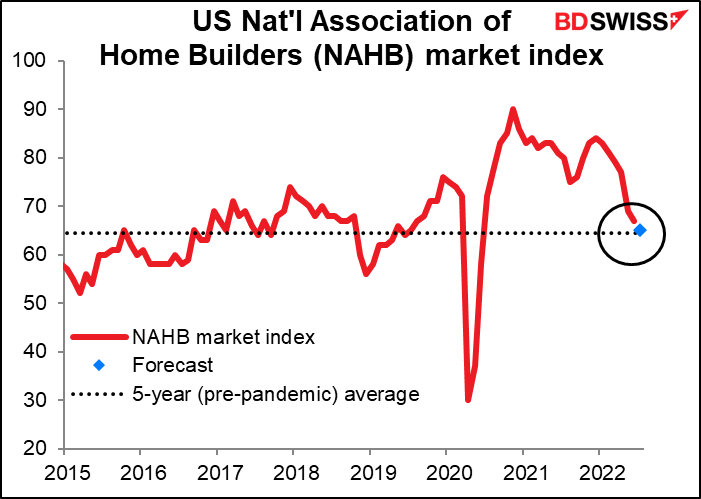
Speaking of slowing housing markets, the US National Association of Home Builders (NAHB) market index is expected to fall to 65. While that’s down a lot from its recent peak of 90, it’s still 1 point above the average before the pandemic hit. So what we can say is that the US housing market is getting back to normal. The question then is, how quickly will it descend into below-normal?
Overnight the Reserve Bank of Australia (RBA) releases the minutes of its July meeting. These aren’t likely to be particularly instructive as the meeting’s outcome – a 50 bps hike – was in line with market expectations. Also, RBA Deputy Gov. Bullock will be speaking on “How are Households Placed for Interest Rate Increases?” However, people will be much more interested in RBA Gov. Lowe’s speech tomorrow morning Australian time to see what hints he gives about the upcoming meeting on Aug. 2nd.
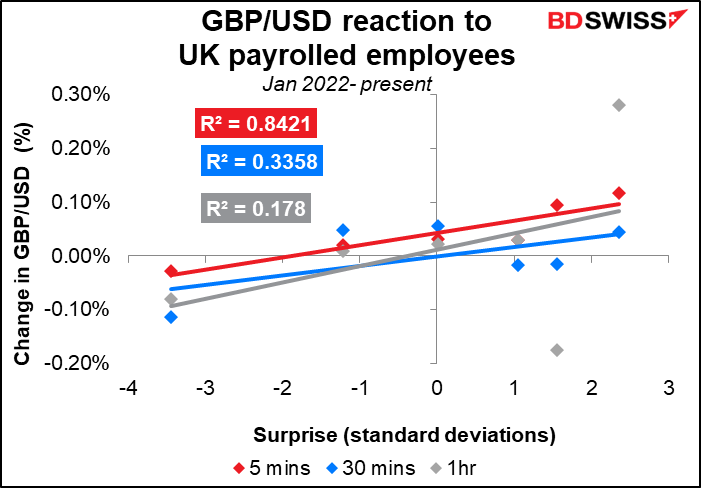
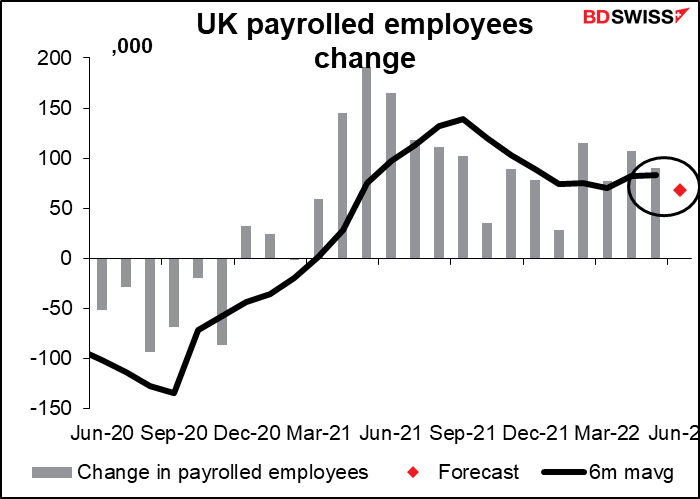
Then early Tuesday morning, Britain releases its employment data. The most important of these nowadays is the change in payrolled employees, which is the British version of the US nonfarm payrolls. It’s a relatively new series that’s both more accurate and available earlier than the other, better-known data. It’s expected to show a small decline in the number of new employees but still growth, which I believe would signal a still-strong labor market.
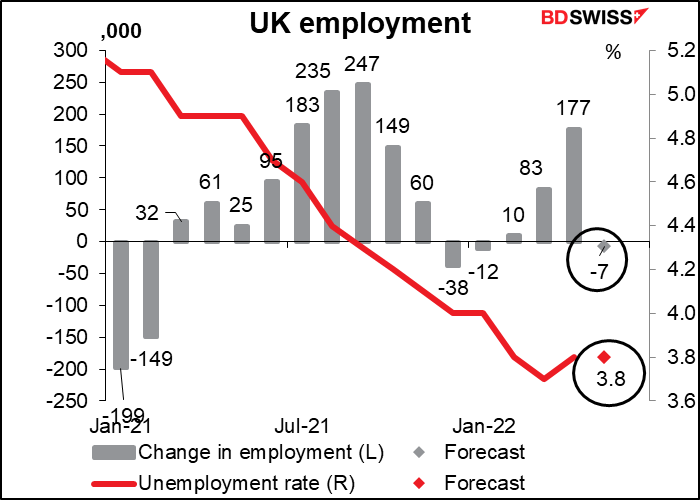
By comparison, the old series “labour force employment change” is expected to show a decline of 7k, although that’s for May – when the payrolled employees series showed an increase of 9k. The unemployment rate is expected to be unchanged at 3.8%/
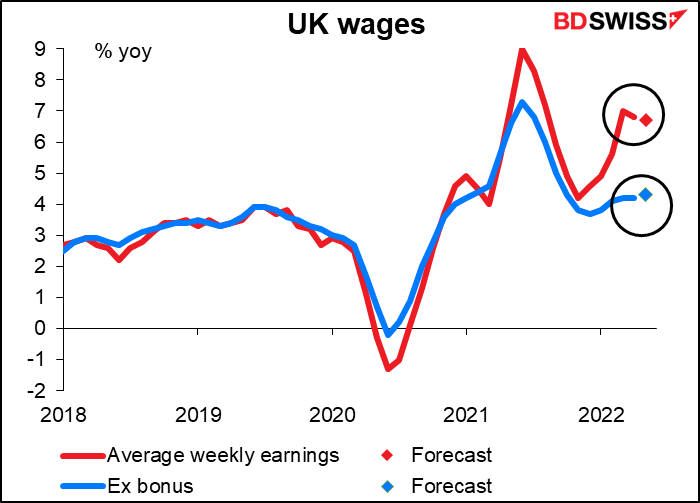
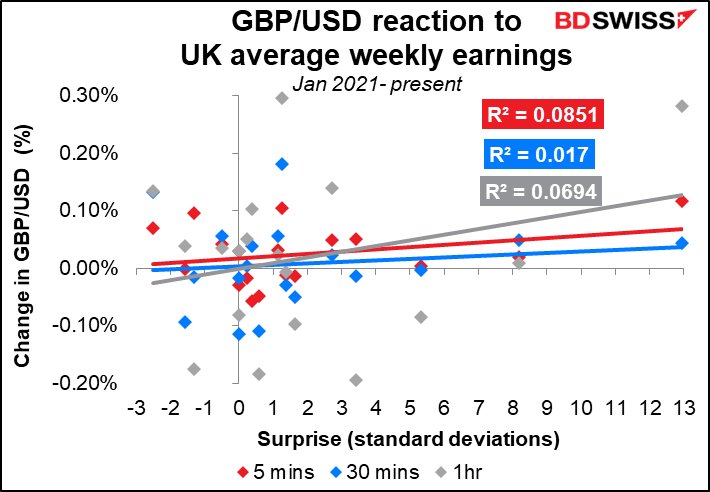
Perhaps nowadays the average earnings series are more important than employment as the Bank of England’s Monetary Policy Committee (MPC) is concerned about the possibility of a wage-price spiral (never mind that the growth of wages excluding bonuses is less than half the 9.1% yoy rise in the consumer price index). At their last meeting, the MPC said that high rates of wage growth – or at least what they consider to be high rates of wage growth – are not being matched by productivity increases but rather are “consistent with elevated rates of unit wage cost growth.” They’ll probably want to hike rates until the unemployment rate gets high enough to ensure a large pool of desperate workers who are willing to take any job at any wage so that they can feed their starving families. In that case, the slight rise expected in average earnings excluding bonuses is going to be a red flag for them – GBP+
Which one of these should you watch? The labour force change has a closer correlation with the subsequent movement than does the unemployment rate or average earnings.

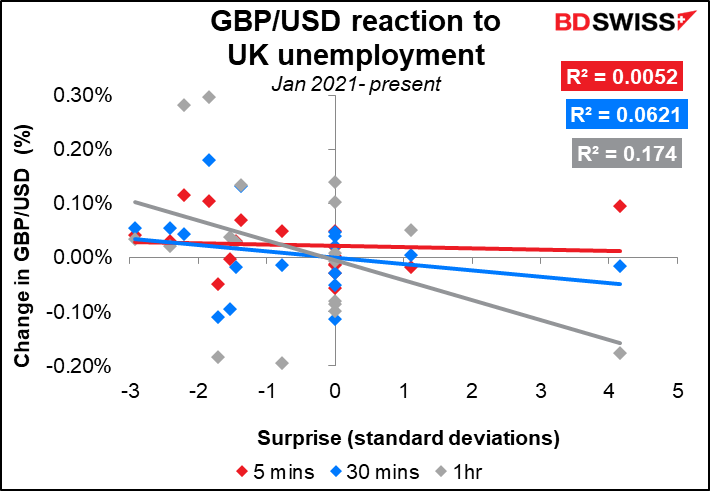
The payrolled employees figure is perhaps not a fair comparison since it doesn’t have as long a history. It’s only been announced this year. Still, the extraordinarily high R-squared, showing an extremely high correlation between the surprise and the movement of the currency in the first five minutes in particular and also in the first 30 minutes, suggests that this is indeed the number to watch. I won’t burden you with a chart of forecasters’ errors for this indicator because not so many people forecast it – last month there were only seven forecasts in the Bloomberg survey, vs 33 for the unemployment rate.