

PREVIOUS TRADING DAY EVENTS –13 Nov 2023
______________________________________________________________________
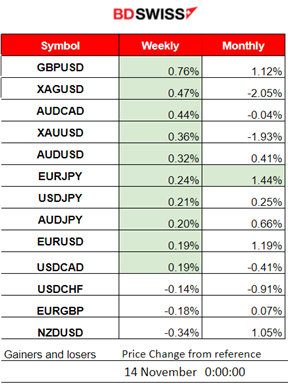
Winners and Losers
News Reports Monitor – Previous Trading Day (13 Nov 2023)
Server Time / Timezone EEST (UTC+02:00)
- Midnight – Night Session (Asian)
No major announcements, no special scheduled releases.
- Morning–Day Session (European and N. American Session)
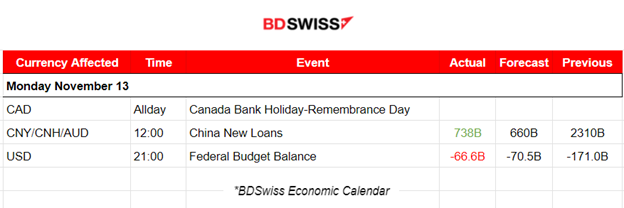
Weak credit growth for China was reported slower than expected in October. Aggregate financing, a broad measure of credit, was 1.85 trillion yuan ($254 billion). No major shocks were recorded in the market.
The interest the U.S. pays on its debt soared in October. Interest on the public debt was up 87% from the figure in October 2022. Despite the surge, the budget deficit for October was notably smaller on a yearly basis; down 24% to $66.6 billion from $87.9 billion. Adjusting for calendar differences, the deficit shrank by 4%. No major intraday impact was recorded in the market upon release.
General Verdict:
 ____________________________________________________________________
FOREX MARKETS MONITOR
EURUSD (13.11.2023) Chart Summary
Server Time / Timezone EEST (UTC+02:00)
Price Movement
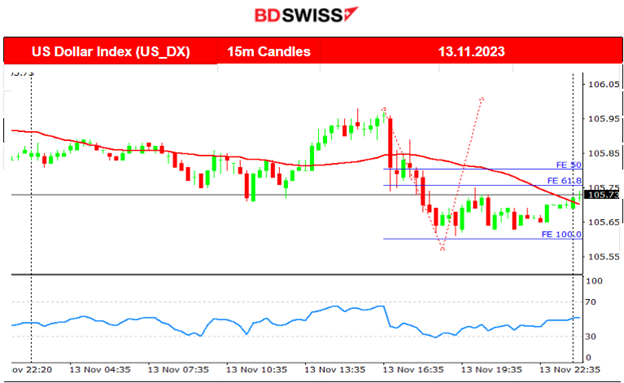
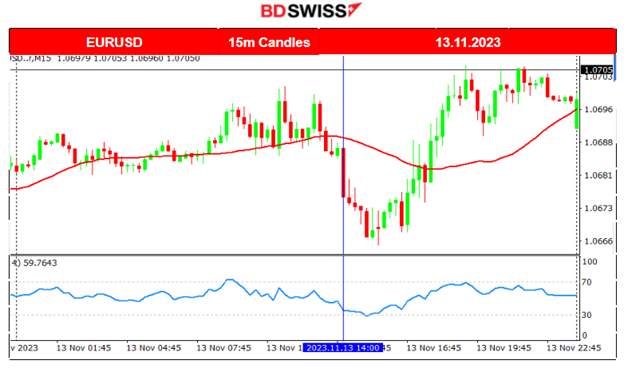
The pair was moving with low volatility until noon when suddenly it experienced a drop falling until it found support at near 1.0666. After testing the support near that level it reversed to the upside crossing the 30-period MA on its way up and eventually finding resistance near 1.0705. Volatility levels were low, it was more of a sideways path around the mean with no significant deviations with the pair closing the trading day almost flat. From the dollar index chart above, it is apparent that the USD was the main driver of this path.
 ___________________________________________________________________
CRYPTO MARKETS MONITOR
BTCUSD (Bitcoin) 4-Day Chart Summary
Server Time / Timezone EEST (UTC+02:00)
Price Movement
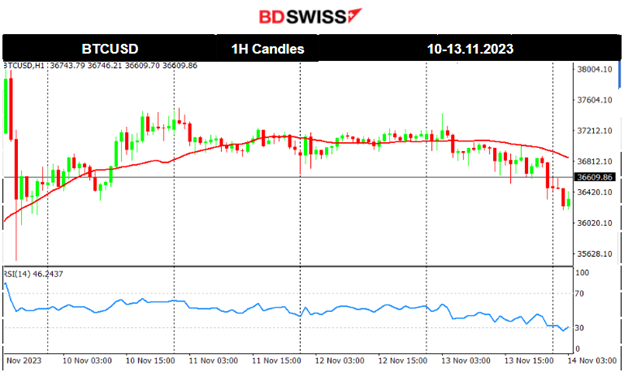
Bitcoin reverses from the upside slowly. It recently deviated from the 30-period MA to the downside but not significantly. The path is stable. After it tested the support near 36200 it retraced to the mean. Significant resistance is now at near 37500.
Crypto sorted by Highest Market Cap:
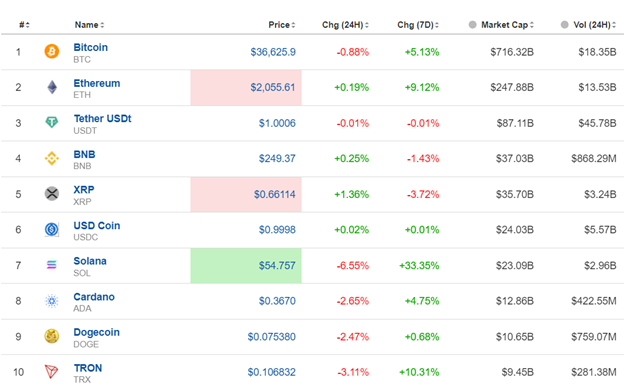
Mixed gains in the last 24 hours since the crypto activity is low. Most cryptos have been losing gains just like Bitcoin with Solana having the most losses, 6.55%. However, Solana has the biggest wins in the last 7 days, up by 33.35%.
Source: https://www.investing.com/crypto/currencies
______________________________________________________________________
EQUITY MARKETS MONITOR
NAS100 (NDX) 4Hour Timeframe Chart Summary
Server Time / Timezone EEST (UTC+02:00)
Price Movement
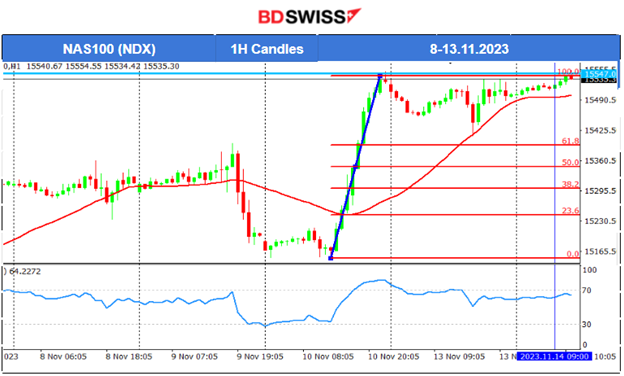
Instead of a retracement, the U.S. Stocks experienced a shock on Friday. We were expecting that the indices would break significant support levels and eventually trigger a retracement after a long and rapid movement to the upside. Instead, on Friday, they jumped to higher and higher levels rapidly. The NAS100 broke the resistance at 15400 and moved higher until it reached levels near 15550 before retracing.
TradingView Analysis and Ideas:
https://www.tradingview.com/chart/NAS100/qdNfiDiR-NAS100-Retracement-13-11-2023/
Remarkably, it is now testing again the resistance near the 15500 level.
 ______________________________________________________________________
COMMODITIES MARKETS MONITOR
USOIL (WTI) 4-Day Chart Summary
Server Time / Timezone EEST (UTC+02:00)
Price Movement
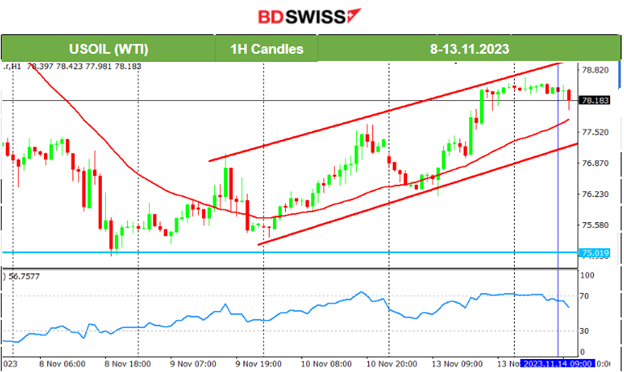
Crude movement was to the downside last week, following a short-term downward trend. It found strong support at 75 USD/b, after which the price eventually reversed to the upside, showing signs that the trend is over and confirming the bullish divergence signal. It eventually broke the 77 USD/b moving to the upside reaching near 78 USD/b to complete the retracement to the 61.8 Fibo level but later, it reversed back again to the 30-period MA. On the 13th Nov, the price surged to the resistance near 78.5 USD/b and currently shows signs of retracement.
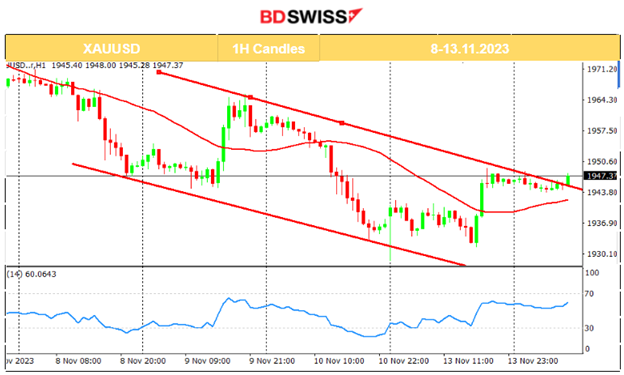
XAUUSD (Gold) 4-Day Chart Summary
Server Time / Timezone EEST (UTC+02:00)
Price Movement
Gold is moving lower but within a downward channel indicating high volatility. Despite several attempts to end the downtrend by crossing the 30-period MA on its way up, it continued eventually lower. The RSI shows higher lows indicating that soon a reversal will take place.
 ______________________________________________________________
News Reports Monitor – Today Trading Day (14 Nov 2023)
Server Time / Timezone EEST (UTC+02:00)
- Midnight – Night Session (Asian)
No major announcements, no special scheduled releases.
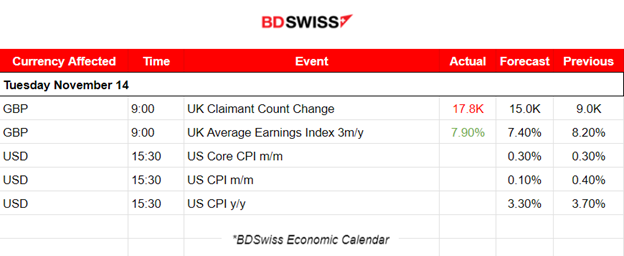
- Morning–Day Session (European and N. American Session)
At 9:00 this morning, the Claimant Count Change was reported more than expected. According to the reports, vacancies fell in the quarter for the 16th consecutive period, with vacancies falling in 16 of the 18 industry sectors. It seems that elevated rates are indeed having an impact. Also, annual growth in regular pay (excluding bonuses) in the U.K. was 7.7% from July to September 2023, slightly down on the previous periods, but is still among the highest annual growth rates since comparable records began in 2001.
The market responded with GBP appreciation. GBPUSD jumped near 25 pips before eventually retracing to the mean and soon continued an upward path again.
At 15:30 the important news will come out with the U.S. inflation-related data. These releases are expected to cause an intraday shock affecting the USD pairs and probably other major currencies. Yearly-based Inflation is expected to be reported lower since the elevated interest rates seem to have a major effect on the U.S. economy as per the latest economic and specifically labour data, reports.
General Verdict:
______________________________________________________________


