Rates as of 04:00 GMT

Market Recap
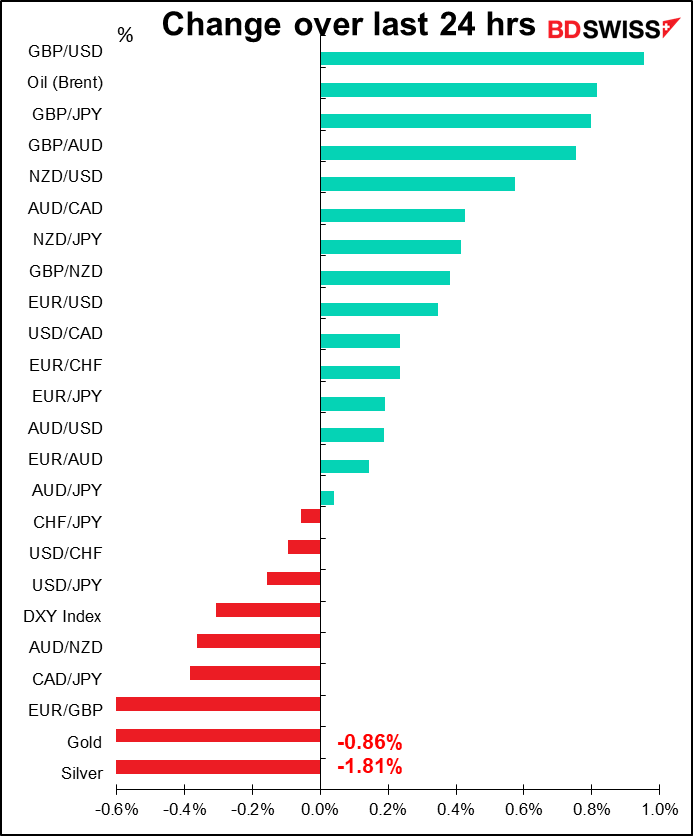
It was a “risk-on” day as encouraging news about a possible virus vaccine from Pfizer and BioNTech supported stocks and gave a generally happier mood to the market, although hardly euphoria – the S&P 500 was up 0.95%. This morning though all Asian stock markets are higher. However as you can see from the table, the reaction in the FX market was not a typical “risk-on” reaction.
It’s unclear what a vaccine would mean for currency markets. The US is such a global outlier when it comes to the virus that it might just mean an even weaker dollar. That’s because countries that are further along in containing the virus, such as Australia and New Zealand, would be able to open up that much faster if they had access to a vaccine to consolidate their progress.. On the other hand, even with a vaccine the US has so many cases already that it would take a lot longer to get things under control.
Moreover, many people in the US – the ones who think wearing masks is an attempt to throw God’s wonderful breathing system out the door with a Communist dictatorship order (I’m not making this up – click the link and hear for yourself) – would probably refuse to take the vaccine anyway, out of fear that Bill Gates is planning on using it to implant a microchip in everyone (apparently 44% of Republicans believe this! That explains a lot about US politics). As a result the US would probably lag even more behind the rest of the world in getting back to normal. That growth differential would probably cause the dollar to weaken.
GBP was the best-performing currency after Bank of England Monetary Policy Committee member J. Haskel said the UK economic activity is returning faster than anticipated. “We now expect the second quarter as a whole will not be quite as negative as expected,” he said. I guess that’s what passes for good news nowadays. His comments were important though because they echo what BoE Chief Economist Haldane said on Tuesday. Haldane is a noted optimist, the one guy who voted against increasing the Asset Purchase Fund at the last meeting because he was confident in the recovery. So it was no surprise that he expressed confidence in the recovery. But if Haskel does too, then that’s a different story. Most of the GBP buying yesterday was vs EUR – this may have been one reason for EUR’s weakness.
The minutes from the June FOMC meeting were published yesterday. The Members seem concerned about being able to provide enough monetary accommodation to achieve the Fed’s mandate of stable prices and maximum employment within a reasonable amount of time. But even after nearly two years of policy review, they haven’t achieved any consensus on which as-yet unused tools could be useful.
The Committee is still actively discussing yield caps or targets (YCT), aka yield curve control (YCC), which Japan initiated in 2016 and Australia recently implemented as well. However, there is no agreement on it yet. The Fed staff pointed out that YCT could require the central bank to buy large amounts of government debt, meaning that monetary policy goals might conflict with public debt management goals. That could risk the independence of the central bank. That may be one reason why the Committee clearly prefers forward guidance to YCT. “Many participants remarked that, as long as the committee’s forward guidance remained credible on its own, it was not clear that there would be a need for the committee to reinforce its forward guidance with the adoption of a YCT policy.” Separately, “a number” of officials seemed willing to tolerate “a modest temporary overshooting of the committee’s longer-run inflation goal” of 2% before raising rates again.
I’m mystified why CAD was the worst-performing currency, especially as oil rose yesterday (the US Dept of Energy reported a huge -7195k decline in inventories, the biggest drop so far this year, vs market expectations of -500k). There was no news out from Canada yesterday as it was a national holiday. It looks to me like oil is coming off today in Asian trading and CAD with it. In the oil market, optimism about falling US inventories and low OPEC output (the lowest since 1991) is tempered by fears about what will happen to demand as the US goes back into lockdown.

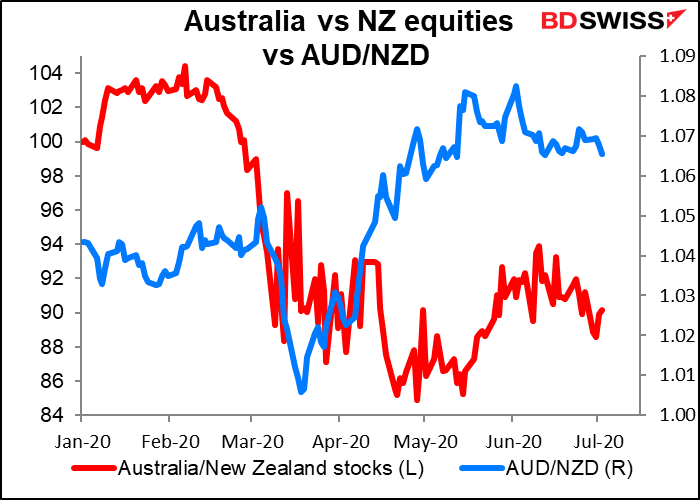
It was also noticeable that NZD outperformed AUD. Some of that was due the much worse-than-expected Australian building approvals (-16.4% mom vs -7.8% expected, -2.1% previous).It may also be that investors are chasing the better-performing New Zealand stock market to position for global recovery (outside of the US, that is). AUD/NZD has’t kept pace at all with the stock markets’ performance.
Today’s market
Today’s the day we’ve been waiting for all week: the double witching hour of the weekly jobless claims plus the monthly nonfarm payrolls (NFP)!!
This coming week we have the nonfarm payrolls, which scores 99.21 out of 100 –the highest of any regular indicator I could find, even higher than the Fed rate decision @ 97.64. Usually the NFP is the first Friday of the month, but this coming week the first Friday is a holiday – the US is taking the Fourth of July (Independence Day) off a day early, since the fourth is a Saturday. That means the NFP will be announced on Thursday, at the same time as the initial jobless claims (98.43) and continuing claims. Since the COVID-19 virus hit, these two have to some degree supplanted – or perhaps augmented – the NFP as the main US indicator, in that they give a more up-to-the-minute picture of the employment situation.
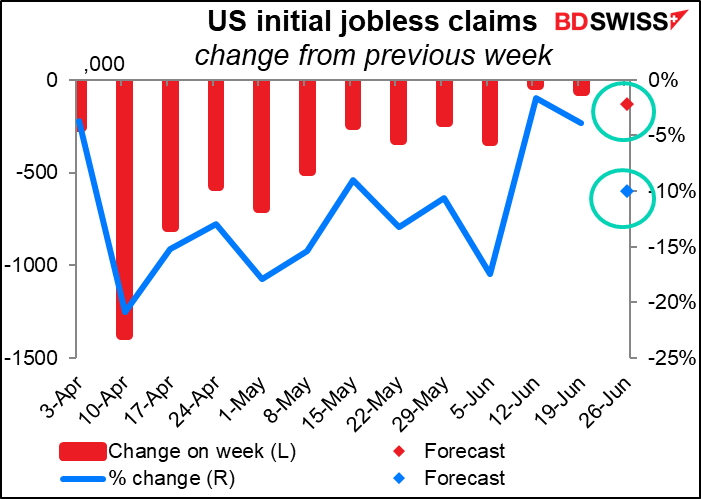
Last week’s jobless claims showed that the rate of decline in claims has stalled. Claims were only 60k less than the previous week, when they were only 26k less than the week before. This week, the market is looking for a bit more of a decline – down 130k or 10% to 1350k. Still this would be disappointing – 15 weeks into this disaster and with some states opening up again, one might have hoped that everyone who was going to lose their job had lost it, but that’s clearly not the case by any means.
This compares with -331k and -226k in the previous two weeks. So initial jobless claims seem to be plateauing out at around 1.5mn people – 14 weeks into this disaster, 1.5mn people a week are still losing their jobs. One might have hoped that with many areas opening up again, job losses would be slowing more than this, but no.
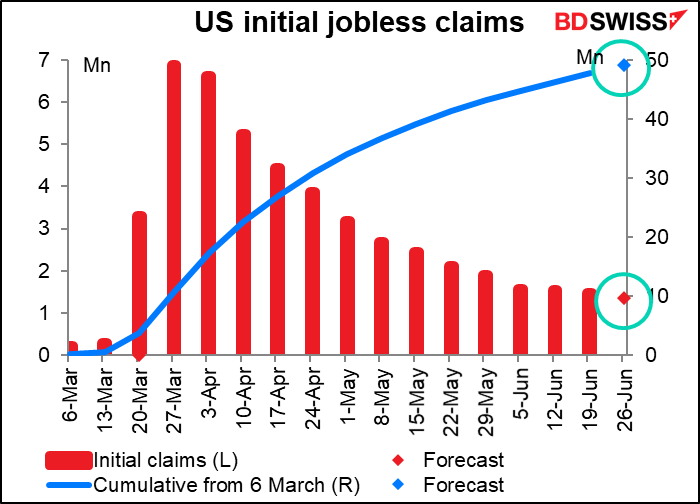
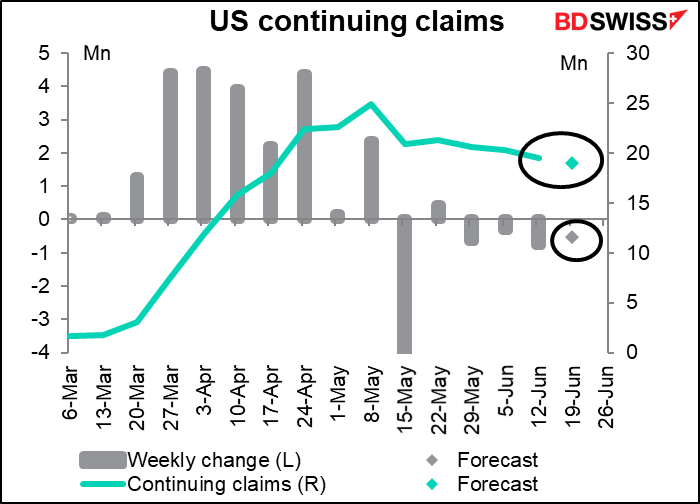
The good news – well, kind of good – is that continuing claims continue to decline, albeit slightly. The market is looking for 19000k continuing claims, a decrease of 522k That means that even if 1.3mn people are losing their jobs every week, even more people are getting new jobs. In the previous week the decline was 767k, so a sizeable number.
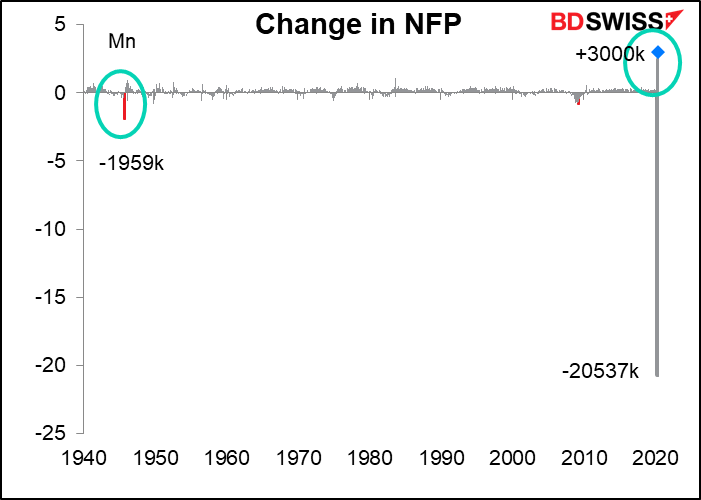
Meanwhile, the June nonfarm payrolls (NFP) is forecast to be a record +3058k, topping last month’s 2509k, which is the record so far. Estimates range greatly however, from 500k to an astonishing 90000k, so the “forecast” would be more accurately described as “the median guess of people who make more money than you can imagine and will suffer no consequence at all if they get it wrong, because their actual job is to get attention, not get it right.”
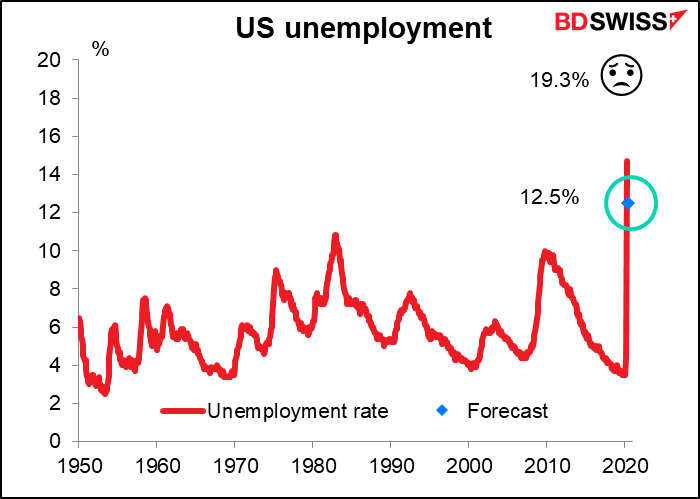
The unemployment rate is expected to fall back to 12.5%. That’s according to the official definition of course. It’s probably closer to 19.3% if we were to define unemployment the way most people would define it and add back all the people getting various unemployment benefits (some 30mn).
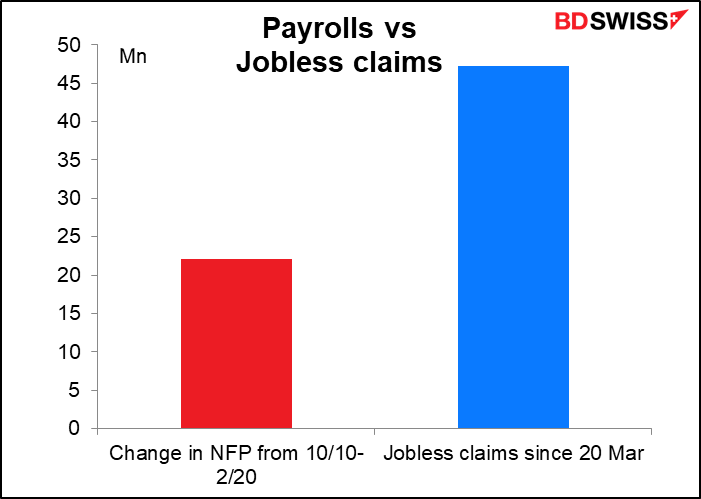
There’s little interest in the other data, such as average hourly earnings, which used to be quite important. Nowadays the only question is how quickly people are likely to get back to work. For that, it seems like we’re going to have a long trek ahead of us. Yelp, a business review site, said in a recent Economic Impact Report that nearly 140,000 businesses registered on its site had closed since 1 March, of which 41% or around 57,000 were closed permanently. And when you think that in 15 weeks, the US economy eliminated more than twice as many jobs as were created in a ten-year span…
Other indicators
That would usually be enough fun and games for one day, but there are other indicators coming out as well.
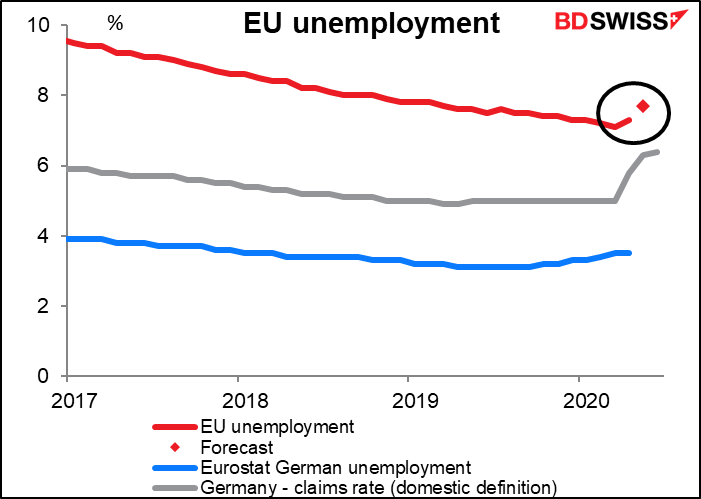
EU unemployment is expected to rise somewhat. This follows yesterday’s German unemployment figures, which showed a lower-than-expected rise in the number of unemployed and only a small (one tic) rise in the unemployment rate. Note though that that figure, the “unemployment claims rate,” is quite different from the Eurostat definition of unemployment and so can’t be translated one-for-one into the EU-wide statistics.
Canada and US trade data come out at the same time as the jobless claims & NFP.
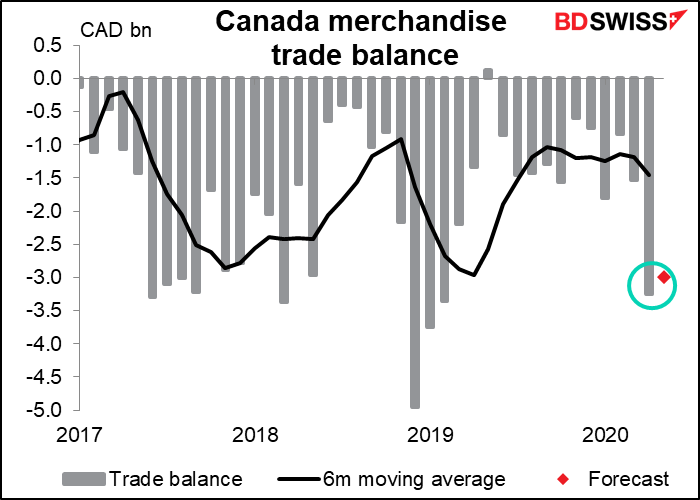
Canada’s merchandise trade figures are expected to show a deficit of CAD 3.0bn. That’s not too far off last month’s figure. Probably some of the reasons are the same as last month, too, especially weak auto exports (down 80% mom in April). On the other hand, oil prices bottomed in April and rose during May, although that might not be much of a help if exports fell in volume terms. Imports probably drove some of the deficit as well, as imports of consumer goods may have picked up after April’s sharp drop.
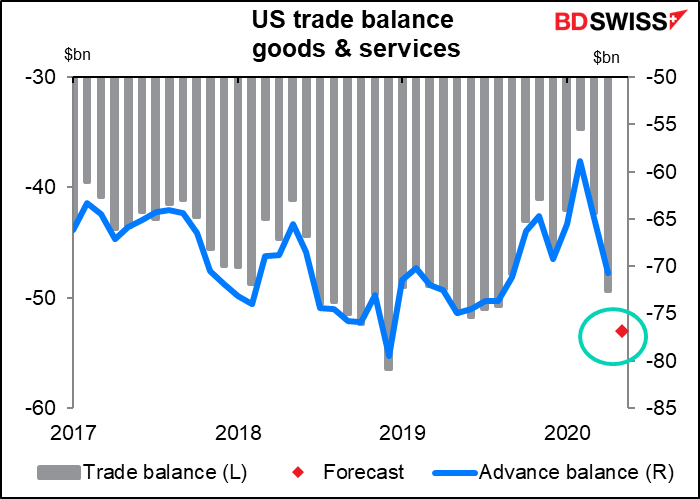
The US trade deficit is expected to widen out further, but nobody pays attention to this in normal times anyway, and it’s certainly not going to garner much attention when it comes out at the same time as the NFP and jobless claims.
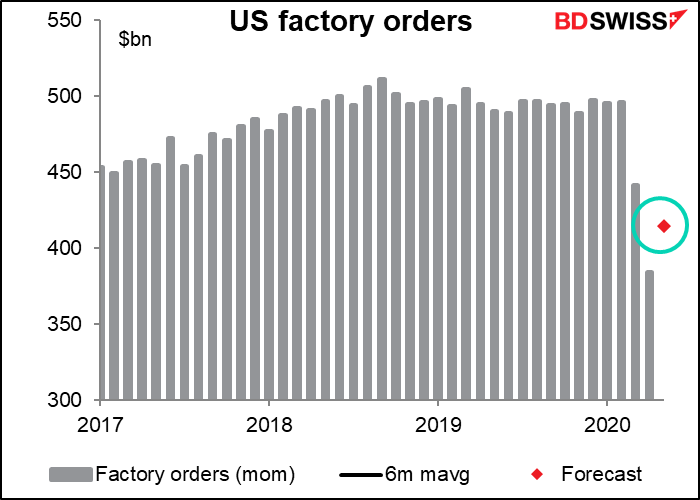
For US factory orders, as usual I don’t think illustrating the percentage change is very meaningful because the jumps are so huge. What we can sees from looking at the graph of the underlying index is that the market expects orders to recover about half the of April’s loss, but that would still leave them down 16% from the January/February average. Net net, another indicator showing that April was the trough but we’re far from recovered in May.
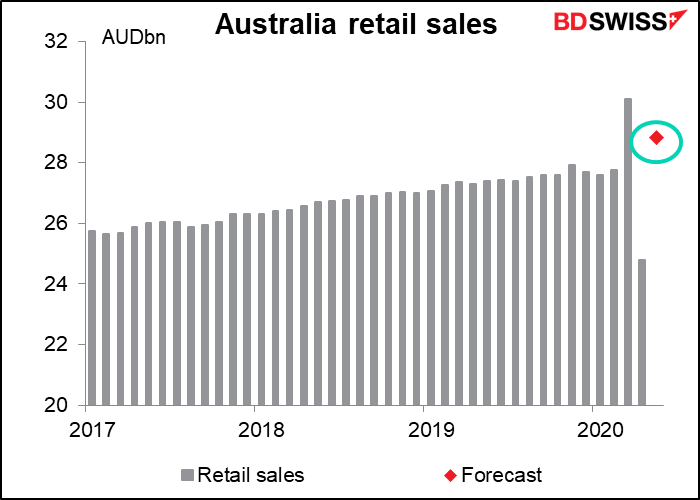
Same with Australian retail sales – looking at the percentage change doesn’t tell the story as well as looking at the index. Pent-up demand is expected to drive May sales above the level prevailing before the pandemic. By the way, this is not going to be market-moving at all. The Australian Bureau of Statistics now produces a preliminary estimate of retail sales, which just happens to be…wait for it…the consensus forecast for the final figure! No surprise there. What is a surprise is that the final figure keeps showing up on economic calendars and not the preliminary one, which is going to be where the new information is released. (That’s probably because the preliminary figure is likely to be just temporary.)
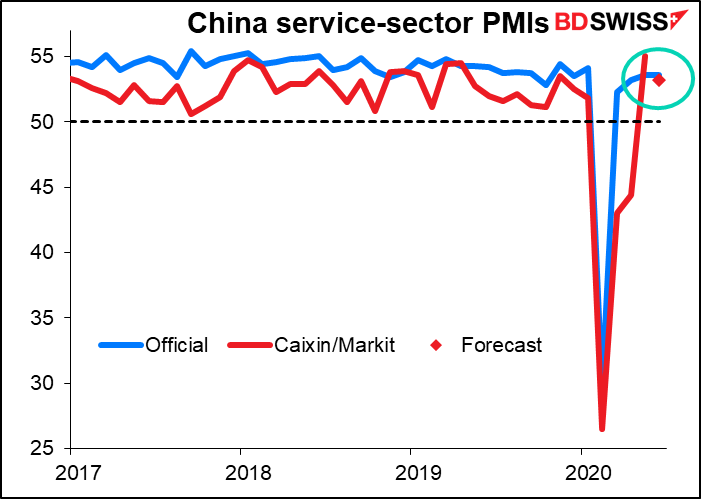
Finally, we have the Caixin China services purchasing managers’ index (PMI). It’s expected to be just a bit below the official version (53.2 vs 53.6), which came out earlier this week.
