Rates as of 04:00 GMT

Market Recap
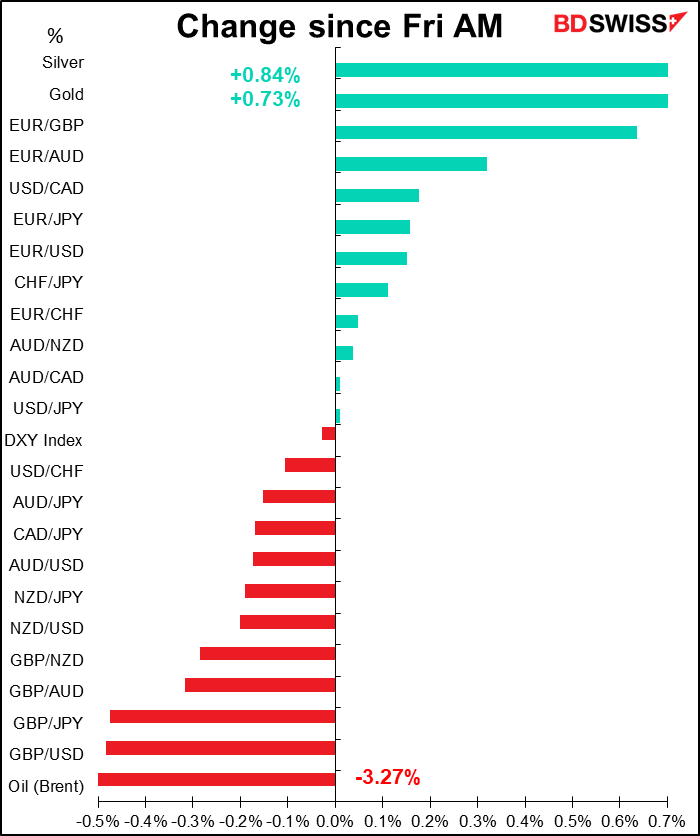
GBP was the big loser on Friday. It fell in anticipation of more disappointment from this week’s Brexit talks. Furthermore, there were some questions about whether Chancellor of the Exchequer Sunak would cut VAT – he was questioning whether people would have the confidence to spend in any case. This morning however GBP is coming back somewhat after UK PM Boorish Johnson appeared in that Newspaper of Record, the Mail on Sunday, and vowed to get the country back on its feet through large-scale infrastructure spending.
The market’s reaction shows that what matters now for currencies is growth, and whatever promises faster growth turns out to be good for a currency. Johnson is expected to unveil his plans in a speech tomorrow. It’s a huge turnaround for the Conservative Party, which previously had stood for fiscal rectitude even if it meant painful austerity. “We are absolutely not going back to the austerity of 10 years ago,” Johnson said. In days gone by that would have been a “sell GBP” signal, but not today.
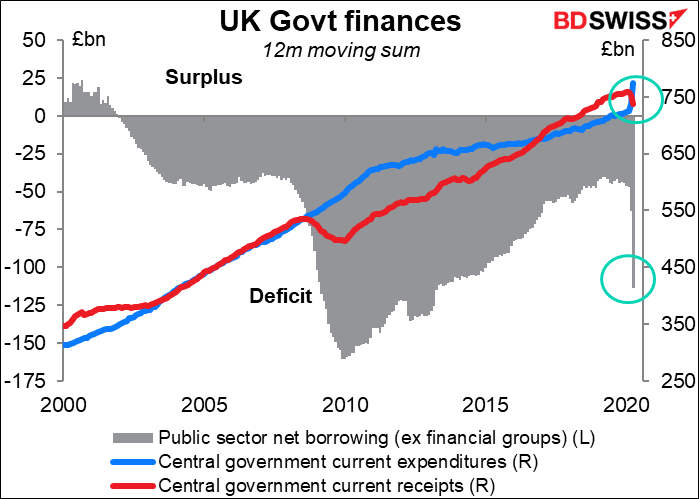
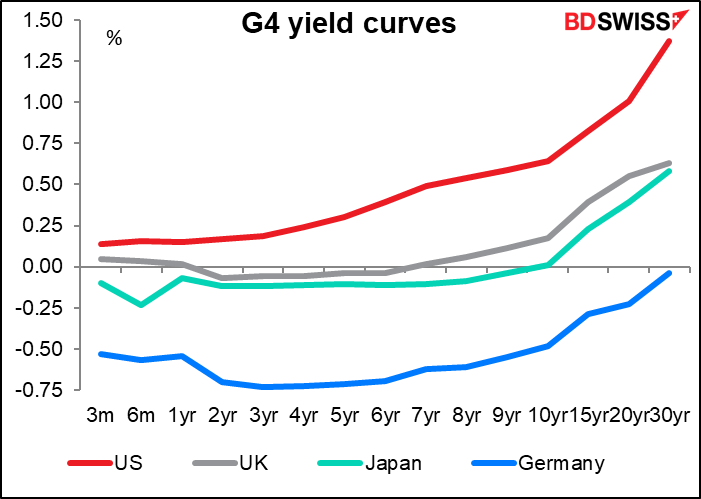
Despite the enormous budget deficit that Britain is planning, gilts yields are negative out to seven years, so who cares?
EUR/USD was little changed on Friday, but rose this morning on – get this – news that CanSino Biologics Inc said its virus vaccine received military specially-needed drug approval from China’s Central Military Commission. The vaccine is currently limited to military use, but it’s seen as a hopeful sign anyway. Bizarre, isn’t it? The US is the hardest-hit G10 country from the virus by far (see below) and yet that’s apparently supporting the dollar.
The reason is that the dollar is moved by two different sets of factors: domestic, such as growth and interest rates, and international, such as a general “risk-on” or “risk-off” mood. We could call this the “domestic dollar” and the “international dollar.” Right now, as the world faces a global threat, apparently the “international dollar” is dominating trading, not the “domestic dollar.”
We’ve seen this dichotomy before, most spectacularly in 2008/09 and then recently when the first wave of the virus hit: the dollar’s international role and the role of the Treasury market as the safest of the safe-haven investments overwhelm what the domestic economic fundaments say “should” be the response of the dollar to events. So during the 2008/09 Global Financial Crisis, the dollar strengthened even though the US was the origin and epicenter of the crisis. Now too we are seeing safe-haven flows into USD even though the US is the worst-hit of the G10 countries and growth is bound to take a hit.
I think that with the Fed’s swap lines in place giving the world adequate access to dollars, the “domestic dollar” is likely to win out over the next few weeks, causing the dollar to weaken as darkness and decay and the coronavirus hold illimitable dominion over all the US, as Mr. Poe said.
Virus watch
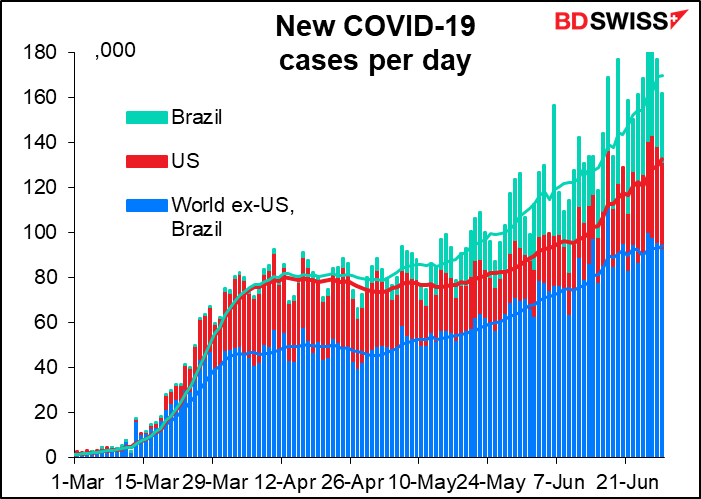
The world has hit a depressing milestone: 10mn cases worldwide. The US (2.5mn) and Brazil (1.3mn) remain the “leaders.”
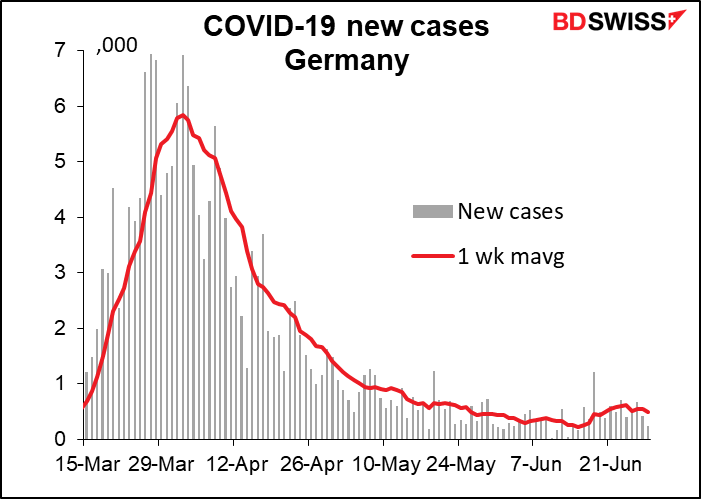
While the virus is coming back to some degree everywhere, the pace at which cases are exploding in the US is certainly an outlier. Here’s Germany, for example:
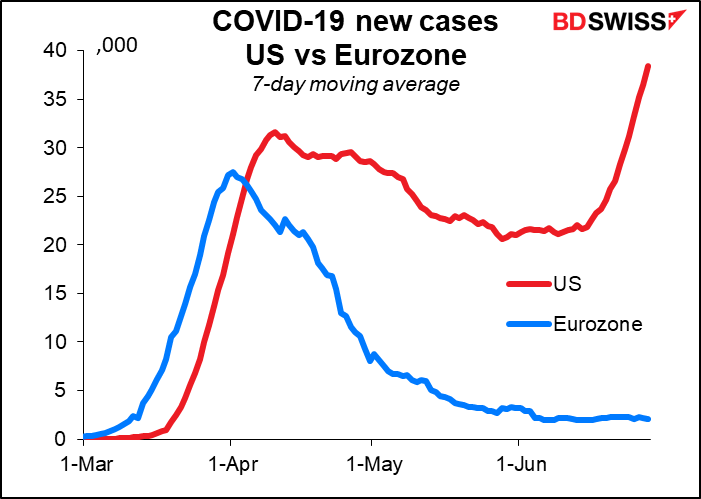
How the US compares with the Eurozone:
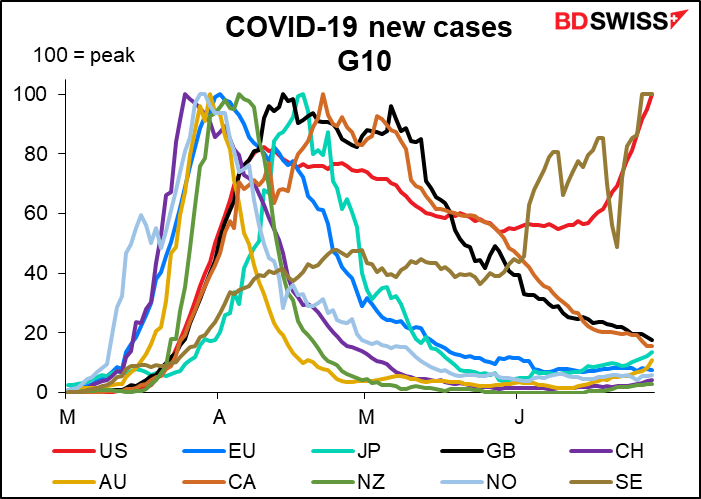
Within the G10, only the US and Sweden are at their peak:
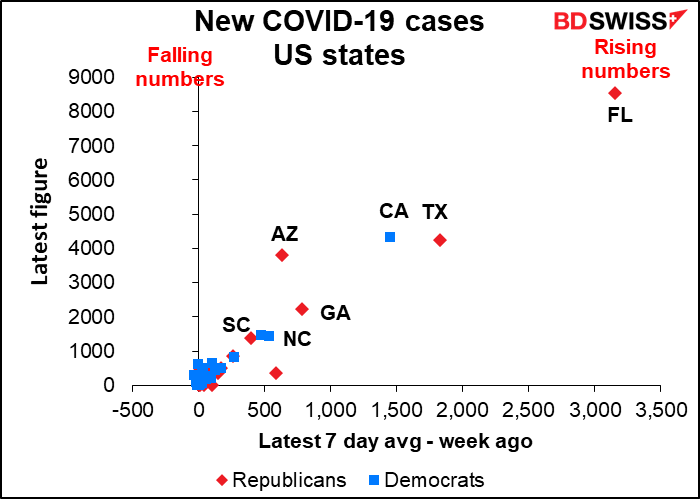
In the US, 39 states and territories are seeing rising cases and only 19 falling. Moreover, in the ones where cases are falling, they’re falling by very little, while the rising states are rising by a lot. Florida is seeing the worst surge, followed by Texas and California. Florida’s cases have risen fivefold in two weeks.
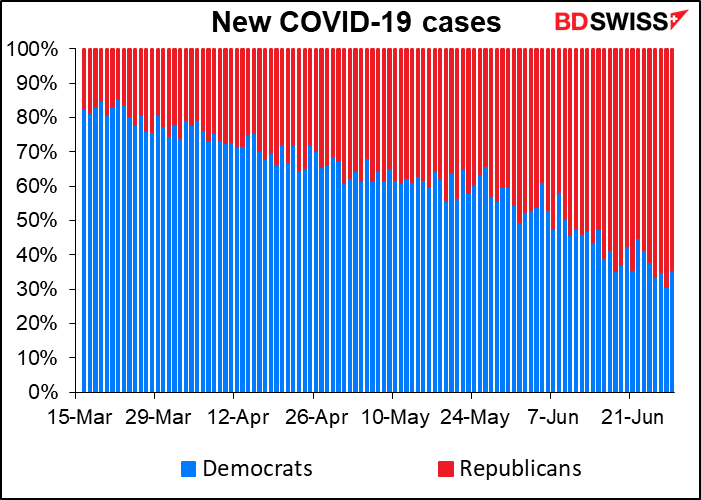
Cases are rising in both Democratic and Republican states, but far more in Republican states now.
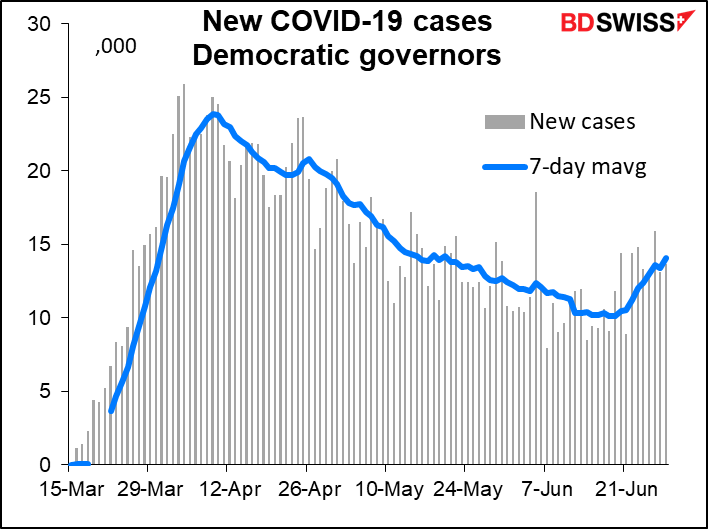
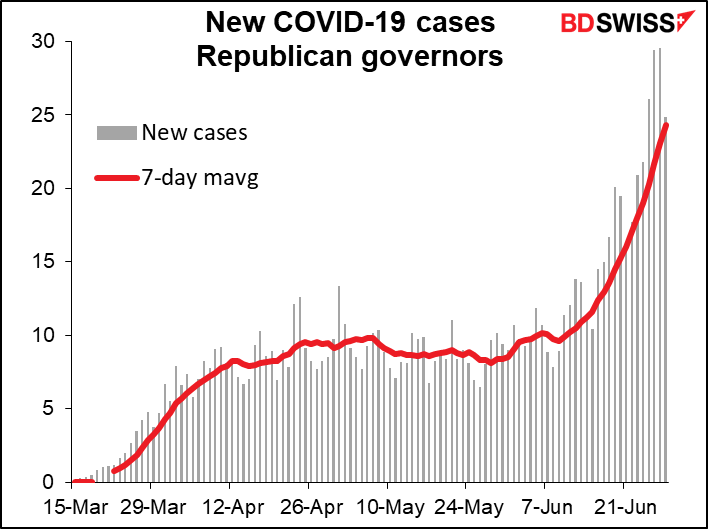
As a result, 63% of new cases are in Republican states now. I wonder how this will affect voting in November.
Finally, I must admit we haven’t yet seen the surge in cases in Oklahoma that I had expected following the Trump rally there, but that may just be because it was so poorly attended.

Commitments of Traders report
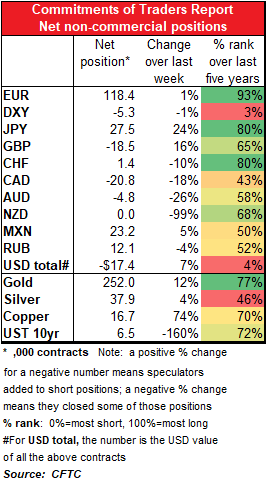
Same trend: out of dollars, into currencies.
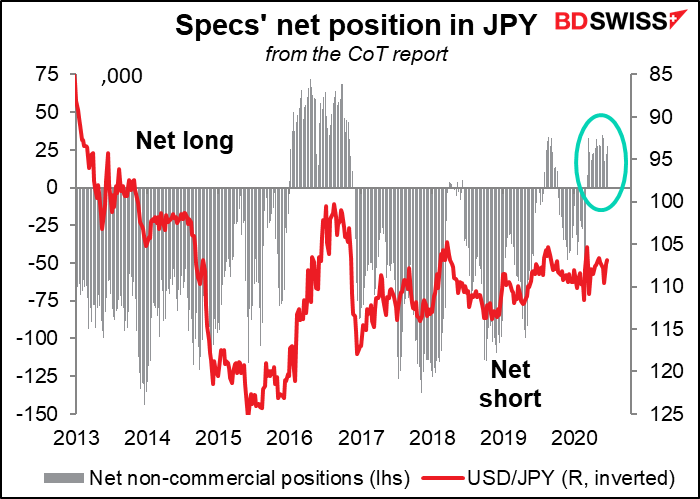
The biggest change was in JPY, where specs added a lot to their existing long JPY positions. Positioning is still quite modest though; as the graph shows, long JPY positions have been 3x as big as long JPY. There’s still plenty of room for them to get longer. Note that the change from short JPY to long JPY took place the week of 10 March. That was also the week AUD shorts hit a several-month high. The AUD shorts started to shrink the next week and have almost disappeared since, but the JPY longs are still there.
In fact, CAD, AUD and NZD shorts all shrank last week, with NZD being more or less in balance. It’s notable that JPY longs would increase (a risk-off indicator) while commodity currency shorts would shrink (a risk-on indicator). What could justify both? My conclusion is that the move in the commodity currencies isn’t so much as a “risk-on” move as it is a “negative dollar” move. That is, they are all expecting the dollar to depreciate from here, regardless of what happens to risk. I think this goes back to the “domestic dollar” vs the “international dollar” discrepancy I mentioned above and the question, can the “domestic dollar” move independently of the “international dollar”? That is to say, will the dollar move according to what happens with domestic US conditions, or will it move according to what happens with global risk conditions? The CoT report suggests speculators are voting for the “domestic dollar,” as do I.
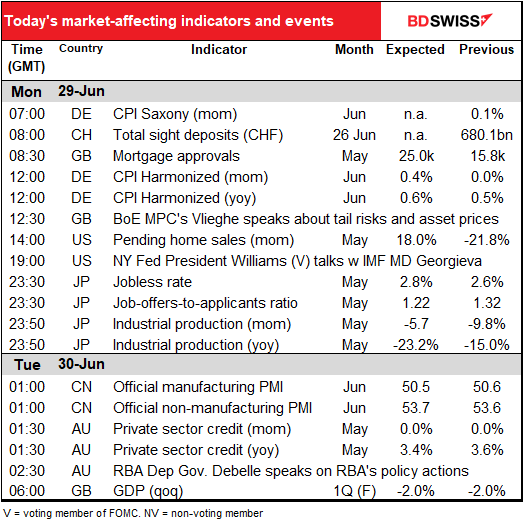
Today’s market
After plunging to the lowest on record in April, UK mortgage approvals are expected to rebound in May – to the second-lowest on record. It’s hard to buy a new home if you can’t leave your current one to take a look at what’s on the market. I think people realize this and will give the pound a pass on this news – Britain still hasn’t fully lifted the lockdown.

Germany’s harmonized index of consumer prices (HICP) (that is, its calculation is harmonized with the rest of the EU) is expected to tic up a bit, but this is insignificant. ECB Executive Board member Isabel Schnabel Saturday said that Eurozone “inflation could remain at close to 0% well into the next year, and even negative inflation rates are possible.” I don’t think a one-month uptic is going to convince anyone that a new trend is in place.

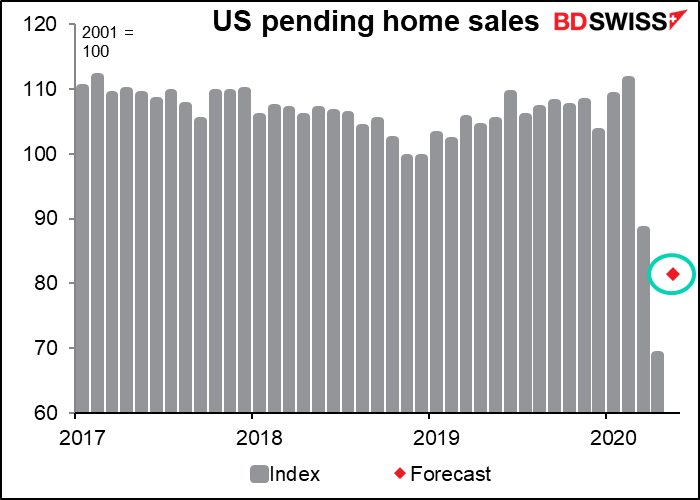
US pending home sales collapsed in April and are expected to soar in May. It’s more instructive then to look at the underlying index. It’s not expected to rebound even to the March level, and is forecast to be 26% below the Jan-Feb average.
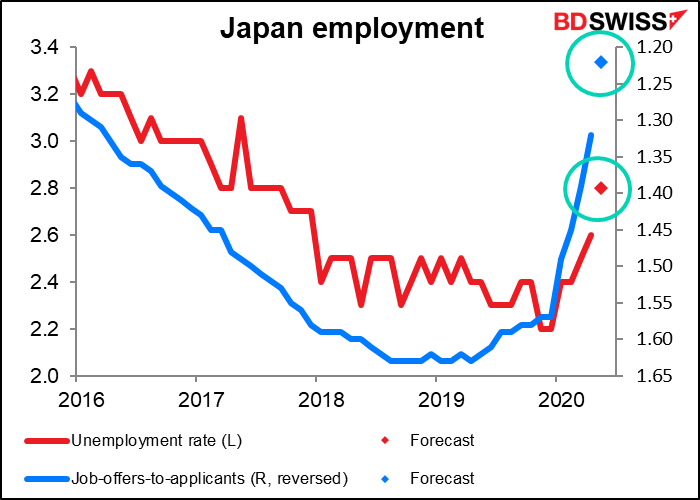
That’s it for the indicators until Japan opens up for business on Tuesday, the last day of the month. Then we get the usual end-month data dump from Japan, including unemployment rate, job-offers-to-applicants ratio, and industrial production.
The unemployment rate is expected to rise only a little to a still-astonishing 2.8% — lower even than the US unemployment rate at its recent low – while the job-offers-to-applicants ratio is expected to fall to a still-health 1.22, meaning there’s still more than one job offer for every unemployed person.
The figures don’t tell the whole story, however. There are also around 4.2mn people who are technically still employed but aren’t actually working. They may not be getting full salaries, if indeed they get anything. Adding these people in would give an unemployment rate of 11.5%. Then there’s another 940k people who left the labor force in April and are therefore no longer counted as unemployed. In other words, Japan is cooking the books even more than most other countries when it comes to unemployment and we can’t judge the situation from the headline statistics.
Unlike most countries, Japan’s industrial production is expected to have fallen further in May. This would be consistent with the Japan manufacturing purchasing managers’ index (PMI), which was the only one of the major industrial economies’ PMIs to fall during the month.

China’s official purchasing managers’ indices (PMIs) are expected to be little changed from the previous month. But of course that’s par for the course with this series. I looked at the standard deviation of these two indices – that’s a measurement of the dispersal of the data – and it’s obvious that these two PMIs are quantitatively different than other countries’ PMIs. Using data from 2013 to end-2019, the standard deviation of the official manufacturing PMI is 0.8, meaning 66.6% of the time the difference between one month and the next will be ±0.8 point. For the service-sector PMI it’s an even smaller 0.7 point. This compares to 2.7 and 3.2, respectively, for the UK; 1.8 and 2.4 for the US; and 3.5 and 2.2 for the Eurozone. I suppose it is possible that an economy with a large number of state-owned companies and a government that actively manages the economy could be more stable than other economies, but it’s also possible that this is just another example of what might be called “economic statistics with Chinese characteristics.”

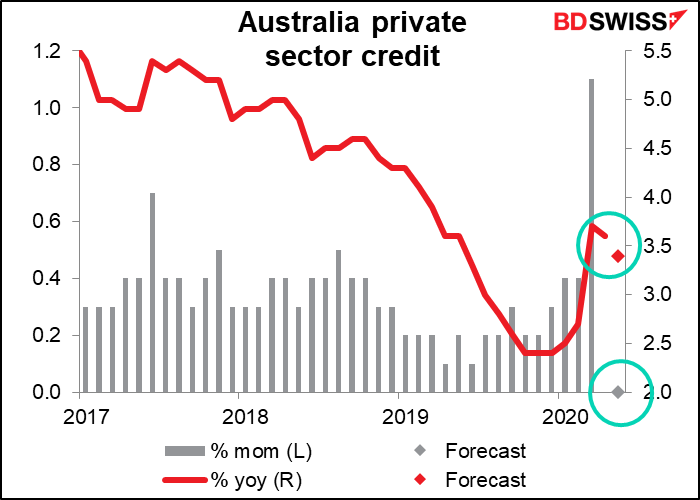
Australian private sector credit is expected to show no increase from the previous month for the second month in a row. Credit jumped in March as companies drew down their credit lines to ease cash-flow problems, but since then companies haven’t borrowed much – they’re in survival mode, not expansion mode — while housing credit has also been weak as turnover in the housing market collapsed.