Rates as of 04:00 GMT
Market Recap
A generally “risk-off” day yesterday with some recent trends reversed.
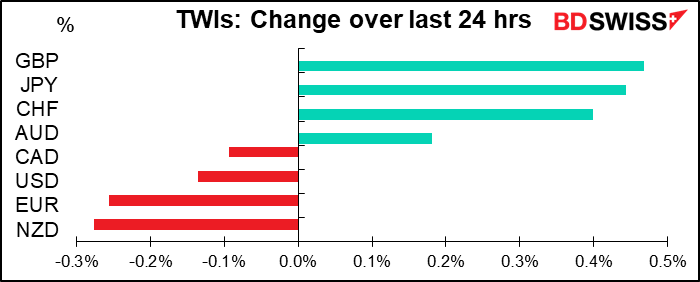
GBP was the best-performing G10 currency, breaking through 1.2900. There were no clear fundamental drivers of the rally. Given the time of month, I suspect that it was due to rebalancing flows stemming from the underperformance of the UK equity market this month – the UK and Japan are the only major stock markets that fell in July (the underperformance of the UK stock market would mean that currency overlay managers’ allocations to GBP were below target and they would therefore have to buy GBP to increase the currency’s share of their portfolio.) Hedge funds were particularly active buyers of GBP.
JPY also gained. USD/JPY is now approaching 105, a level that often in the past prompted Japanese politicians to start warning about “disorderly markets” or other nonsense in an attempt to jawbone the rate back up. That may be why domestic investors were buying the dips at around 105.00 — plus there are some option-related stops in that area too that make it hard to break that level.
The worry about 105 or indeed any other USD/JPY levels is nonsense because they’re only looking at the nominal USD/JPY rate and not the real effective exchange rate (REER). The REER is much weaker than the nominal rate because (up to now) Japan’s inflation has been so much lower than that of its trading partners. In real terms the yen is quite weak right now, far below its average for the last 26 years.
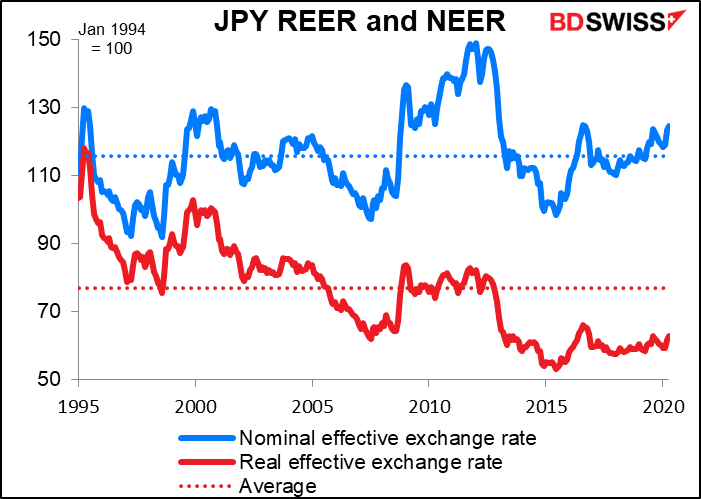
In any case, this is not a “strong yen” move, it’s a “weak dollar” move. The yen has been losing ground vs EUR recently, for example.So perhaps the politicians will have gotten a bit more sophisticated and keep quiet this time, which would allow USD/JPY to fall further in a more orderly fashion (and increasing my USD-denominated cost for my daughter’s university tuition in Japan, but never mind.)
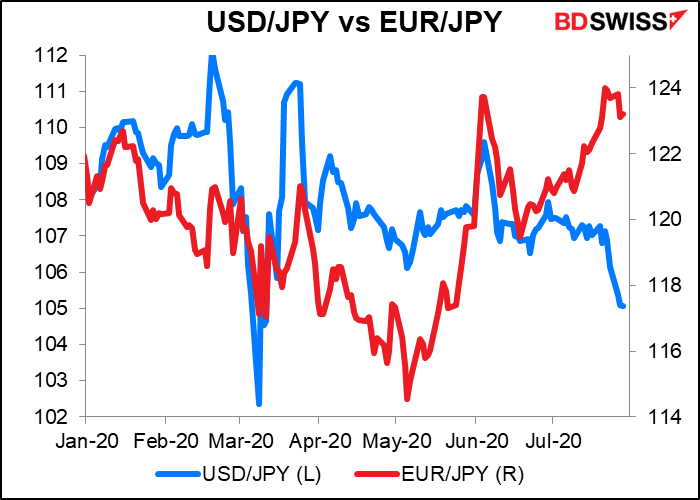
Several of the “risk-on” trends we saw on Monday were reversed on Tuesday, such as EUR/CHF outperformance and strong EM currencies. EUR/CHF, which was the star of the show on the upside Monday, fell sharply on Tuesday. That may be partly for technical reasons – the pair failed to break above the 1.0840/1.0850 upper channel resistance – and also because of the rout in EM currencies, which reversed the rally that we saw on Monday. RUB and TRY particularly collapsed.
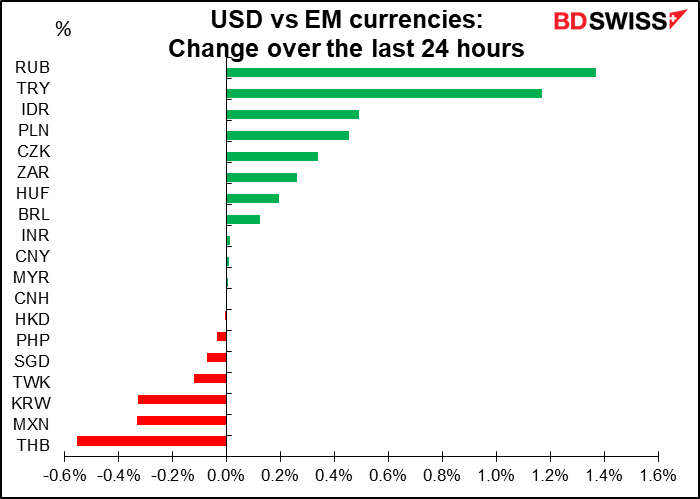
The fall in RUB is somewhat of a mystery. It may have been hit by weaker Brent prices, however natural gas was up sharply so that seems unlikely. TRY has been under considerable pressure recently. A story on Bloomberg said that state banks have been in the market supporting their currency to the tune of around $1bn a day on Monday and Tuesday, which is enormous – previously, intervention was around $2bn-$3bn a week. It’s especially serious when you consider how weak the dollar is. Turkey credit spreads widened yesterday as well, indicating a general market flight from the country.
One notable point was that although there was indeed a general “risk-off” tone, this time USD didn’t benefit – it was lower on a trade-weighted basis. I think that indicates the market’s general USD-negative bias nowadays. EUR/USD was unchanged.
Gold was up on the day but silver down, bringing the gold/silver ratio back up to 80.6 this morning (it was 78.99 at the end of the day Monday). Gold fell during the Asian day yesterday but recovered during the European day. At one point FX traders were looking to gold as an indication of the dollar’s value in general and trading the DXY index accordingly – gold strength or weakness being taken as the counterpart of dollar weakness or strength – but that correlation faded during the European day. The main takeaway here though is that with the G10 countries doing quantitative easing, gold and silver are the only “currencies” that don’t have a central bank that can print more at will.
High-frequency data: US turning down, global recovery stalling
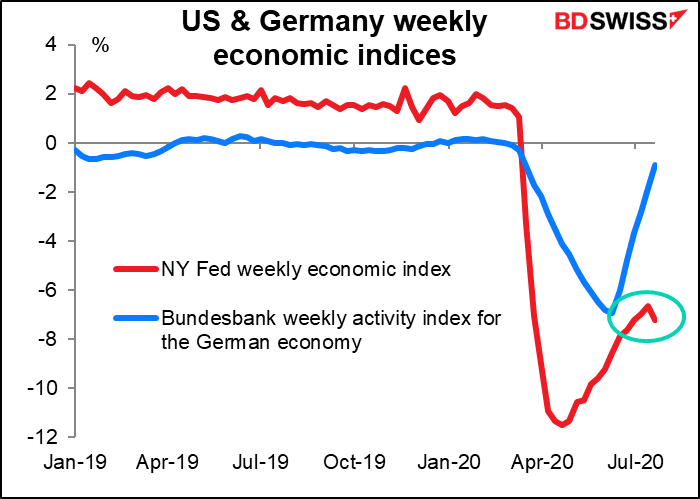
The New York Fed released its “weekly economic index” for the week of 24 July. While the previous week was revised up a bit (to -6.7 from -7.1), the latest week was distinctly lower: -7.24. Thus the index is telling us that US economic activity is turning down. Meanwhile the comparable German indicator, released Monday, continued moving higher in an unbroken line. No surprise then that EUR/USD is moving higher.
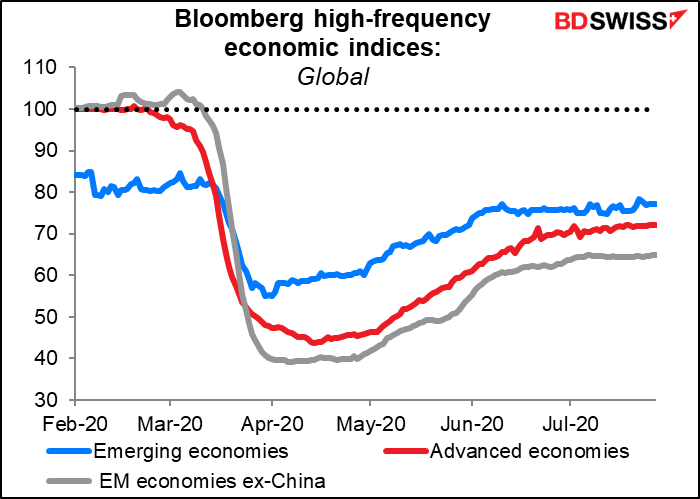
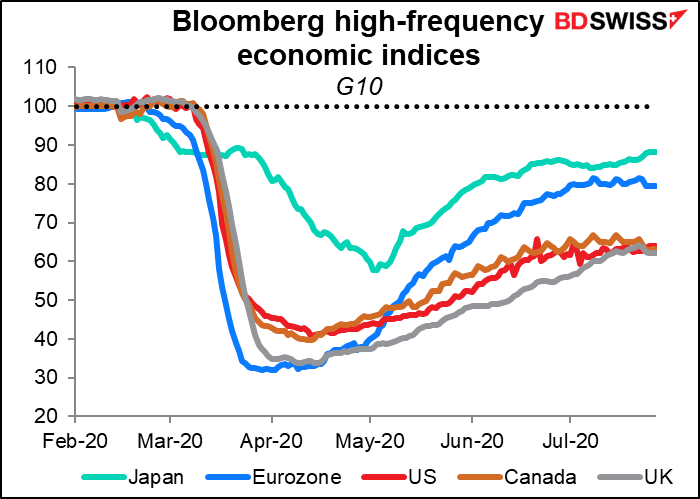
Elsewhere, Bloomberg’s summary of high-frequency data shows the global recovery is stalling. Activity in most countries has hit a plateau and while it may not be declining (as the Fed’s version shows for the US) it’s no longer recovering at the same pace, either.
Today’s market
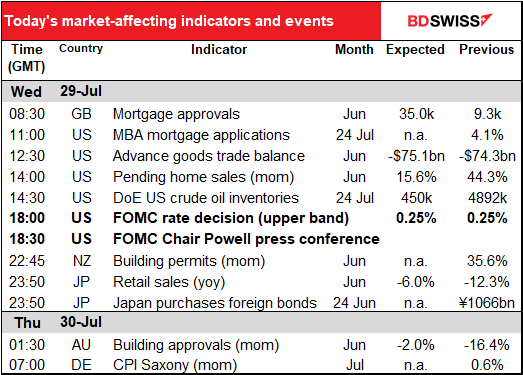
The big thing today is obviously the meeting of the US Fed’s rate-setting body, the Federal Open Market Committee (FOMC). I wrote about it extensively in my weekly last Friday.
To summarize what I said there, we’ve had meetings of several other central banks this month and while some tinkered with their forward guidance, none changed their rates or their programs significantly. I expect the same from the Fed: some comments on the current situation, concern about the future, and a willingness to do more if necessary. I don’t expect much change in the statement following the meeting. The important points will only come out during Chair Powell’s press conference and the minutes, which will be released on 19 August.
Instead, they’ll probably discuss the review of monetary policy strategy, tools, and communications that was announced in November 2018. They can discuss some of the topics that were brought up in the review, such as how changes to the inflation framework should be spelled out and implemented, what changes if any are necessary for their forward guidance and asset purchases, etc etc. Powell may give some details of those discussions in his press conference following the meeting. He may then preview them in the Fed’s virtual “Jackson Hole” meeting, to be held 27-28 August and perhaps start to implement them as early as the September meeting.
One of the changes under discussion is tying any future moves to inflation while making it clear that they would tolerate a period of “catch-up” inflation. That is, if inflation is 1 percentage-point below the 2% target for a year or two, they might tolerate it being one point above the target for a similar amount of time. Several FOMC members have spoken out in favor of this idea recently.
One other topic recently has been yield curve control: targeting the longer-end of the yield curve as well as the short end. Japan started it and Australia has also implemented it. So far they’ve largely agreed it’s worth considering, but as far as I remember no one has specifically come out in favor of it.
Today’s data
The day starts with UK mortgage approvals. These hit a record low last month of 9,273. This is astonishingly low – last year the average was 66,831 per month, and the previous low, set in Nov 2008, was 26,334. This month (June) they’re expected to bound back to a more acceptable but still low 35.0k, which is around half the normal level. Must be tough being an estate agent in the UK nowadays.

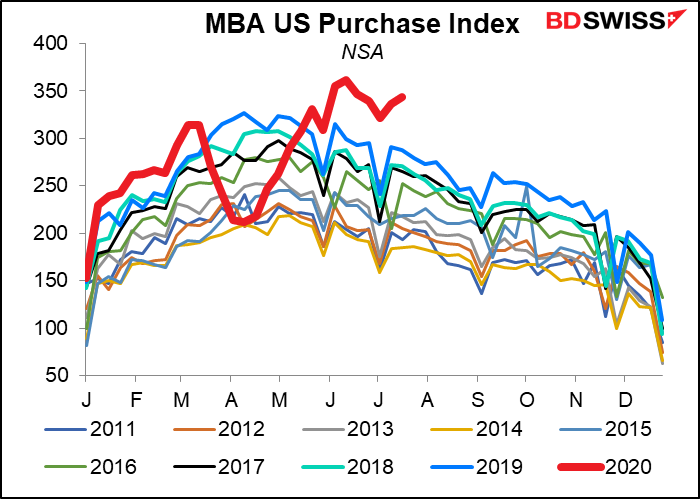
Not so in the US! The US Mortgage Bankers’ Association (MBA) mortgage market index is through the roof – far above anything over the last 10 years. (No forecast available)
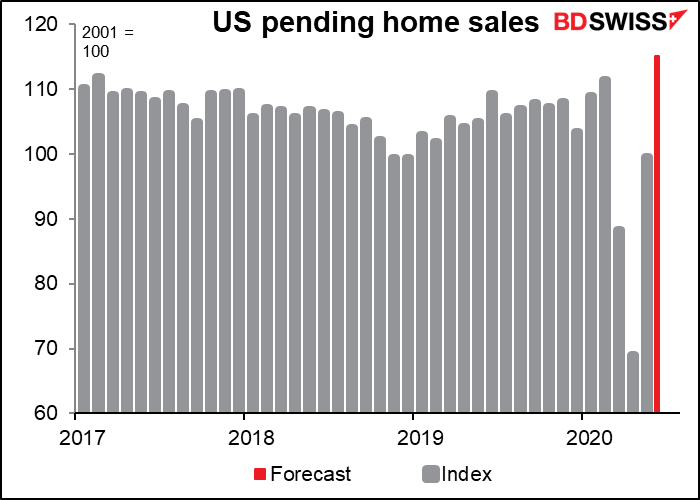
Indeed the US housing market is quite solid. Today’s pending US home sales are forecast to be above the levels of earlier this year, if you convert the forecast mom change back into an index number. There aren’t many statistics like that in the US, except maybe the unemployment figures.
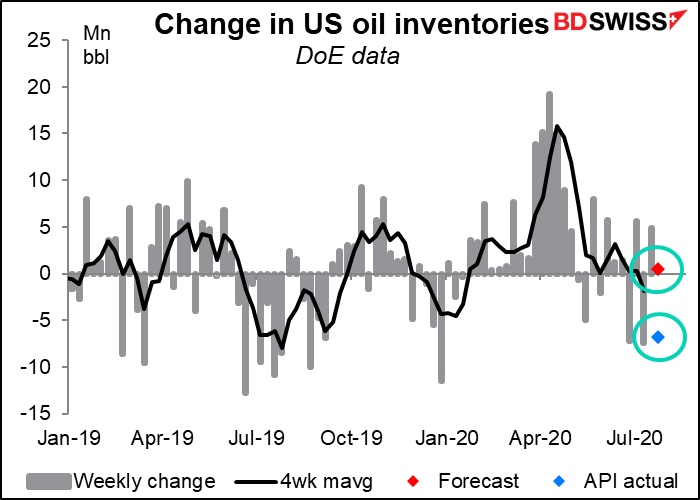
The weekly US oil inventories are forecast to show a small rise (red dot), but the American Petroleum Institute (API) yesterday announced a surprising and surprisingly large (6.8mn) drop in inventories (blue dot). Last week, the API reported a large and unexpected rise in oil inventories of 7.5mn barrels, contrary to analysts’ expectations of a drawdown. Yesterday’s figure reverses last week’s surprise inventory build.
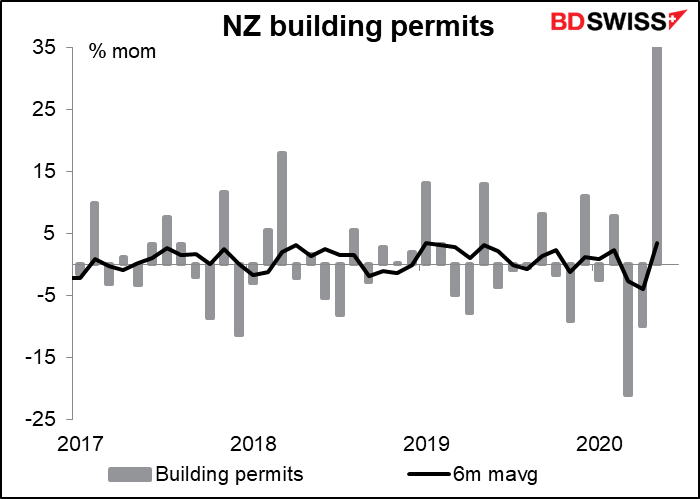
Then overnight we get NZ building permits. I’ve checked this out and it has virtually no correlation with subsequent FX moves, plus it has no forecasts, but I see on Bloomberg that it’s closely watched (83% of the people who watch NZ indicators watch it) so I present you a graph.
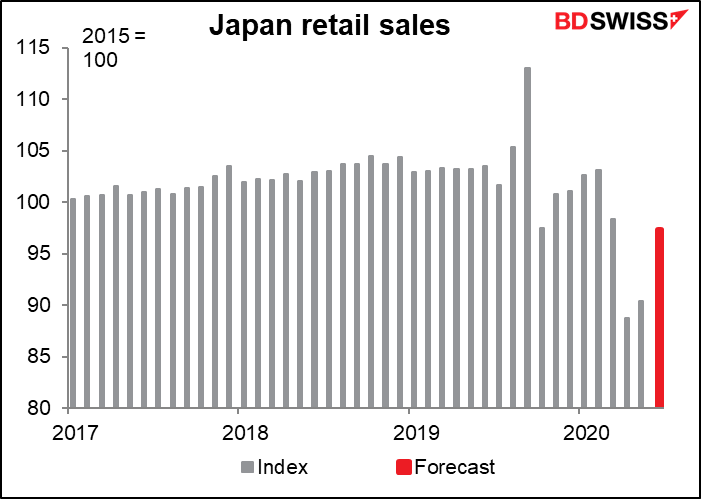
Japan retail sales too. I was surprised to see that with a Bloomberg score of 74 (meaning 74% of the people who set alarms for Japan indicators have one set for that indicator). When I worked in Japan there weren’t any reliable retail sales figures – because of the government’s mercantilist bent, the entire statistics infrastructure was designed to track production, not consumption.
Because of the wild swings recently, this is another statistic where the value of the index is more informative than the percentage change. (In this case I’ve used the forecast for the yoy rate of change to calculate the index, not the mom rate, because that seems to be the more closely watched — more people forecast the yoy rate and more people watch it.) Sales are expected to come back almost to the March level, which was still below normal. The figures have been distorted by the hike in the consumption tax last October, which caused a lot of advance buying in September.
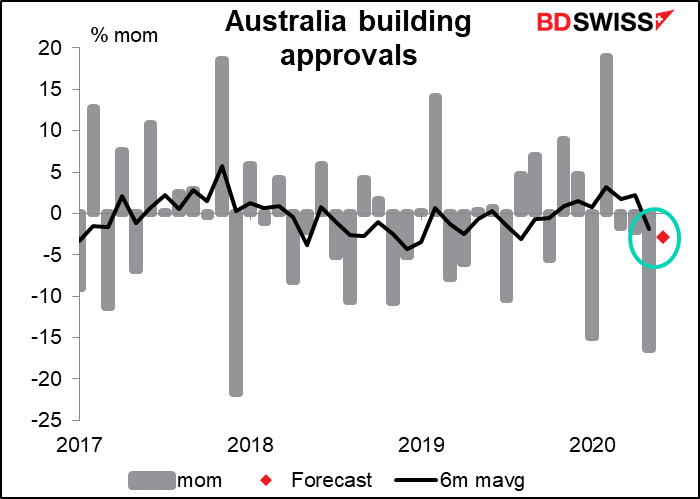
Australia building approvals are forecast to be down slightly, which is pretty bad as they’ve already been down for three consecutive months, including a 16.4% mom plunge the month before. Suffice it to say that not many buildings are getting approved these days. This is not a uniquely Australian phenomenon – look at the UK mortgage approvals at the beginning of this comment. It’s hard to buy a new house when you’re not allowed to leave your old one. Not every place has a housing market like the US. However, house purchases and listings of houses for sale have recovered nicely since early June, so June may be the bottom for building approvals.
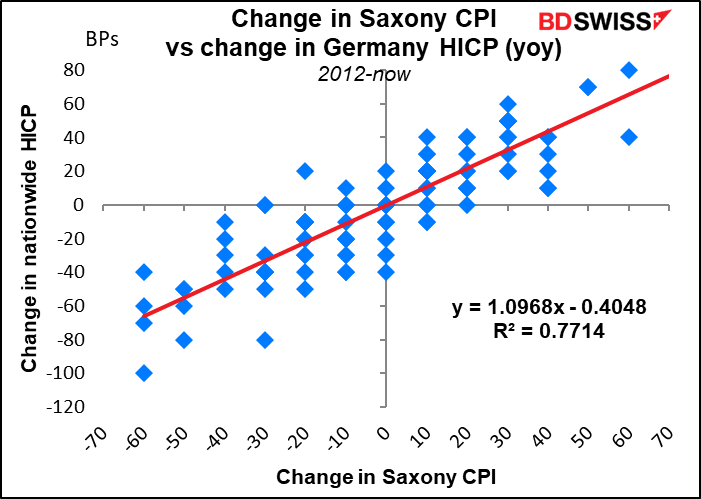
Then when Europe opens up, people will be watching the consumer price index (CPI) from the German Lander of Saxony to get an idea of what the national CPI out later today is going to be like. No forecast available so you’ll just have to watch your screen, assuming of course that you’re interested, which you’re probably not nowadays anyway.
