Rates as of 04:00 GMT
Market Recap
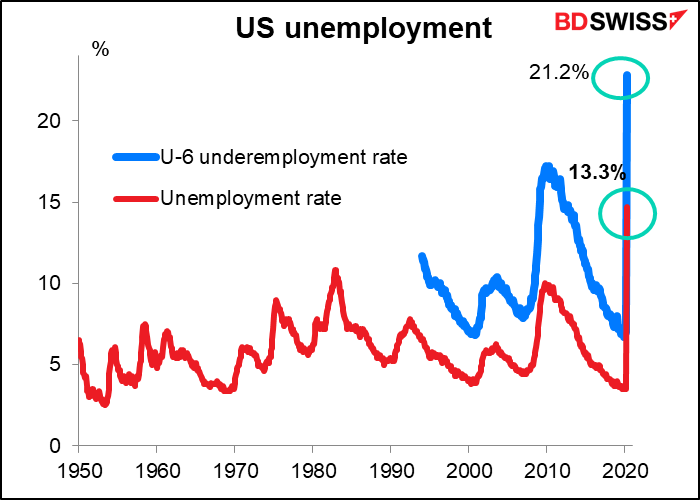
Amazing day Friday! Nonfarm payrolls rose an astonishing 2500k, the highest on record. To say that “no one saw this coming” would be a gross understatement; no one even forecast a rise, let alone a record rise. The forecasts on Bloomberg were from -800k to -12000k, with a median of -7500k. Meanwhile, the unemployment rate fell to 13.3% from 14.7% — the market had expected it to rise to 19%.
According to the Bureau of Labor Statistics (BLS), the improvement “reflected a limited resumption of economic activity that had been curtailed…employment rose sharply in leisure and hospitality, construction, education and health services, and retail trade.”
However, the BLS also admitted to some problems with the data concerning the misclassification of people. A lot of people were classified as “employed but absent from work” instead of “temporary layoff.” If those people had been classified as laid off, then the unemployment rate would’ve been 3 percentage points higher, the BLS said.
(If you’re interested in learning more, there’s a brief explanation in a box in the press release here and a much longer (15 page) explanation of the impact of the virus on the figures here.)
Many people are shouting “fraud” and “cooking the books,” which is entirely possible. However, I’d like to point out that Canada’s employment data for May, released at the same time, showed the same pattern. Employment rose by 290k instead of falling by 500k, as expected. The unemployment rate rose only slightly to 13.7% from 13.0% – the market had expected it up at 15.0%. So it may indeed reflect some improvement.
Nonetheless, let’s not forget where we are. The May unemployment rate is still the second-highest ever (at least since the Great Depression). Meanwhile the U-6 “underemployment rate,*” which is arguably a better indicator of the stress in the labor market, is still over 20% (although it too fell 1.6 percentage points from April’s record level, indicating that the improvement wasn’t all down to misclassification.) The direction is what everyone wants to see, but to call this a “success” is way too much too soon.
* Total unemployed, plus all persons marginally attached to the labor force, plus total employed part-time for economic reasons, as a percent of the civilian labor force plus all persons marginally attached to the labor force
The big danger of these figures is that with unemployment falling – even as it remains at extraordinary levels – certain political parties in the US government that just can’t bear the thought of giving money to people who don’t give campaign donations will decide that further aid isn’t needed and when the current benefits run out, as they will soon, they’ll refuse to renew or increase them. Get ready for a political battle over this issue.
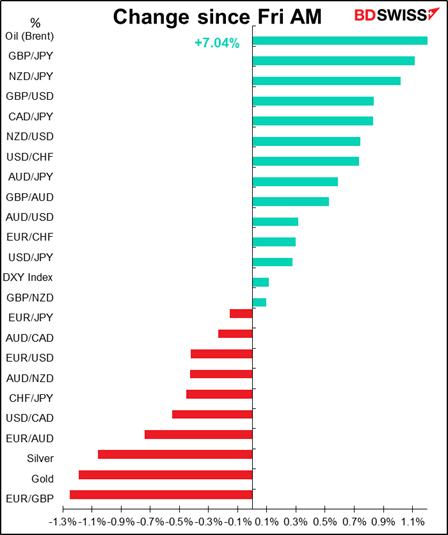
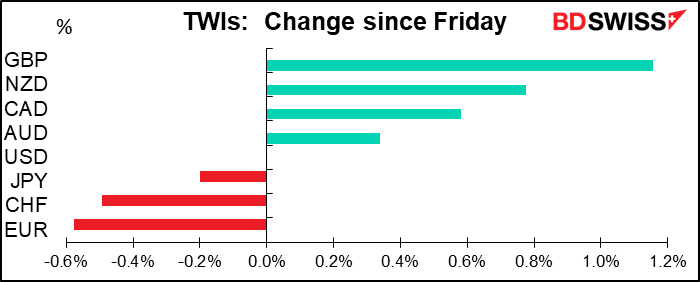
One other point to note: the astonishing NFP didn’t help the dollar very much. The DXY index was up 0.11%, while the trade-weighted USD (which is what I use in the graph above) was precisely unchanged from this time Friday morning. By contrast, CAD did gain after announcing a similarly surprising rise in the number of jobs. What this shows is that USD is trading more on overall risk sentiment than on economic fundamentals.
GBP was the best-performing currency, which I can’t understand at all. The Brexit talks have made minimal progress and ended Friday deadlocked after five rounds of negotiations. The two sides remain far apart, with the EU accusing the UK of backtracking on prior commitments made in the political declaration. Progress now depends on getting some new direction from leaders. PM Johnson will have to get involved. If the past is any guide, he’ll eventually cave to EU demands, but it will take some time.
The withdrawal agreement says the transition period can be extended for one or two years if both parties agree by 1 July. However, extension requires the UK to make an appropriate financial contribution and continue following EU rules. I’m not sure how well that would go over in London. So far the UK government has insisted that Brexit will happen on schedule (1 January 2021) and has refused to consider extending the transition period. Moreover it has the political mandate and parliamentary
majority to make it happens.
My guess is that people are ignoring Brexit entirely and simply buying assets that have fallen as risk appetite comes back. The pound was pretty beaten down, hence people looking for bargains might be interested. Either that, or they assume that on past form Johnson will eventually cave in and there will be an agreement.
(Word for the day: resile = to abandon a position or a course of action. You may encounter this word while reading about the negotiations. I did for the first time today.)
OPEC, Russia and a few other oil producers – the OPEC+ group – Saturday agreed to extend their 9.7mn barrel-a-day cuts by one month, to end-July. Saudi Arabia and Russia will continue to be responsible for most of the output reductions. The price of the agreement was that the other OPEC members had to promise to comply with their (reduced) output quotas better. We’ll see if that happens.
After the agreement ends, the group will increase production by around 2mn b/d, or looked at another way, taper their cuts to 7.7mn b/d. The reason for the slow return to normal production is that Russia wants the oil price to stay low enough to keep US shale producers out of business.
Oil prices rose sharply on the news, continuing its recent rally. That helped the commodity currencies to gain, along with the general risk-on mood. I think this rally has gone far enough for now. The market knew the extension was likely. I think there may well be some profit-taking later in the day, to the detriment of CAD as well.
Data overnight:
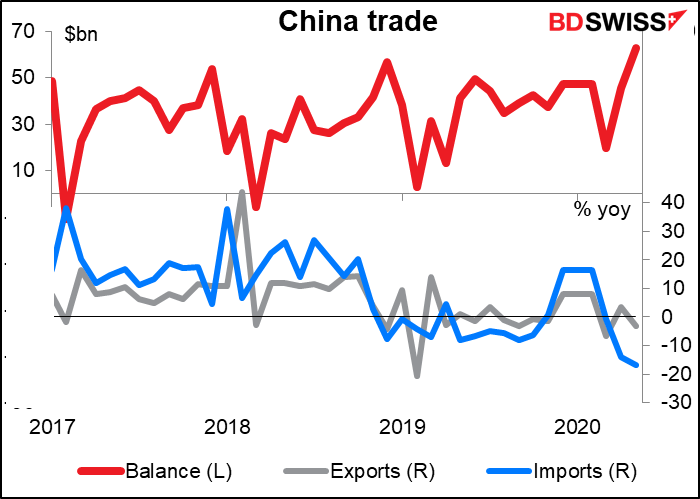
China trade surplus hit a record as imports fell and exports fell less than expected, helped by an increase in medical-related sales. I will refrain from commenting.
I lack the data to evaluate whether the fall in imports is due to lower volumes or lower prices of commodities. That’s an important distinction in evaluating the impact of lower Chinese imports on other countries.
Japan’s Q1 GDP was revised up to a contraction of -2.2% qoq SAAR from an earlier estimate of -3.4%, thanks to higher-than-expecetd business investment. But although the figures are labeled as “final,” there’s hardly any such thing in the Japanese GDP data. They will be revised again at the end of the fiscal year when the final tax figures come in, and then about two years later when more data is finally available. This time the figures are already suspect because the business investment survey was distorted by a low response rate thanks to the pandemic.
In any case, JPY is largely detached from the performance of Japan’s economy. With a zero-interest-rate policy and yield curve control, Japanese interest rates are not going to respond to anything for now. The currency moves much more in response to global risk sentiment than to anything having to od with the Japanese economy.
Commitments of Traders Report
Specs continued to move out of USD. Long EUR positions, already high, rose further. Short CAD and NZD positions were closed out a bit. Long DXYs cut substantially.
The overall long currency/short USD position would have increased more except for a substantial increase in short GBP positions. The amount by which short GBPs increased was almost the same as the amount that long EURs rose, making me think that specs are particularly bullish EUR/GBP. That seems like a reasonable call to me; GBP seems like a fundamental short because of Brexit concerns and the country’s poor record in dealing with the COVID-19 virus, but with USD weakening as well, EUR/GBP may be the better way to play GBP weakness.
Specs cut longs in JPY but increased longs in CHF.
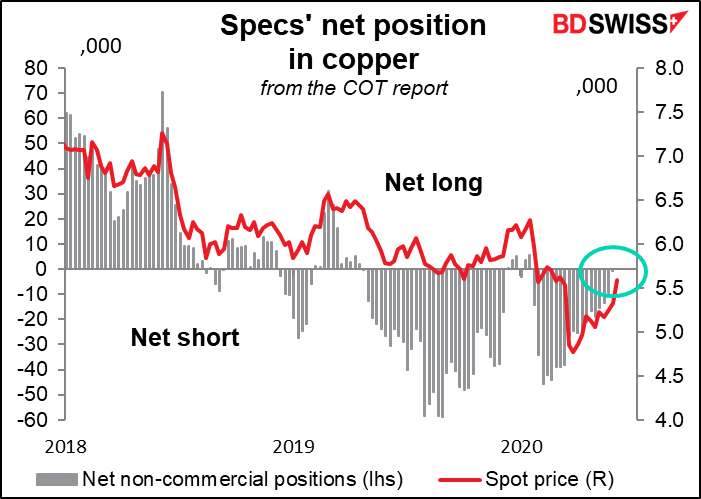
Specs have almost reduced their net short position in copper to nothing. This is an indicator of optimism about the global economy. Similarly, they increased their net shorts in US Treasuries, although that may have more to do with hedging future issuance than a view on the economy.

Today’s market
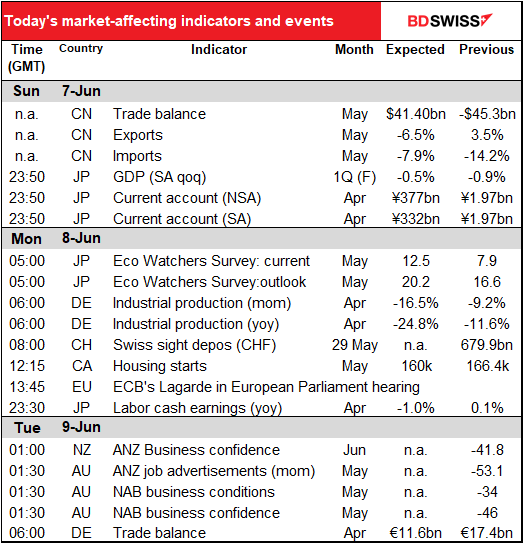
Most of the day’s news is already over!
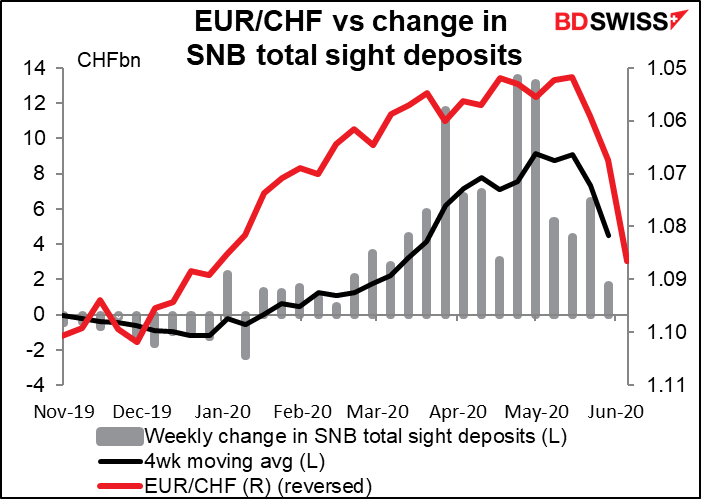
The Swiss National Bank (SNB) intervened significantly less in the week ended May 29th, yet EUR/CHF continued to rise. As I pointed out last week this is due more to EUR strength than CHF weakness. As long as EUR keeps rising, SNB will see less and less need to intervene.
Canada’s housing starts plunged in April and are expected to be even lower in May, but you can hardly blame them, can you?

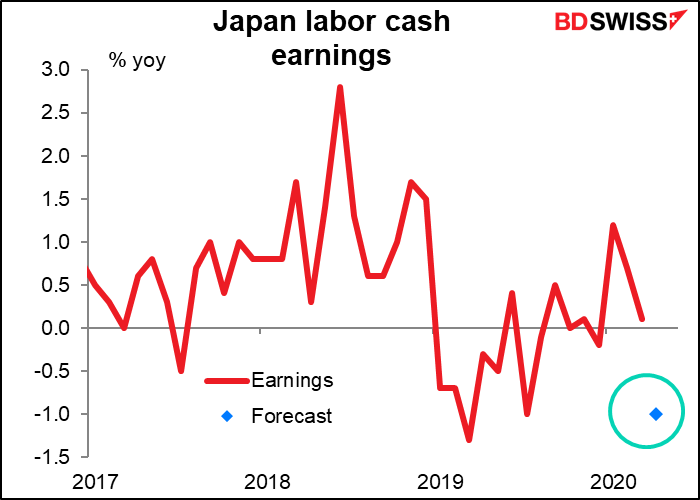
Overnight, Japan’s labor cash earnings are expected to show a steep decline and fall from a year earlier. I promised last month that I would stop nattering on about this indicator, which doesn’t affect the market very much, but I can’t help but note the contrast between this and the US average hourly earnings, which has been soaring recently as lower-paid people lose their jobs faster than higher-paid people, thereby pushing up the average. This forecast looks odd to me especially because other data shows that companies in Japan have responded to the virus by cutting back on part-time workers first, which should in theory boost average earnings, I’d guess. Maybe this is yet another reason why this indicator isn’t worth watching.
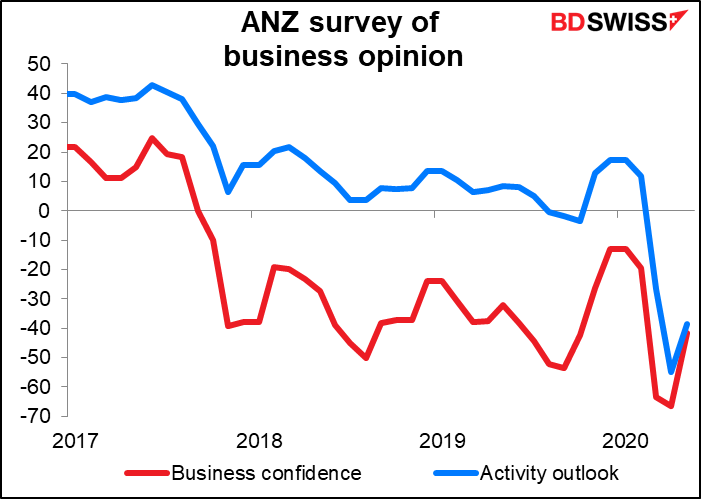
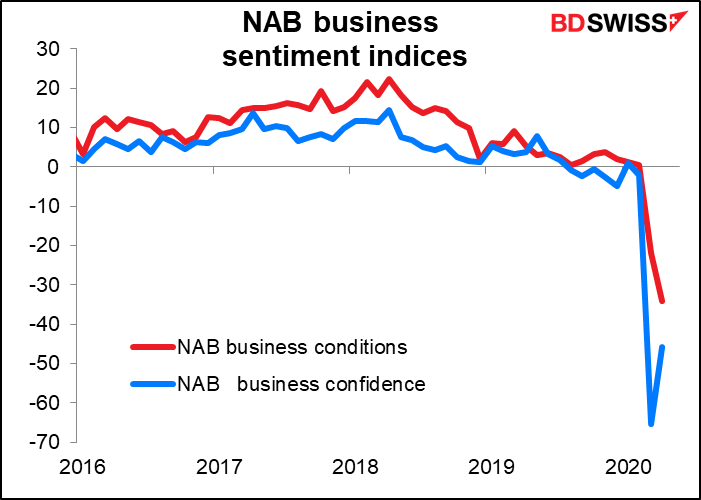
No forecasts for the ANZ and NAB figures, but I’’ll include graphs just so you can see the trend and evaluate the data after it comes out.

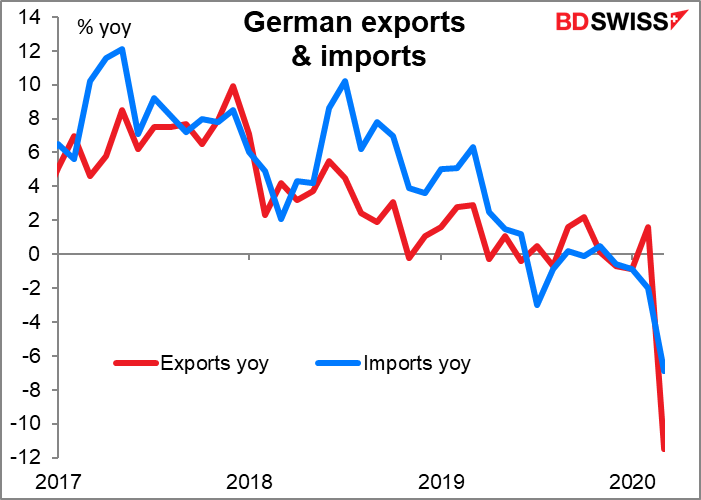
Then Tuesday morning, before I can fight the traffic to get into my office, Germany announces its trade figures for April. The country’s trade surplus is expected to drop sharply.

That’s because exports are plunging (no forecast available).
