I’ve often complained that the markets nowadays are too simple. There used to be a lot more currencies and a lot more idiosyncratic stories behind each currency’s movements. For example, I remember drama in the DEM/FRF cross when they were locked together in the ERM: one time FRF one-week interest rates got up to over 5,000% as the Banque de France fought speculation about a devaluation. Now the whole G10 currency world comes down to a binary decision between “State A” or “State B,” “risk on” or “risk off.”
It’s especially so since the entire human race has fallen into a crisis that most of us had never dreamed we’d encounter outside of a movie theater. There are too many government and central bank programs to keep track of and too many conflicting statistics on the medical front, a subject that none of us who’ve spent our careers following financial markets really understand anyway. So the only way human beings can cope with the markets with our limited mental bandwidth is to apply a few rules that we’ve learned from our experience, which may or may not even be relevant in this totally new economic environment. Optimistic? Buy commodity currencies. Worried? Buy JPY or CHF. Can’t decide? Buy USD.
AUD/JPY has long been the FX market’s barometer for risk. AUD is strongly affected by Australia’s terms of trade, which depend on commodity prices. And commodity prices naturally tend to be sensitive to the global economic cycle.
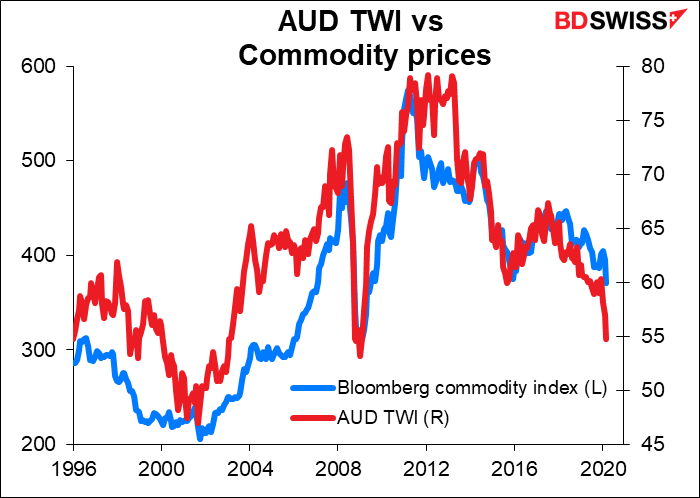
Meanwhile, JPY tends to move depreciate when the global economy is good, because Japan is the Mother of All Financial Repression and Japanese investors put their money abroad whenever they feel confident about it. But when they get nervous, either about their domestic market or overseas, they tend to hedge their overseas investments. It’s that hedging behavior, not any inherent stability of the Japanese economy, that gives JPY its “safe haven” characteristic. (On the contrary, the Japanese economy has often been described as “a bug in search of a windshield,” but so far the long-awaited crash hasn’t come.)
You can see the uncanny long-term correlation between that currency pair and the price of the US iShares iBoxx High Yield corporate bond ETF, an investment vehicle that has nothing to do with either Australia nor Japan. Rather, demand for high-yielding bonds is related to investors’ willingness to tolerate risk, which of course is affected by their view on the US economy and the global economy. That sentiment will also impact AUD and JPY.

The recent correlation between the US stock market and AUD/JPY is almost uncanny. (Inquisitive readers may ask, what about AUD/JPY vs the domestic Australian stock market? Answer: The path of the Australian stock market is virtually the same as the S&P 500.)

This relationship could come in useful if one of the data series were to move reliably in advance of the other. For example, looking at the AUD/JPY relationship over the last two years, perhaps investors in US high yield might have shown more caution if they had paid attention to the warning from the FX market, which turned out to be correct.

(In fact that would never happen, because any fund manager who underperformed the market for a year while telling his or her boss “no, I can’t buy these bonds because AUD/JPY keeps moving lower” would’ve lost their job well before they were proved correct. Fund managers are naturally more concerned about career risk than they are about market risk.)
I think these relationships are particularly important now, because the FX market is the most important free & fair market left in the financial world. Among developed markets, CHF is the only currency that we know of that has regular, direct intervention by the central bank, and we’re talking about a country of only 8.6mn people plus a whole lot of cows.
On the other hand, most (all?) of the G10 central banks already announced some form of intervention to support (aka control) their domestic bond market in addition to their usual money market operations. These interventions often extend to corporate bonds as well, even those that have suffered downgrades to below-investment-grade, as in the US. Interventions in the stock market are so far only indirect – except for Japan, most central banks aren’t buying equities — but both the monetary and fiscal authorities are jumping in to help companies. US airline stocks may be down 57% from the beginning of the year, but at least they’ve stabilized there. I doubt if they would even be trading any more if it weren’t for government aid.

Note that I’m not saying the government’s actions are wrong. This is not a typical crisis brought on by speculation or “irrational exuberance” or central bank tightening – it’s more like a hurricane or other natural disaster. It’s normal for a government not to allow its economy to be wiped out and its people left starving by such an event.
Nonetheless, with markets under government control – with “financial repression” the operating principle – it makes it difficult for us to know exactly what investors are thinking. In the financial market as well as the medical world we lack tests. AUD/JPY is one of the best tests left in the financial world. I would recommend that anyone investing in stocks or bonds keep an eye on it to see what it says about the outlook.
In that respect, I tried to see whether AUD/JPY led stocks or whether stocks led AUD/JPY. The statistical technique used to do this is called a Granger causality test. I won’t bore you with the details of the math (largely because I don’t understand them myself) but in short, the Granger causality test determines whether one time series is useful in forecasting another. In this case, I found much to my surprise that over the last two years, the S&P 500 index did indeed “Granger cause” AUD/JPY on a day-to-day basis, but at the same time, AUD/JPY also “Granger caused” the S&P 500! So it’s impossible to say in this case which direction the causality runs – it seems to run in both directions.
As for the high yield bond fund, I was surprised that on a weekly basis, the bond fund Granger caused AUD/JPY but AUD/JPY did not Granger cause the bond fund. That result held for both the last ten years and the last two, even though it appears that the two went their separate way during 2019. Using daily changes, the results are much the same as with the S&P 500: both variables Granger cause the other.
The relationship can be useful now though since one of those variables, AUD/JPY, is pretty much free-floating while the other two are subject to financial repression. Investors in stocks and bonds should be watching the FX market for an idea of what investors really think. At the moment, the conclusion must be: they’re cautiously optimistic, with an emphasis on the word “cautious.”
Upward pressure on USD may be peaking
The dollar has had a good run during this crash. While normally it’s not that closely correlated with the day-to-day vicissitudes of the stock market, it certainly has been closely correlated with the “risk off” trade recently, for reasons that we’ve discussed at length before.
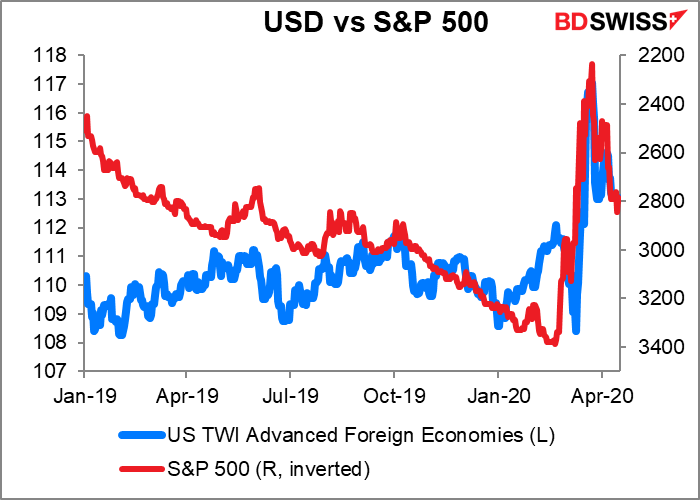
However, the Fed has been flooding the market with dollars, first and foremost through its swap arrangements with other central banks, which now reach some $400bn outstanding. This not only provides dollars for the market, but also frees up banks’ balance sheets so that they can lend more money through the FX swap market.

The Fed has also undertaken other highly technical operations to supply dollars to the market by fiddling with the definitions of required ratios so that certain banks can increase their swap books. (Trust me, you don’t want to know the details – but if for some reason you’re curious, check out this report by Credit Suisse’s “Repo Oracle,” Zoltan Pozsar.) Also certain other ratios have been relaxed as well to allow primary dealers in the Treasury market to finance more Treasuries for hedge funds and asset managers. All of these actions free up balance sheet and make more dollars available.
The result of these three relief measures has been to increase the flow of dollars into the FX swap market. This has caused the huge amounts that investors were paying in the FX swap market to get their hands on dollars ASAP to fade. On the contrary, the short-term basis swaps have flipped around from discounts to premiums.
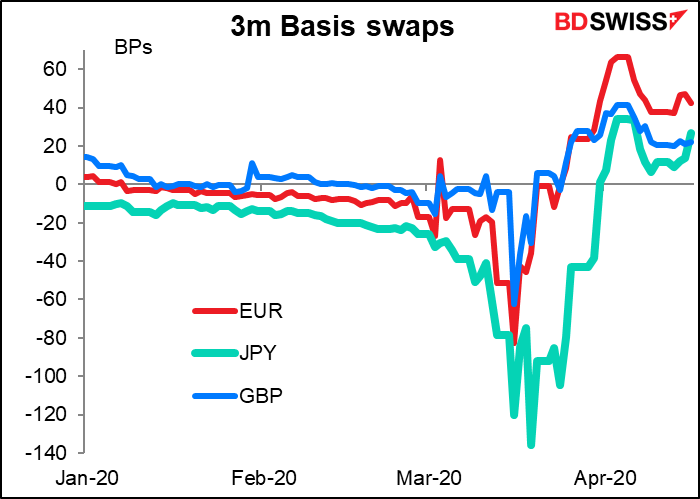
There could be trouble later on – while the short-term basis swap rates have turned positive, there is still excess demand for dollars several months from now, when those central bank swap lines will have expired. That’s particularly the case in Japan, where investors have used the dollar swap market to hedge their enormous overseas bond holdings.

But currently, it appears that the Torschlusspanik that sent the dollar surging has abated for now. In its place I think horror at the Trump regime’s efforts to reopen the US economy while the virus is still raging is likely to dampen sentiment for the dollar as investors see the US stock market resume its fall.
Indicators next week: PMIs, several UK indicators, inflation data
There are no central bank meetings and only one central bank governor’s speech (RBA Gov. Lowe on Tuesday). No Fed presidents speaking as they’re in the “purdah” period before the next FOMC meeting.
The main event of the week is likely to be the EU summit on Thursday. At their conference on 26 March, the European Council asked for an action plan, which the Eurogroup of Eurozone finance ministers put together last week. Next week they’re going to hold a video conference to discuss that EUR 500bn plan and no doubt approve the package that was recommended. It consists of:
- A European Stability Mechanism (ESM) credit line for countries;
- Additional lending to businesses by the European Investment Bank (EIB); and
- And EU scheme to support workers, based on the German “Kurzarbeitergeld” or short-time working plan that pays companies to keep workers on their payroll.
In addition, there was talk of a recovery fund to support the economic rebound.
The big issue will be joint issuance of debt (aka “coronabonds”) to fund the recovery. There will also be a question of what kind of conditions can they attach to borrowing from the ESM. Too much and the Italians (the likely borrowers) will balk; too little and the Dutch and other lenders will bail.
As for the indicators, they’ll be as usual a horror story. We will watch with morbid fascination, much like looking at those dashboard cam recordings of traffic accidents that you see on YouTube – we know what’s coming, we’re just waiting for the truck to run the red light or the motorcyclist to lose control and smash into the tree. The only question is how bad the accident is, not whether it happens.
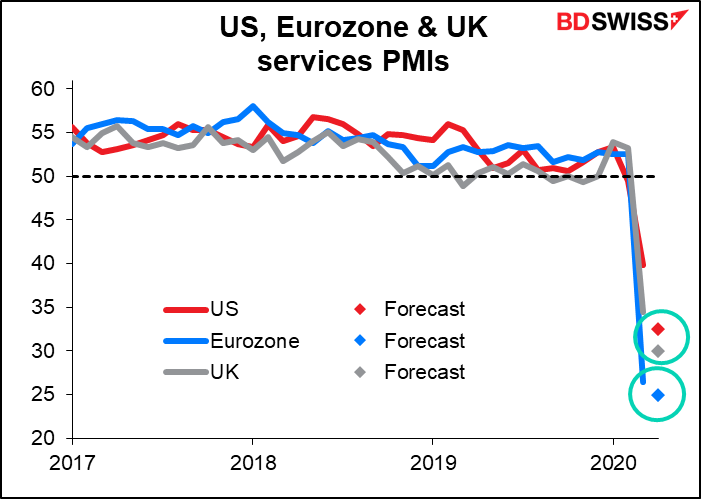
The main data of the week will be the preliminary purchasing managers’ indices (PMIs) for the major economies for April on Thursday. The service-sector PMIs collapsed last month; the market is looking for the manufacturing PMIs to follow suit this month. The exception is in the UK, where services didn’t fall as far as they did in the other countries; there the service-sector PMI is expected to decline more than the manufacturing PMI. But really, no one has a clue.


Aside from the PMIs, it’s Britain’s turn in the spotlight this week with UK employment data on Tuesday, inflation on Wednesday and retail sales on Thursday.
The employment data are for February and therefore don’t reflect the crisis. In fact, the number of employed person is forecast to rise, albeit by less than in January. This will only be of historical interest, if that.

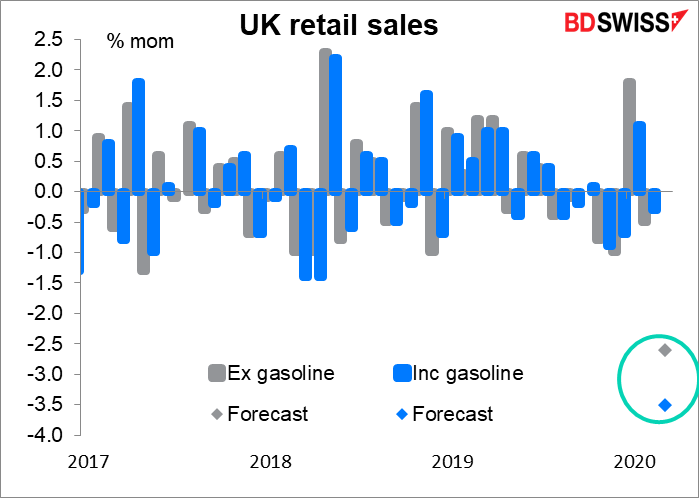
Retail sales for March are expected to show the impact of the virus. Excluding gasoline, the figure is expected to be pretty bad; including gasoline, the price of which has fallen a lot, it’s expected to almost tie the record 3.6% mom decline in January 2010 (data back to 1988).
No point discussing the UK inflation data on Wednesday, or for that matter the Canadian inflation data later that day or the Japanese inflation data on Friday. Usually these would be the big indicators of the week, but the fact is that central banks just aren’t worried about inflation at the moment. Furthermore, prices are relatively sticky, so they won’t immediately reflect the new environment. In short, the inflation data isn’t that significant right now.
Also for the US we get durable goods orders for March on Friday. It’s expected to show a sizeable (-10%) mom drop, but hardly a record fall for this volatile survey. (Record mom decline = -18.4% in August 2014.)
For Germany we get the ZEW survey on Tuesday and the Ifo survey on Friday. Need you ask?


