Previous Trading Day’s Events (21 Feb 2024)
“The market was poised to sell the news following Nvidia’s earnings, given the sky-high expectations and deteriorating macro conditions,” Investing.com analyst Thomas Monteiro said. “However, once again, the company left no doubt that the AI boom is much more than just a stock market narrative, but rather, the most significant bet from corporations worldwide at this moment.”
The late-day stock jump pushed up the shares of other AI-related companies including chip designer Arm Holdings. Nvidia and other hardware suppliers linked to AI computing added $160 billion of combined stock market value.
Source:
______________________________________________________________________
Winners vs Losers
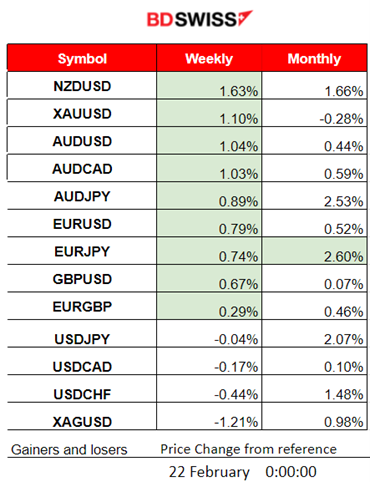
NZDUSD continues to lead with 1.63% gains for the week followed by GOLD with 1.10%. All USD pairs (USD as Quote) climb due to depreciation. This month EURJPY is leading now with 2.60% gains.
 ______________________________________________________________________
News Reports Monitor – Previous Trading Day (21 Feb 2024)
Server Time / Timezone EEST (UTC+02:00)

- Midnight – Night Session (Asian)
The seasonally adjusted WPI rose 0.9% for the December quarter of 2023 and 4.2% over the year. No major impact was recorded in the market.
- Morning – Day Session (European and N. American Session)
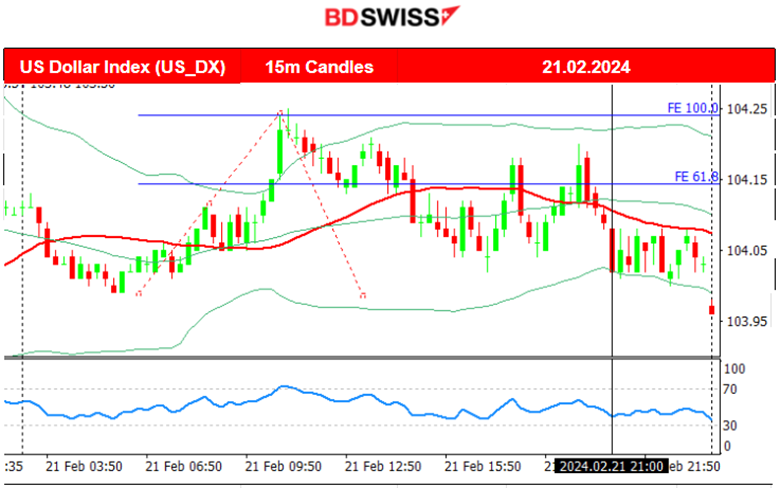
The FOMC Meeting Minutes report: apparent was the need to see more progress that inflation is going towards the 2% target before proceeding to rate cuts. Inflation risks are still considered dangerous. Downside risks of rates staying too high, was the main concern of some officials. During that time of the release, there was no major impact on the market. The dollar suffered a slight depreciation. Today is another story, the dollar plunged.
General Verdict:
 ____________________________________________________________________
FOREX MARKETS MONITOR
EURUSD (21.02.2024) 15m Chart Summary
Server Time / Timezone EEST (UTC+02:00)
Price Movement
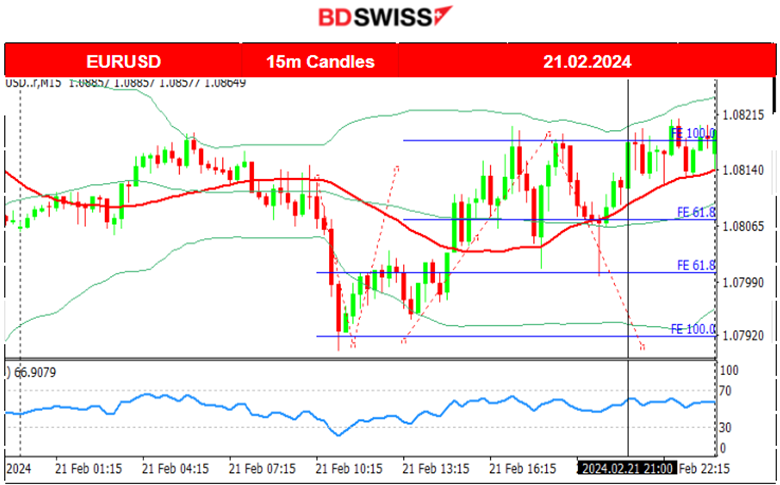
During the Asian session, the pair was moving around the 30-period MA but at the start of the European session, it dived to the support near 1.07920 since the dollar appreciated greatly. Retracement followed back to the 61.8 Fibo level. It later continued further to the upside crossing the MA on its way up completing a reversal, reaching the resistance at near 1.08190. A retracement back to the 61.8 Fibo level followed. After the FOMC Meeting Minutes report release, the path continued to the upside. Today the USD depreciates heavily pushing the EURUSD further upwards.
 ___________________________________________________________________
CRYPTO MARKETS MONITOR
BTCUSD (Bitcoin) Chart Summary
Server Time / Timezone EEST (UTC+02:00)
Price Movement
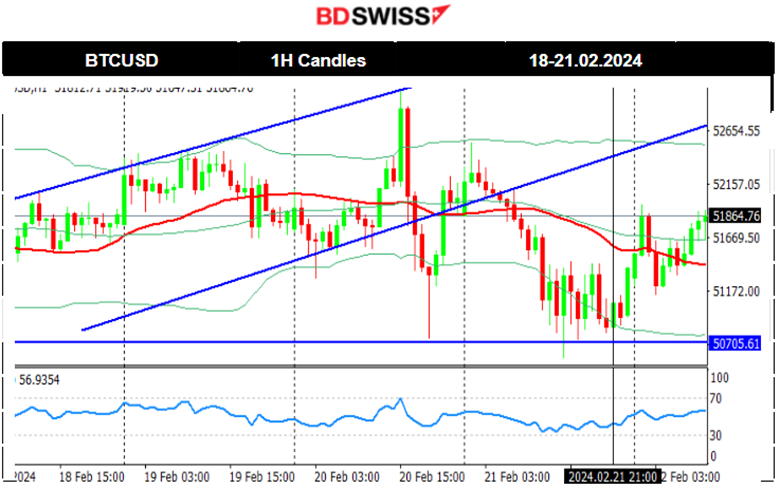
On the 19th Feb, Bitcoin broke the wedge and moved rapidly to the downside, under the 30-period MA, confirming the bearish signals from the RSI (lower highs). On the 20th Feb, Bitcoin experienced a shock during the trading day causing it to jump to the resistance near 53,000 USD, before reversing quickly to the MA crossing it on the way down and finding support near 50,750 USD. It soon retraced to the MA settling close to 51,900 USD. On the 21st Feb, Bitcoin saw a big drop and after testing the support near 50,700 USD multiple times, it reversed to the 30-period MA.
 Crypto sorted by Highest Market Cap:
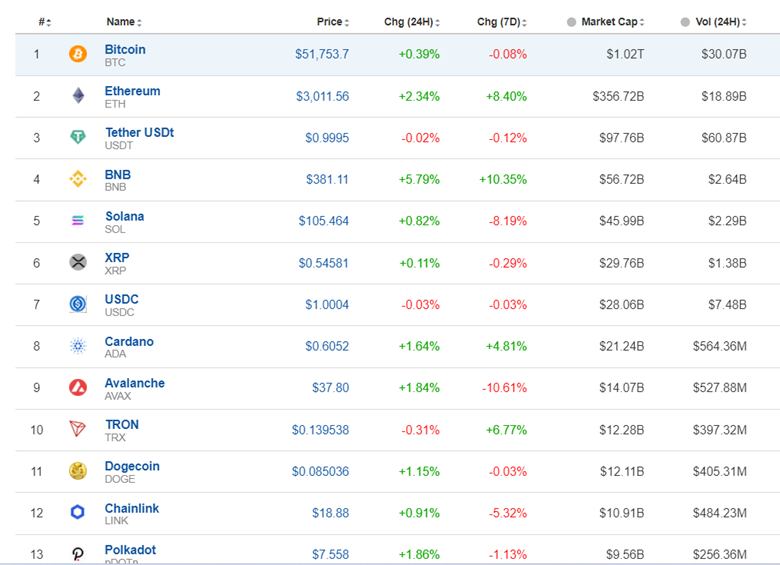
A short-term downturn for the Crypto market continues but the market remains stable, showing signs of downside resilience.
Source: https://www.investing.com/crypto/currencies
______________________________________________________________________
EQUITY MARKETS MONITOR
NAS100 (NDX) 4-Day Chart Summary
Server Time / Timezone EEST (UTC+02:00)
Price Movement
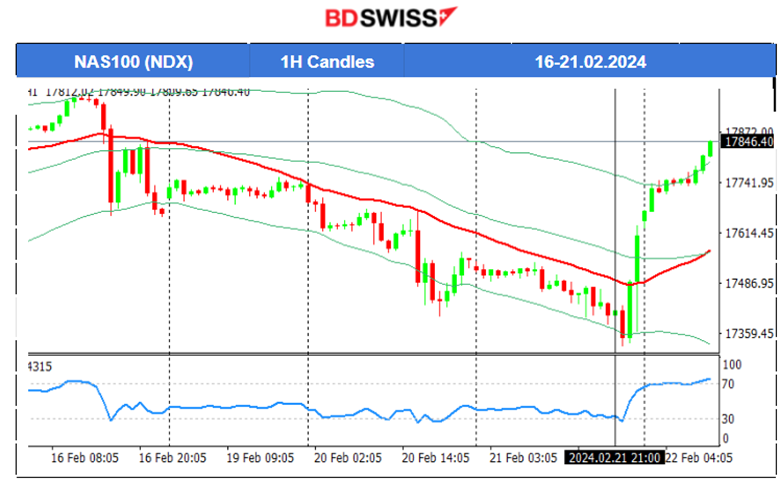
On the 19th Feb, the market remained sideways experiencing very low volatility due to the closed stock exchange. However, the next day the market opened with a downward path breaking important support levels. A clear downtrend for now as the index remains below the 30-period MA. Global stocks rallied and after 22:00 yesterday, all U.S. indices are still experiencing a big jump to the upside. The tech-heavy Nasdaq 100 index jumped 1.8% The boss of Nvidia said artificial intelligence (AI) is at a “tipping point” as it announced record sales. It reported that revenues surged by 265% in the three months to 28 January, compared to a year earlier. Obviously, volatility is sky-high for now, however, the slowdown is expected to happen soon and retracements will follow.
 ______________________________________________________________________
COMMODITIES MARKETS MONITOR
USOIL (WTI) 4-Day Chart Summary
Server Time / Timezone EEST (UTC+02:00)
Price Movement
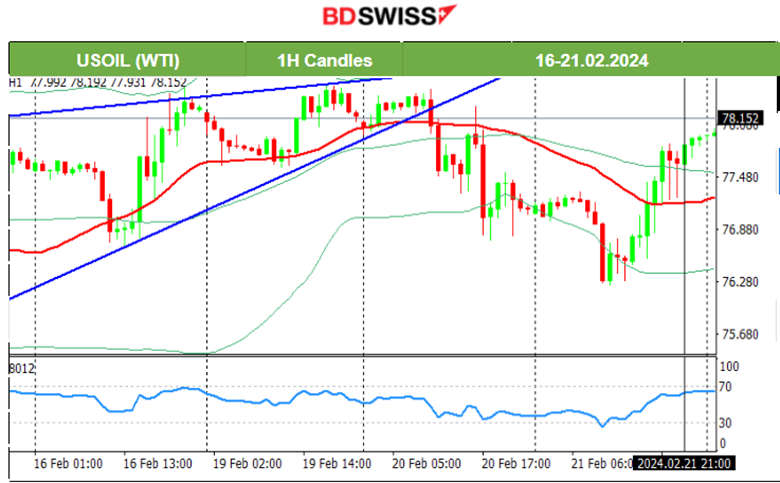
On the 16th Feb, the price moved to the upside reaching the resistance at 78.50 USD/b. Crude oil formed a triangle formation and a triangle breakout to the downside took place on the 20th Feb causing a huge drop. On the 21st the price continued with the drop but stopped when it reached the support near the 76.20 USD/b level. It soon reversed to the upside heavily, crossing the 30-period MA on its way up and reaching above 78 USD/b.
 XAUUSD (Gold) 4-Day Chart Summary
Server Time / Timezone EEST (UTC+02:00)
Price Movement
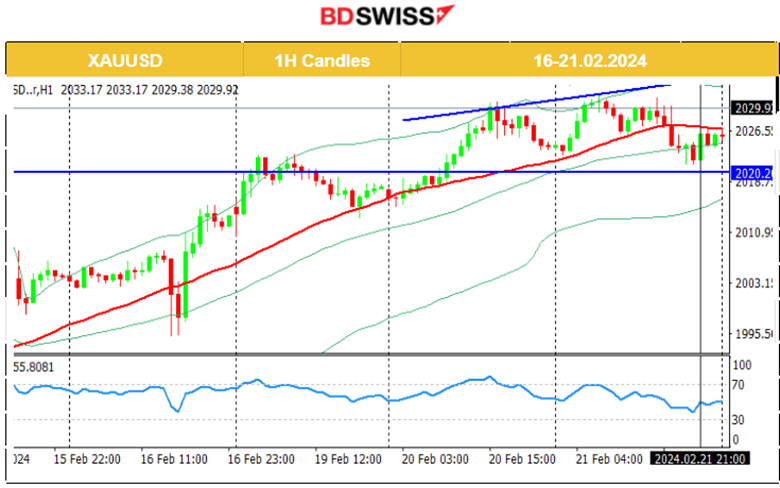
Since the 15th Feb, Gold’s price is correcting from the drop caused by the recent U.S. inflation report. On the 16th Feb, the price dropped after the PPI news and USD appreciation, reaching support at near 1995 USD/oz before reversing to the upside. The USD currently experiences weakness and is one major factor that pushes Gold’s price more to the upside. The bearish signals (RSI lower highs) in place were indicating a drop. The divergence eventually led to a drop back to 2020 USD/oz on the 21st Feb as stated in our previous analysis. After the drop, Gold reversed to the upside as the dollar depreciated heavily.
 ______________________________________________________________
News Reports Monitor – Today Trading Day (22 Feb 2024)
Server Time / Timezone EEST (UTC+02:00)
- Midnight – Night Session (Asian)
No important announcements, no special scheduled releases.
- Morning – Day Session (European and N. American Session)
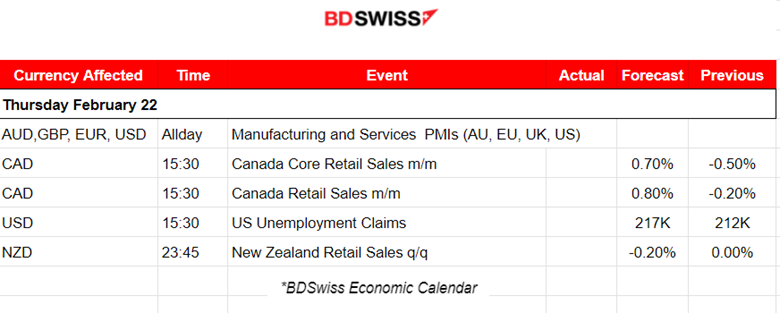
The Canada’s Retail Sales report release will take place at 15:30. The figures are expected to be reported higher. Growth instead of declines indicates that the market expects that in December there was more activity and more demand. The market could see more volatility during that time again affecting the CAD pairs.
Unemployment Claims for the U.S. will be released as well during that time. A possible impact on the USD and higher volatility. However, the effect is not expected to last as claims tend to remain just above 200K for now.
General Verdict:
______________________________________________________________


