

Previous Trading Day’s Events (20 Feb 2024)
The Bank of Canada’s next policy announcement is March 6, and expectations are that rates will stay on hold at a 22-year high of 5%. Analysts polled by Reuters had forecast inflation to tick down to 3.3% from 3.4% in December.
The Bank of Canada targets inflation at 2%. Two of its three core measures of underlying inflation also edged down. CPI-median slowed to 3.3%, the lowest since November 2021, while CPI-trim decreased to 3.4%, the lowest since August 2021.
“The key takeaway here is that the Bank of Canada can seriously consider cutting rates,” Doug Porter, chief economist at BMO Capital Markets.
“The Bank of Canada will likely remain cautious in the face of still-strong wage gains, firm services prices, and the reality that core inflation is still holding above 3%,” said Porter from BMO.
______________________________________________________________________
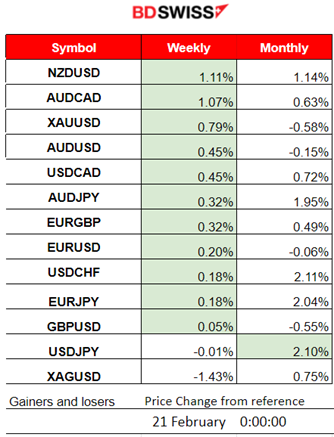
Winners vs Losers
NZDUSD climbed to the top with 1.11% performance this week followed by the AUDCAD with 1.07% performance. USDJPY remains the leader for the month with 2.10% gains.
 ______________________________________________________________________
News Reports Monitor – Previous Trading Day (20 Feb 2024)
Server Time / Timezone EEST (UTC+02:00)
- Midnight – Night Session (Asian)
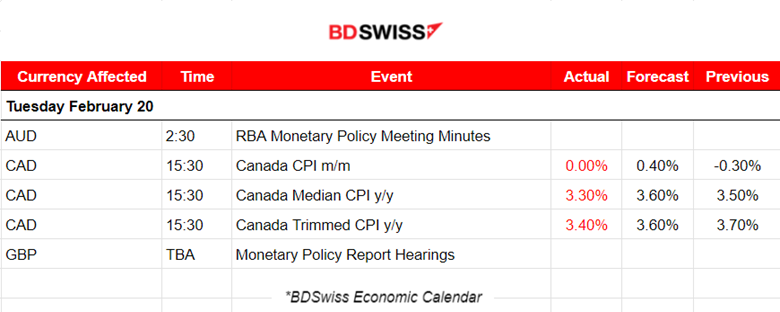
At 2:30 some volatility was recorded for AUD pairs as the RBA Monetary Policy Meeting Minutes release took place. RBA Minutes: The board considered an interest-rate hike, and saw the pause case as stronger though. They needed ‘Some Time’ to be certain of an inflation decline.
- Morning – Day Session (European and N. American Session)
The January CPI figures for Canada were reported lower than expected, raising the odds of a rate cut at the Bank of Canada happening as early as April. Lower inflation is desirable, however the data are not so strong for a continuous decline. In this case, though, the market reacted with CAD depreciation. The USDCAD jumped more than 50 pips.
General Verdict:
 ____________________________________________________________________
FOREX MARKETS MONITOR
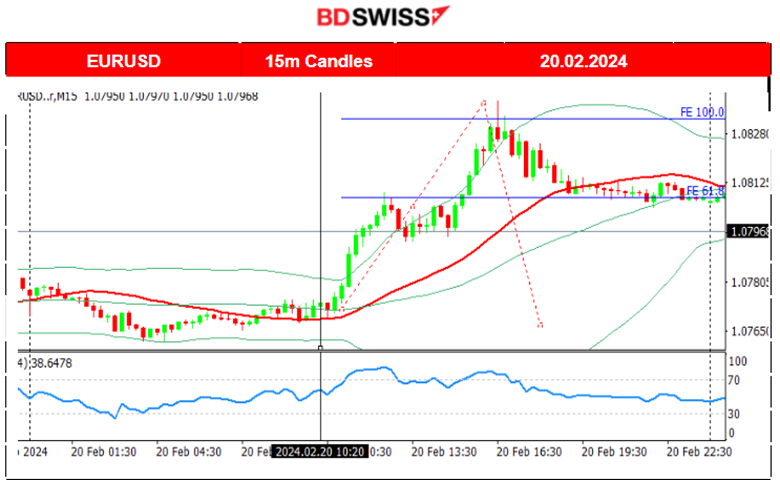
EURUSD (20.02.2024) 15m Chart Summary
Server Time / Timezone EEST (UTC+02:00)
Price Movement
The pair moved sideways around the mean with low volatility before the start of the European session. After that, it moved to the upside rapidly as the dollar started to depreciate. It reached the resistance at near 1.084 and then retraced to the 30-period MA, continuing sideways and eventually closing higher for the trading day.
 ___________________________________________________________________
CRYPTO MARKETS MONITOR
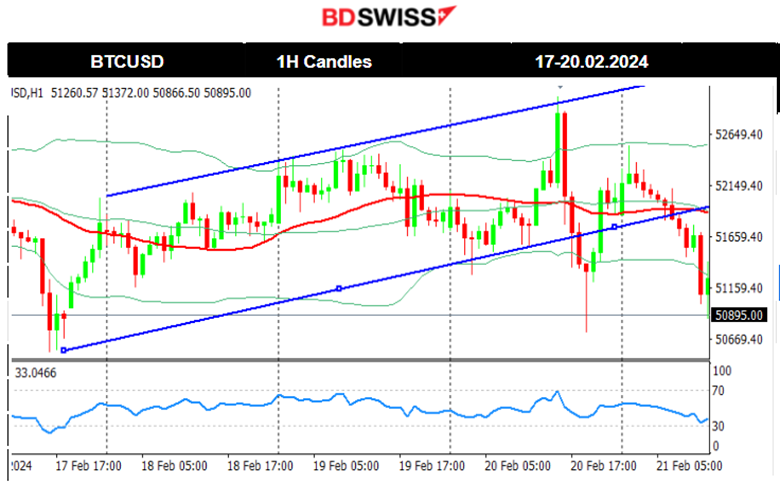
BTCUSD (Bitcoin) Chart Summary
Server Time / Timezone EEST (UTC+02:00)
Price Movement
On the 19th Feb, Bitcoin broke the wedge and moved rapidly to the downside, under the 30-period MA, confirming the bearish signals from the RSI (lower highs). On the 20th Feb Bitcoin experienced a shock during the trading day causing it to jump to the resistance near 53,000 USD, before reversing quickly to the MA crossing it on the way down and finding a support near 50,750 USD. It soon retraced to the MA settling close to 51,900 USD. Currently, Bitcoin sees a significant drop, potentially reaching 50,550 USD soon.
 Crypto sorted by Highest Market Cap:
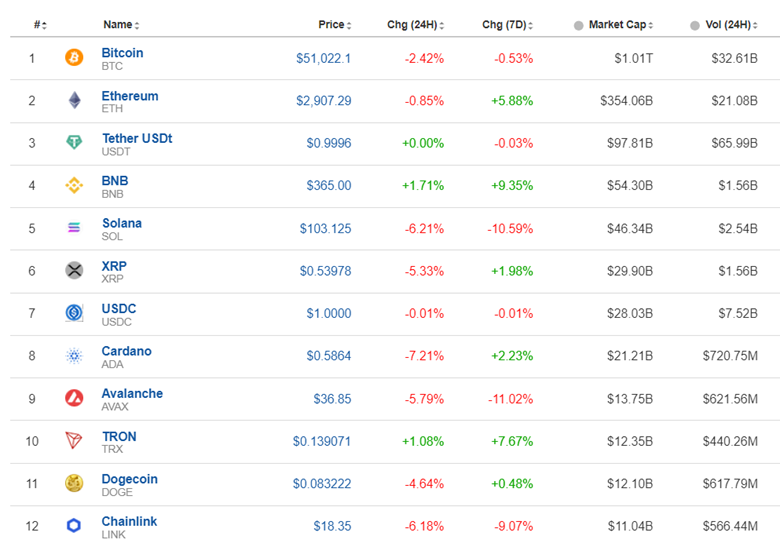
A downturn for the Crypto market as all assets experience losses in the last 24 hours. The good news is that volatility and ranging markets are something to expect during this period of time.
Source: https://www.investing.com/crypto/currencies
______________________________________________________________________
EQUITY MARKETS MONITOR
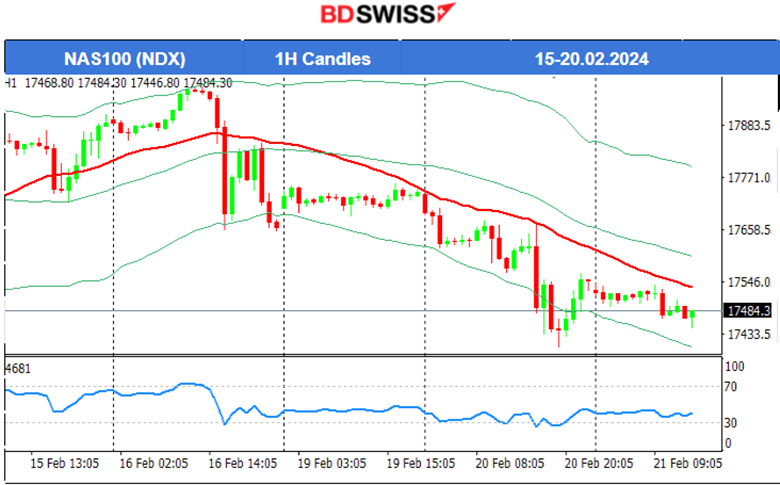
NAS100 (NDX) 4-Day Chart Summary
Server Time / Timezone EEST (UTC+02:00)
Price Movement
On the 19th Feb, the market remained sideways experiencing very low volatility due to the closed stock exchange. However, the next day the market opened with a downward path breaking important support levels. A clear downtrend for now as the index remains below the 30-period MA.
 ______________________________________________________________________
COMMODITIES MARKETS MONITOR
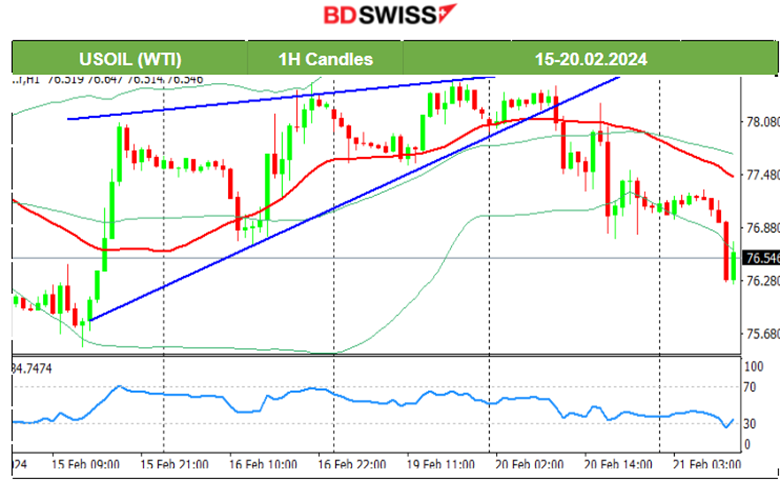
USOIL (WTI) 4-Day Chart Summary
Server Time / Timezone EEST (UTC+02:00)
Price Movement
On the 14th Feb, the release of the Crude oil inventories report at 17:30 caused a price drop that extended until the end of the trading day, about 18 USD drop. The reported figure was indeed a high number, 12M barrels, a huge Crude build. U.S. production is back at record highs. On the 15th Feb, correction took place, with the price to reverse almost fully. On the way up, Crude oil crossed the 30-period MA and reached a resistance near 78 USD/b. It soon retraced to the mean on the 16th Feb but bounced back to the upside eventually reaching the resistance at 78.50 USD/b. Crude oil formed a triangle formation and a triangle breakout to the downside took place on the 20th Feb causing a huge drop. Currently, the price is still falling but seems to have settled near 75.5 USD/b for now.
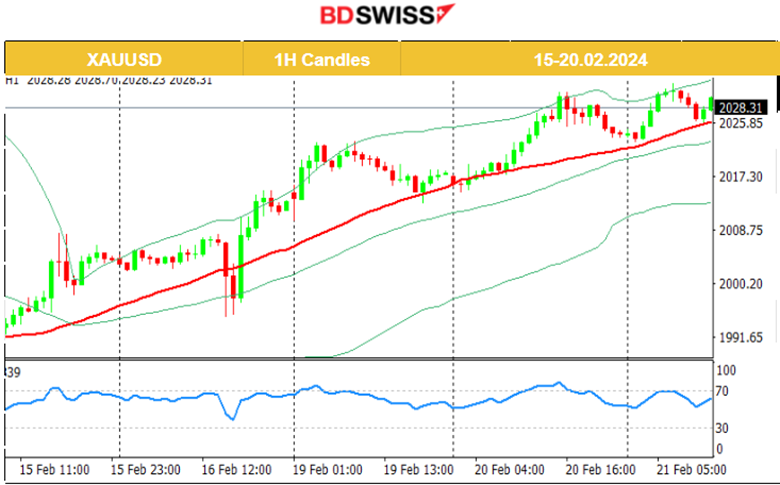
 XAUUSD (Gold) 4-Day Chart Summary
Server Time / Timezone EEST (UTC+02:00)
Price Movement
Since the 15th Feb, Gold’s price is correcting from the drop caused by the recent U.S. inflation report. On the 16th Feb, the price dropped after the PPI news and USD appreciation, reaching support at near 1995 USD/oz before reversing to the upside. The USD currently experiences weakness and is one major factor that pushes Gold’s price more to the upside. A clear uptrend for now with some bearish signals (RSI lower highs) in place. It could be the case that the RSI (lower highs) will be correct in predicting a sharp drop in Gold’s price soon. However, we need a push from the dollar (appreciation, so the dollar index has to jump/move higher). The divergence completion could lead to a drop back to 2020 USD/oz.
 ______________________________________________________________
News Reports Monitor – Today Trading Day (21 Feb 2024)
Server Time / Timezone EEST (UTC+02:00)

- Midnight – Night Session (Asian)
The seasonally adjusted WPI rose 0.9% for the December quarter of 2023 and 4.2% over the year. No major impact was recorded in the market.
- Morning – Day Session (European and N. American Session)
The FOMC Meeting Minutes report will be released at 9:00. Scheduled 8 times per year, 3 weeks after the Federal Funds Rate is announced. Some more volatility than normal is expected at that time.
General Verdict:
______________________________________________________________


