Rates as of 04:00 GMT
Market Recap
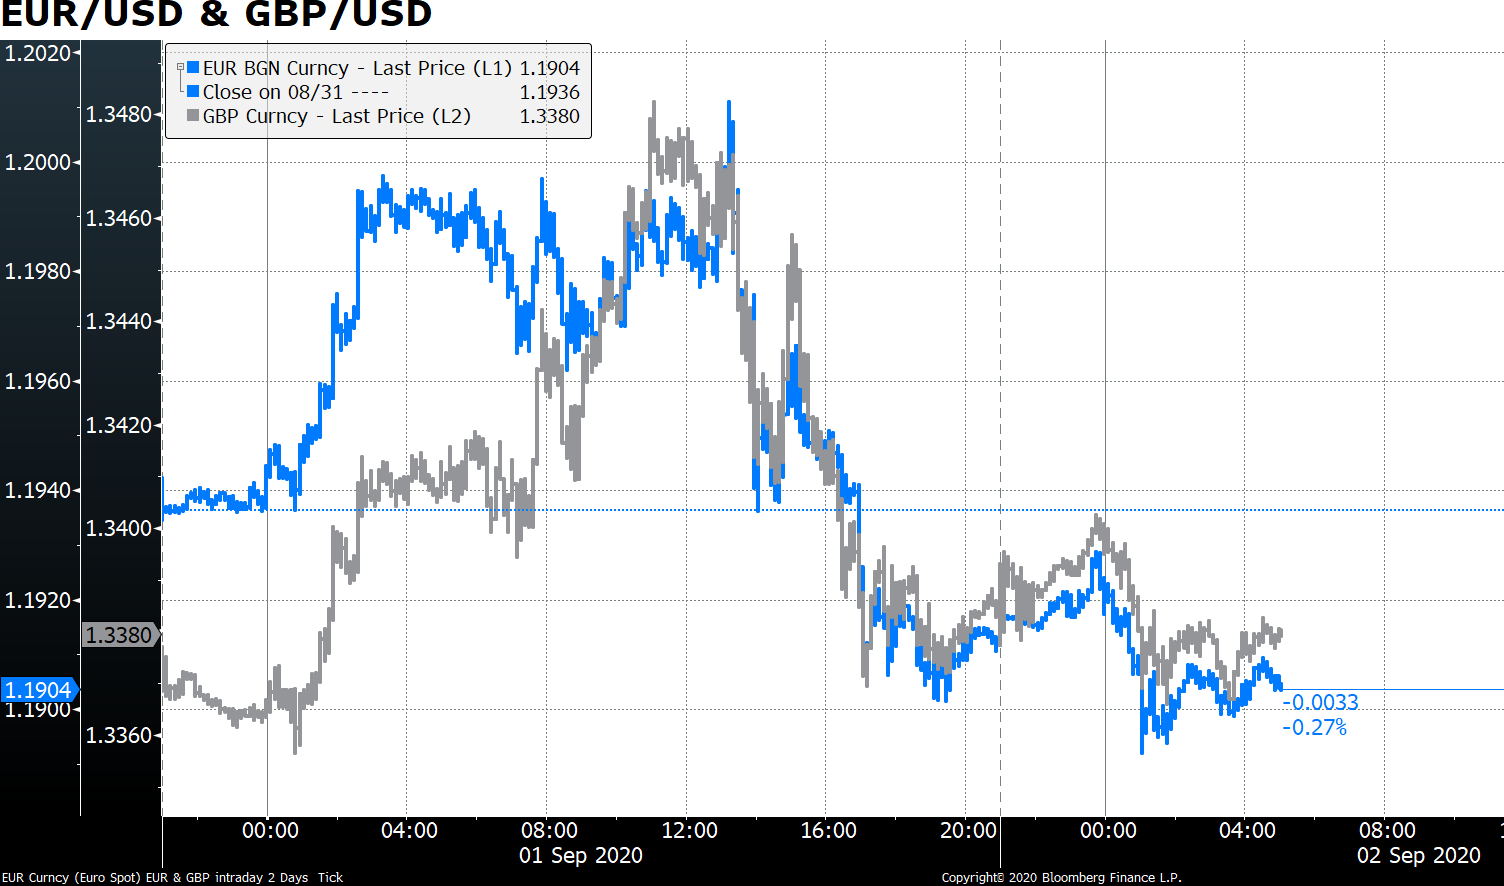
USD was looking weak when I wrote yesterday morning and it remained weak for most of the European day, but it started to recover during US trading and wound up much firmer. It’s hard to see exactly what triggered the reversal. It wasn’t the economic news; EUR/USD spiked up over 1.20 (hit a high of1.2011) at 13:14 GMT and quickly fell back, well before the ISM index came out better-than-expected at 14:00 (or before the Markit US manufacturing PMI was revised down at 13:45 GMT, for that matter). GBP/USD peaked even earlier (11:04 GMT).
It looks to me like the move was technical – GBP/USD’s failure to hit 1.35, plus EUR/USD’s failure to sustain 1.20, set off a round of profit-taking.
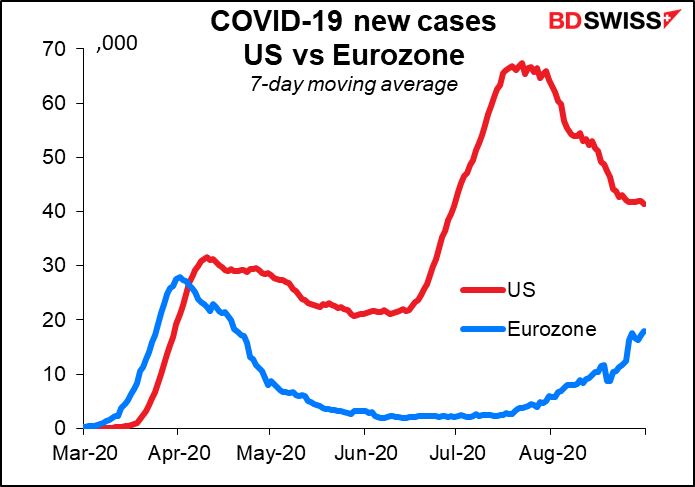
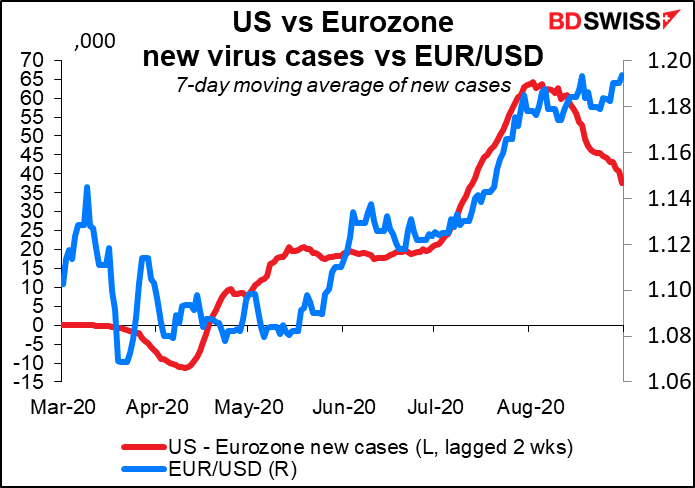
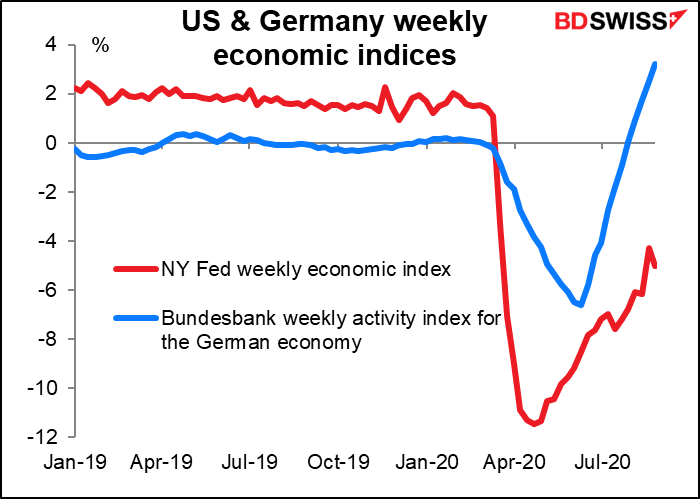
Nonetheless, Eurozone seems to be recovering faster than the US is – at least, Germany seems to be – so I expect EUR/USD to continue to move higher gradually.
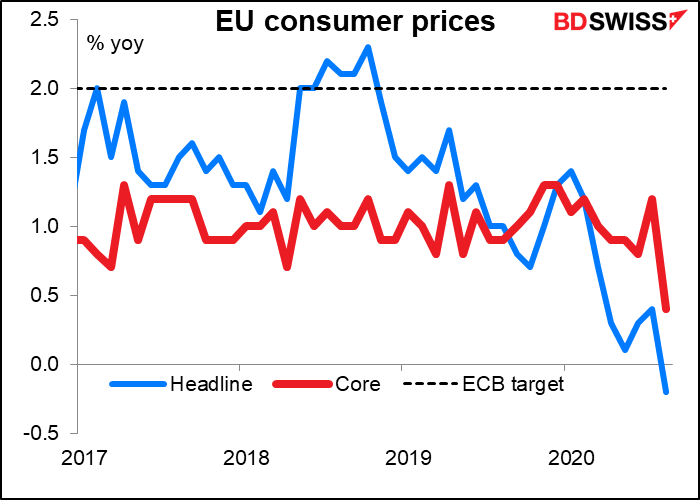
With EUR/USD hitting the 1.20 mark, we’re starting to get some official push-back. ECB Chief Economist Lane spoke yesterday and said that while the ECB doesn’t target an exchange rate, the EUR/USD rate does matter for them. It’s probably especially important after yesterday’s EU-wide inflation data showed headline EU consumer prices falling into deflation. Core prices, which are what the ECB targets, aren’t there yet but are headed that way.
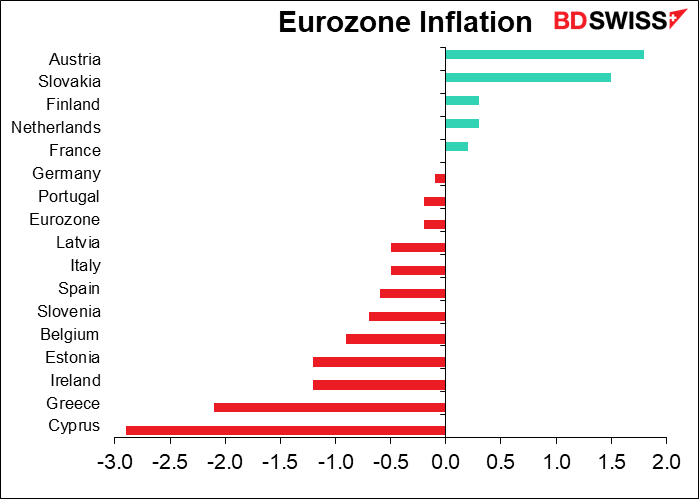
In fact, most of the Eurozone is now in deflation. Only two countries have inflation higher than 1%, much less the ECB’s target of “close to, but below, 2%.”
This of course puts the ECB in a bind, because a stronger exchange rate will only compound the deflationary pressures. We’re waiting for ECB President Lagarde to describe the euro’s rise as “brutal,” which was the code word the-then ECB President Trichet used back in 2004 when EUR/USD started getting too strong for his taste (a then-record 1.2985 at that time). He trotted out that term again in 2007 at above 1.4600.
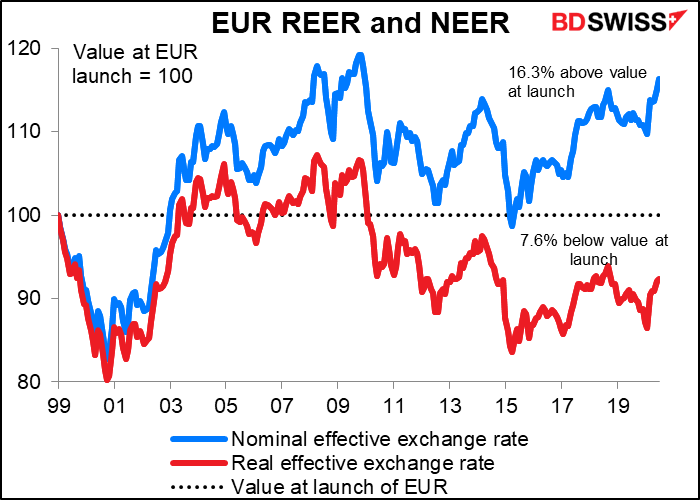
However, as I recently pointed out concerning Japanese bureaucrats’ complaints whenever USD/JPY gets around ¥105, they are looking only at the nominal value of the currency, not the real (= inflation-adjusted) value. You get a totally different picture looking at the euro’s real effective exchange rate (REER) against the bloc’s major trading partners as opposed to its nominal effective exchange rate (NEER) – the former is 7.6% below the value of the euro when it was launched in 1999, vs 16.3% above for the nominal rate (end-July data; end-August isn’t available yet). This is why I think it will be some time before the ECB starts protesting the currency. ECB jawboning shouldn’t be an obstacle for further EUR strength for some time.
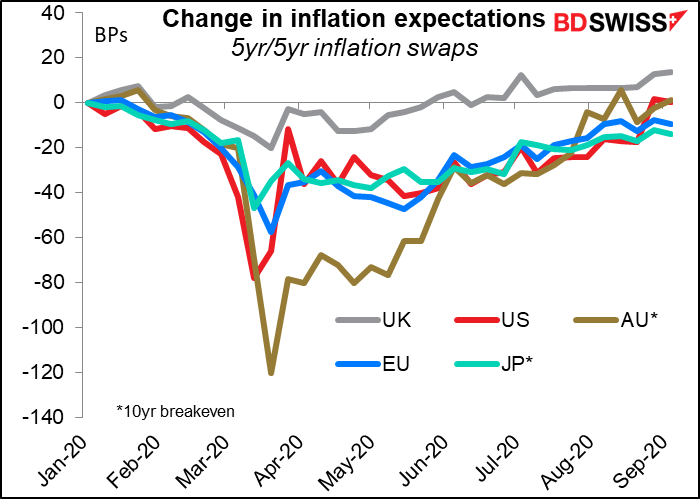
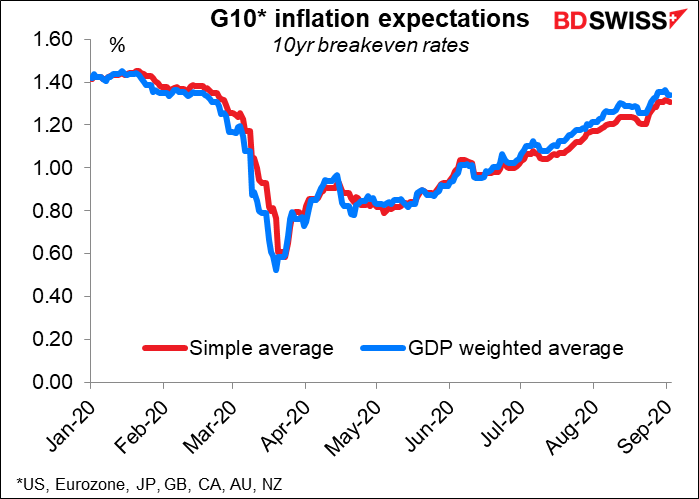
By the way, speaking of inflation, central banks’ ultra-loose monetary policies coupled with massive debt-financed reflation – the Venezuelan answer to societies’ problems – has caused inflation expectations to recover recently. This is significant because one of the main reasons why central banks fight low inflation is to prevent expectations of low inflation from becoming entrenched. For example, explaining why the Fed was switching to an average inflation targeting regime, Fed Chair Powell said in his Jackson Hole speech, “Inflation that runs below its desired level can lead to an unwelcome fall in longer-term inflation expectations, which, in turn, can pull actual inflation even lower, resulting in an adverse cycle of ever-lower inflation and inflation expectations. This dynamic is a problem because expected inflation feeds directly into the general level of interest rate.”
Signs from the market are that they are starting to worry about higher inflation across the board, not just for the US. This suggests declines in real interest rates as expected inflation rises but central banks keep nominal rates on hold. We should monitor relative inflation expectations as a guide to future currency movements.
Today’s market
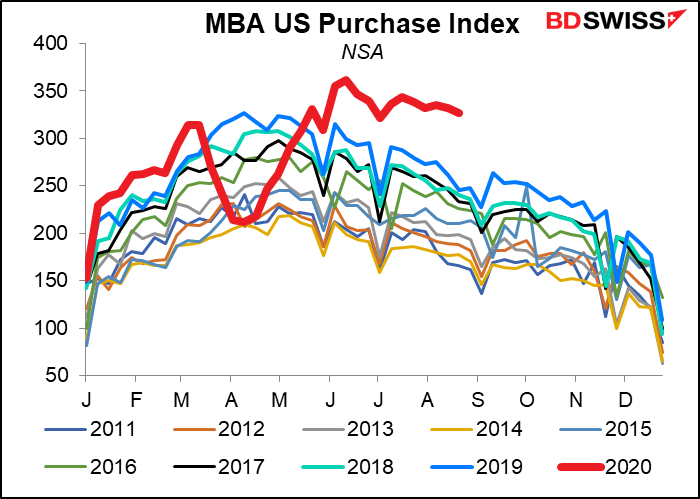
US mortgage applications are not coming down as quickly as they usually do this time of year. Strong is the force with the housing market!
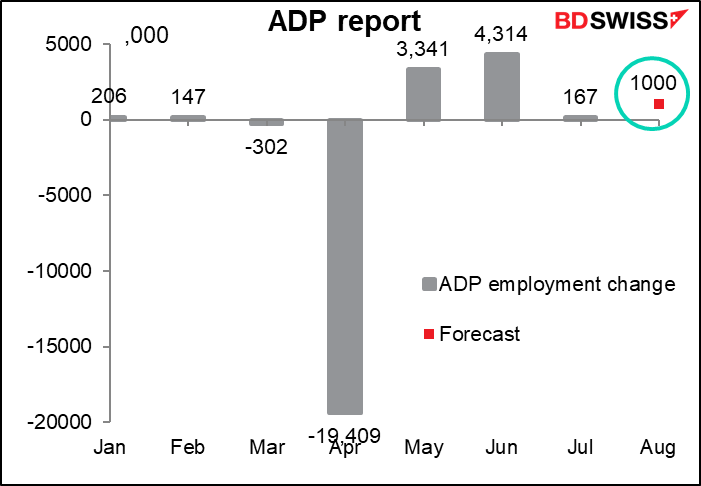
Next up is the ADP report. Automated Data Processing Inc. (ADP) is an outsourcing company that handles about one-fifth of the private payrolls in the US, so its client base is a pretty sizeable sample of the US labor market as a whole. It’s therefore watched closely to get an idea of what Friday’s US nonfarm payrolls (NFP) figure might be. One point to note: the ADP adjusts its figures to match the final estimate of NFP, not the initial estimate that we get this Friday. So while it’s one of the best guides to the NFP that we have, it’s not perfect by any means – in fact, neither is the NFP figure itself, since it’s always revised.
The figure looks like it’s not very much this time but that’s just because the other numbers this year have been so humongous. The market is looking for an increase of 1.0mn jobs, which by the way is less than the consensus forecast for Friday’s NFP (1.37mn). 1.0mn would be a lot better than last month’s disappointing figure, but hardly anything to get excited about when there are some 27mn people collecting unemployment insurance around the country. I’m not sure whether it would be seen as good (in that at least jobs are increasing) or disappointing (because the pace of increase is so much slower than it was a few months ago).
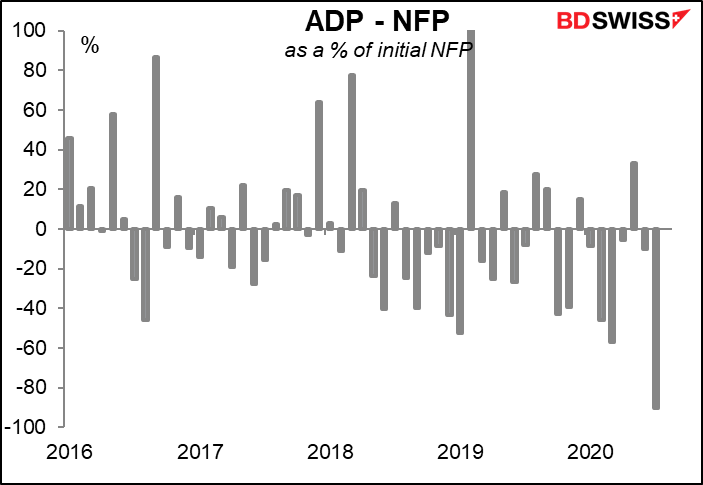
In any case, as noted above the ADP is but an imperfect forecast of the NFP, and recently it’s been particularly imperfect. Last month’s +167k ADP compared with a +1763k NFP for a 90.5% miss. As you can see from the graph, errors of similar magnitude in the opposite direction are not uncommon, and especially nowadays, when the numbers are so incredible and the seasonal adjustment is so far out of whack, the errors are going to be tremendous.
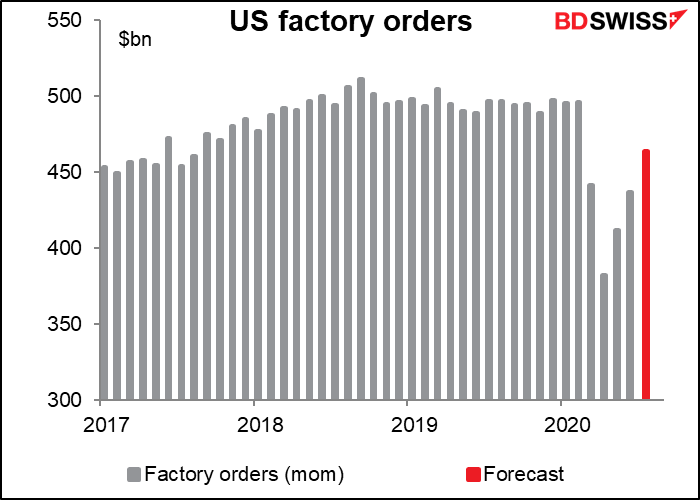
US factory orders are expected to continue to recover. They’re forecast to be above March’s level but still 6.5% below the average level of January and February. Still, recovery is recovery.
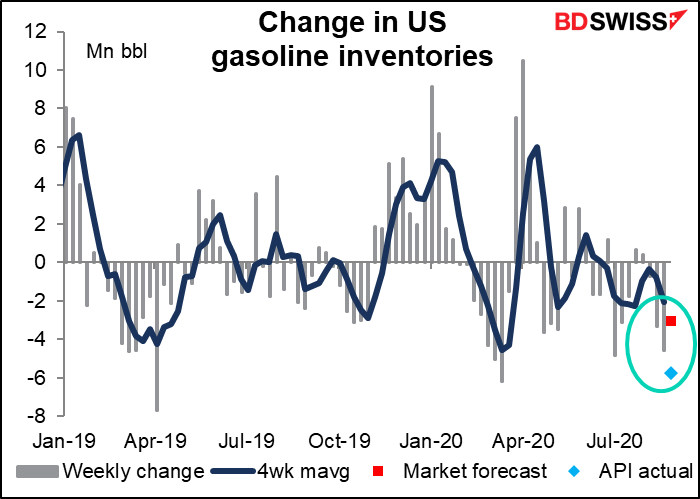
US crude oil inventories are expected to fall yet again, as are gasoline inventories. It will be interesting to see what impact Hurricane Laura in the Gulf of Mexico has on this week’s figure. Last night, the American Petroleum Institute reported a large drawdown of 6.36mn bbl of crude and 5.76mn bbl of gasoline. This was a large drawdown of gasoline stocks but not unprecedented.
The Fed releases the “Summary of Commentary on Current Economic Conditions,” aka The Beige Book (which looks green to me, at least the version you can buy in the store) as always two weeks before the next FOMC meeting. It’s significant for the market because the first paragraph of the statement following each FOMC meeting tends to mirror the tone of the Beige Book’s characterization of the economy. The book doesn’t have any number attached to it that quantifies its contents, but many research firms do calculate a “Beige Book index” by counting how many times various words appear, such as “uncertain.” In any case, the book is largely anecdotal so you’ll just have to watch the headlines as they come out.
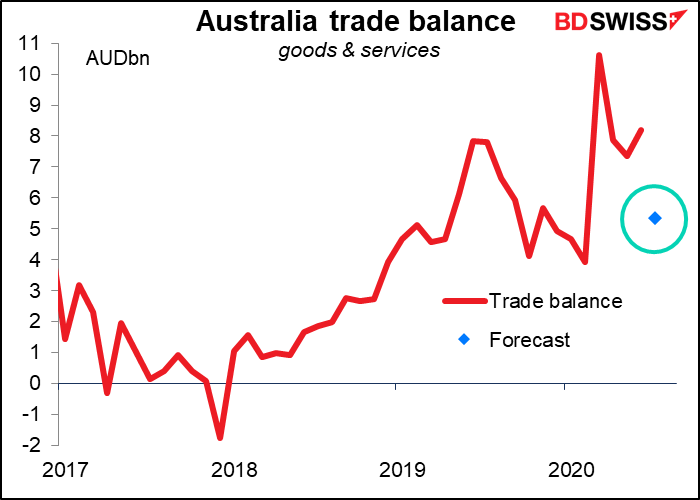
Overnight, Australia releases its trade data for July. The trade surplus hit a record in March and has since come down. The preliminary data suggests that exports fell and imports rose, so the surplus is expected to fall further but to remain on the high side historically. The strong trade surplus has been one of the main factors supporting AUD recently. If it keeps declining, we could see a weaker currency.