Rates as of 05:00 GMT
Market Recap
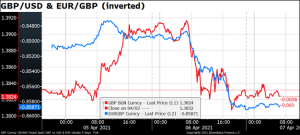
Wow! What happened to GBP overnight? No idea. Neither Bloomberg nor Reuters nor anyone else I could find had a good explanation of why GBP basically collapsed. It seems to have been a reaction against the big move on Monday April 5th, which took place while the UK was out for the Easter holiday.
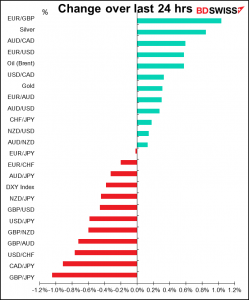
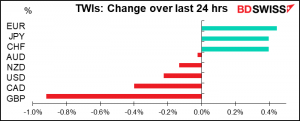
For GBP/USD, all that happened was that it unwound Monday’s gains. The real move was vs EUR. EUR/GBP moved up substantially (shown as down in the graph below, to make the movement in the two pairs comparable). If you look at the graph at the bottom of this comment, you’ll see that EUR/GBP was the biggest mover of any of the pairs I track, rising 1.03% on the day.
In fact, looking further at that graph, you can see that EUR gained vs USD and AUD as well (but not JPY and CHF). So perhaps what we saw was not so much GBP weakness as EUR strength expressed through EUR/GBP.
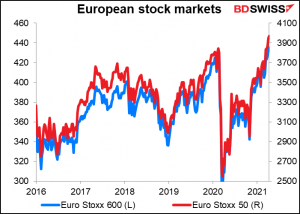
Why would that be? Well perhaps it was related to an inflow of money into European stocks, which hit a record high yesterday. (US markets by contrast pulled back a bit from Monday’s record highs.)
There was some renewed optimism about the EU’s progress on vaccination. Bloomberg reported that the European Commission said most member states will have sufficient vaccine supplies to immunize the majority of people by the end of June, assuming no further problems with the Oxford/AstraZeneca vaccine (I hope not, as I’m scheduled to get my second shot in June).
EUR strength may also have been the counterpart to USD weakness as US Treasury yields fell. Ten-year Treasury yields fell 4bps to 1.66% and continued falling this morning to 1.63% as inflation expectations fell. This despite the IMF’s upgraded forecasts for the US economy yesterday (see below).
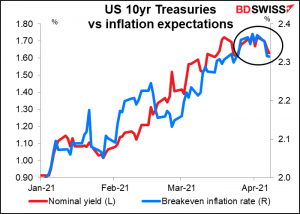
The change seems to have prompted a modest reassessment of the likelihood of Fed tightening, which is negative for USD.

CAD was weaker as a rally in the oil market faded by midday on reports out of Vienna of progress from indirect talks between the US and Iran. According to the New York Times, the US and Iran “agreed through intermediaries on Tuesday to establish two working groups to try to get both countries back into compliance with the 2015 Iran nuclear deal.” One working group will focus on how to get the US to lift the economic sanctions, while the other group will focus on how to get Iran back into compliance with the accord’s limitations on nuclear development. As I pointed out yesterday, Iran’s full return to the oil market could add between 1mn – 1.5mn barrels a day of oil, thereby upsetting the market’s fragile balance.
Today’s market
Note: The table above is updated before publication with the latest consensus forecasts. However, the text & charts are prepared ahead of time. Therefore, there can be discrepancies between the forecasts given in the table above and in the text & charts.
Today starts out with the final service-sector purchasing managers indices (PMIs) for those countries that a) have initial ones and b) were on holiday earlier this week when the other countries, namely Japan and the US, released theirs. No fireworks expected. The focus will be on other countries that haven’t released theirs yet. Are service-sector PMIs improving in general?
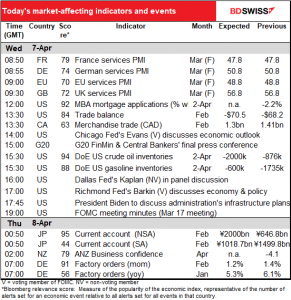
The Mortgage Bankers’ Association (MBA) mortgage applications for house purchases declined slightly in the last week. Is it because people are less interested in buying a house? Or getting priced out of the market? (The Yogi Berra rationale: “No one goes there any more – it’s too crowded.”) Or perhaps there just aren’t enough houses available for sale. That seems to be the major obstacle as the inventory of houses for sale has plummeted. I wouldn’t get too worried about fewer mortgage applications.
The US deficit in goods & services hit a record wide in November of $69.04bn. It’s expected to beat that this month (February) at -$70.4bn. As you can see, the deficit in goods alone (the blue line) hit the magic number at -$86.72bn, vs -$86.11bn in November. In times gone by this would’ve sent the dollar crashing, but no one seems to care about the trade deficit any more.
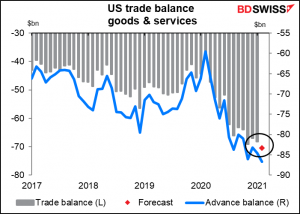
The widening US trade deficit demonstrates how US fiscal policy will be a driver of global growth this year, as the IMF noted yesterday when it revised up its forecast for the global economy to +6% in 2021, up from its 5.5% forecast in January. US pandemic support payments hit people’s bank accounts in January and boom! They went out shopping. Much of their spending went to imported goods. Just think what’ll happen when the March payments shart showing up in the data. That’ll be a driver of demand in China, Canada, Germany, Japan, South Korea, and anywhere else that makes goods exported to the US.
“The upgrades in global growth for 2021 and 2022 are mainly due to upgrades for advanced economies, particularly to a sizable upgrade for the United States that is expected to grow at 6.4 percent this year,” said IMF Chief Economist Gita Gopinath. “Now, this makes the United States the only large economy projected to surpass the level of GDP it was forecast to have in 2022 in the absence of this pandemic.”
Ditto for the Canadian merchandise trade data, which has a low 62.5 Bloomberg relevance score. Normally I don’t bother making graphs for indices this low, but I can’t help the nagging feeling – caused by decades of work in FX – that trade should matter to the FX market. The fact that Canada’s merchandise trade account flipped into surplus last month and is expected to remain in surplus this month may be significant.
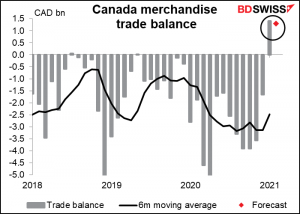
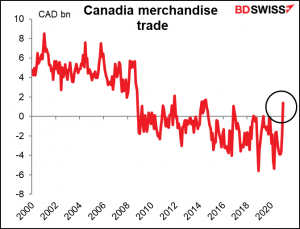
Canada used to run a consistent merchandise trade surplus, but after the Global Financial Crisis it’s turned into a fairly consistent deficit.
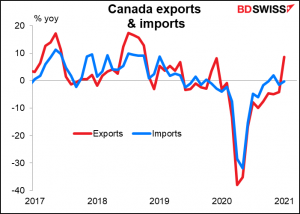
It’s occurring because of a rise in exports, not a fall in imports, so it may be sustainable, especially once the Biden Administration’s infrastructure plan starts up and demand for Canadian raw materials increases further. I think Canada – and CAD – could be one of the major beneficiaries of the US fiscal expansion.
The G20 Finance Ministers and Central Bankers meet. Their final press conference will be held virtually, but I’m not sure whether it ordinary mortals can access it. According to the G20 website, the Ministers and Governors “are expected to steer the international community by providing guidance on the shape of the policy response, especially on health-related initiatives, the support to the most vulnerable economies, the advancement on the international taxation agenda, the transition towards more sustainable economies and financial regulation. Ministers and Governors will also discuss an update of the G20 Action Plan, the main policy tool to guide the global response through the COVID-19 crisis…”
The main thing this time will probably be an extension of the debt-service initiative for poorer nations until the end of the year, according to World Bank President David Malpass. This may help to support emerging market currencies today.
President Biden is expected to make a speech explaining his administration’s goals with regards to infrastructure, which could further boost US stocks today. The impact on the dollar would depend on whether it causes a risk-on movement (which would be negative for USD) or sends Treasury yields higher (which could be positive for USD).
At the end of the US day comes what’s probably the highlight of the day, namely the release of the minutes of the March 16-17 Federal Open Market Committee (FOMC) meeting. I discussed this at some length in my Weekly Comment, but just to recapitulate: the main point will be their discussion of their new reaction function, or why the majority thinks the fed fund rate is likely to stay unchanged at around zero until 2024 even though they upgraded all their economic forecasts (including three years of inflation estimated to be at or above their 2.0% target).
In addition, everyone will want to know what they think about inflation. All the indications are that inflation is likely to rise in the near term and market expectations have certainly been rising, but Fed officials have consistently argued that any sharp rise in the near future will just be temporary.
Finally, we will search – probably in vain – for some further insight into what would constitute the “substantial further progress” on unemployment that they say they want to see before they start tapering down their bond purchases. Chair Powell’s guidance was limited to “until we give a signal, you can assume we’re not there yet. And as we approach it, well in advance,…we will give a signal that yes, we’re on a path to…consider tapering.”
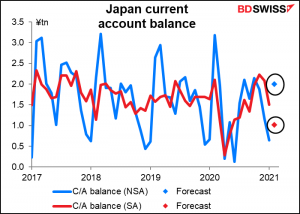
Overnight, Japan releases its current account figures. Contrary to what I said above about the US and Canada, Japan is one of the few major industrial countries where people do pay attention to the trade data. It may be thanks to force of habit – the idea of Japan as a mercantilist country whose economy is driven by exports – or simply due to the fact that the major exporters are also the major companies and their activities, including domestic investment, are to some degree driven by exports.
In any event, Japan’s current account surplus is expected to decline on a seasonally adjusted basis, although that would be a sharp rise on an NSA basis. But the figure for February is notoriously volatile because of the Lunar New Year, which affects exports to China and Taiwan.
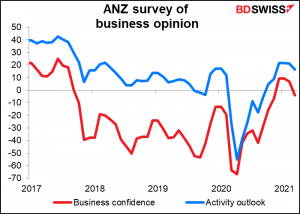
There’s no forecast for the Australia New Zealand (ANZ) Bank business confidence index, but it seems to be widely watched regardless. So here’s a graph. It turned negative in March; will it turn back up in April or just get worse?
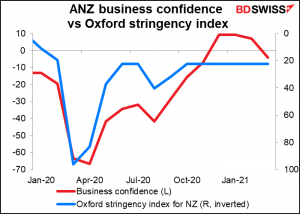
NZ business confidence was closely correlated with the lockdown measures, but New Zealand has been relatively free of virus cases in recent months and relatively free of lockdown measures, although the largest city, Auckland, had two lockdowns in February. In March the whole country averaged just four new cases a day in a country of 4.9mn people. By contrast, Ireland, another island country with 4.9mn people, averaged 525 new cases a day and the great state of Alabama, also with 4.9mn people, averaged 714 new cases a day.
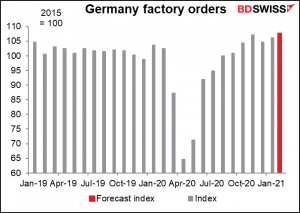
Then early in the European day Thursday, it’s German factory orders. This is taken as a leading indicator of German industrial production and so watched pretty closely. They’re expected to be up a pretty small 1.2% mom. Even more important, the March manufacturing purchasing managers’ index showed “the steepest rises in new orders and output since the survey began in 1996,” according to Markit. So any weakness in February is just a quiet period ahead of the explosion we’re expecting next month.

Still, that would leave orders 4.3% above the January/February 2020 average, which is pretty good.