Rates as of 04:00 GMT
Market Recap
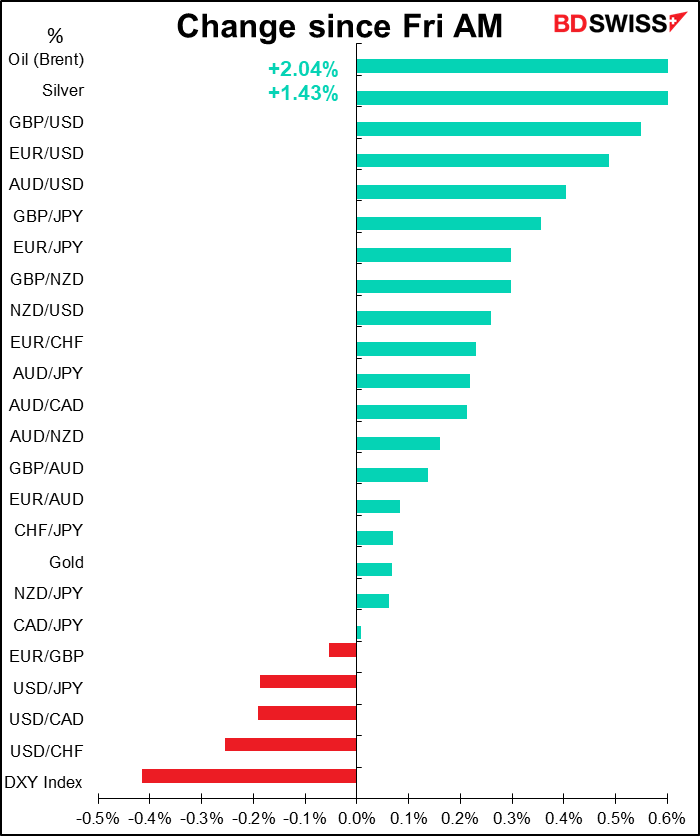
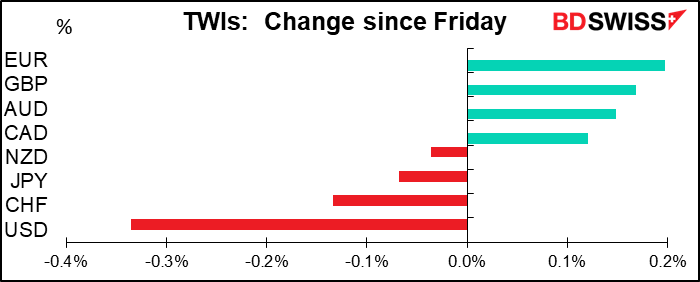
Not much to say about the FX market this morning, I’m afraid. I just don’t think a movement of ±0.2% is really worth dissecting in any great detail. The only point to note is the weakness of the dollar and concomitant strength of the euro. This reflects the “risk-on” mood after US stocks closed higher on Friday and almost all Asian markets are up this morning. Other currencies are also reflecting the same underlying theme, just to less of a degree. The risk-on move started early Friday in New York on news of additional data on Remdesivir’s potential efficacy and sizable Chinese agricultural purchases according to a US Dept of Agriculture release.
So much winning! Florida (population 21.5mn) hit a new US record for the number of new virus cases in one day: 15,000, blasting past the previous one-day high of 12,274 set at the height of the outbreak in New York in April.
Some comparisons are in order. By contrast, the entire Eurozone (pop. 342mn) averaged 2,415 new cases a day over the last week; Britain (66.7mn), 603. The worst day for the Eurozone was 28 March with 30,516 cases. So with only 6.3% of the population of the Eurozone, Florida has 50% of the number of cases on the Eurozone’s worst day. The equivalent number for Florida – if Florida had the same ratio of cases to population as the Eurozone on its worst day — would be 1,918. In short, relative to the population this is about 8x as bad as the worst day ever recorded in the Eurozone.
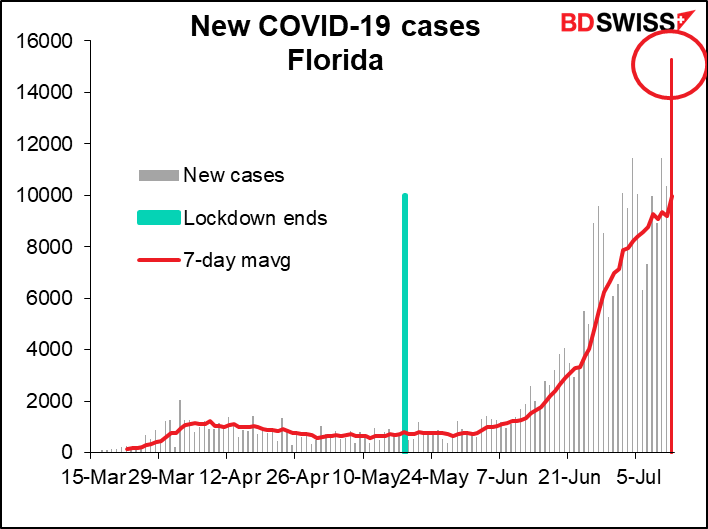
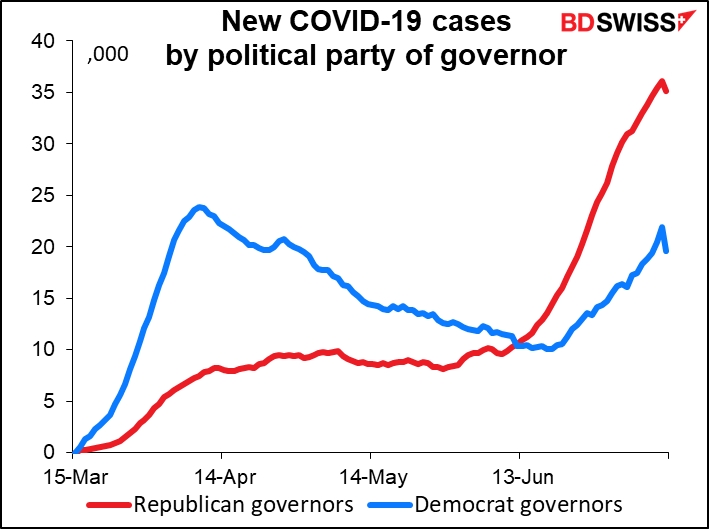
The virus is accelerating in both Republican and Democratic states, but far more rapidly in the former nowadays. (The reason it seems to be turning down at the very end is because a lot of states haven’t reported their weekend figures yet.)
Although this depressing news is dominating the US news this morning, it doesn’t seem to have had that much of an impact on the markets: all but one stock market in Asia are up at the time of writing (Singapore is down 0.3%). Perhaps the markets have just gotten used to the idea that the US is spiraling down into a hellhole of unchecked disease and death more redolent of a Hollywood disaster movie than a developed industrial country.
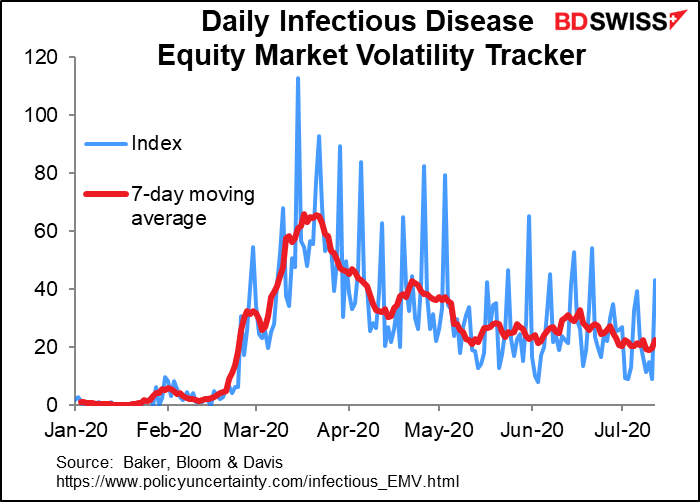
How strongly is news about the virus affecting the stock market? Believe it or not, there is a “Daily Infectious Disease Equity Market Volatility Tracker,” brought to you by Profs. Baker, Bloom, Davis and colleagues. These are the same people who devised the handy indicators of economic policy uncertainty. It’s a count of newspaper articles that contain at least one term each in four categories associated with this issue: a) the economy, b) the stock market, c) volatility and risk, and d) some kind of virus. What this index suggests is that the topic has apparently become less important over time. That is, the movement in the stock market is being attributed less and less to the virus.
If anything, there seems to be a positive correlation between the number of new cases and the performance of the US stock market, but of course that’s a spurious correlation – unless of course people feel that the worse the virus, the looser the Fed and Congress will be.

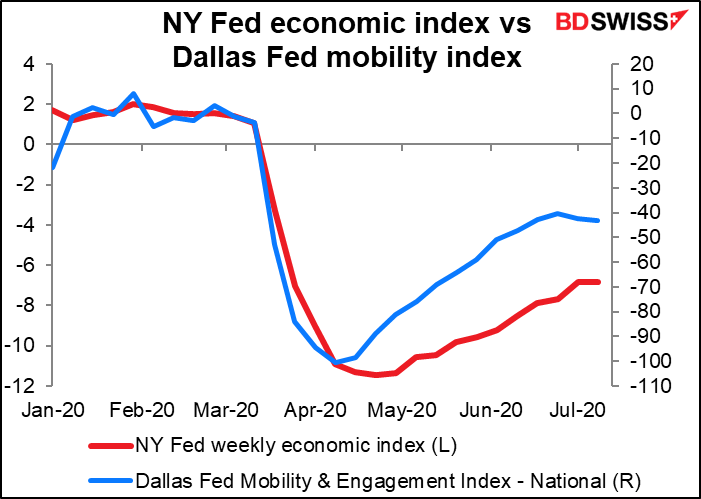
But even so, how long can monetary and fiscal policy make up for a crippled economy? The Dallas Fed’s mobility & engagement index has started to turn down, meaning people are becoming less active. That index has so far led the NY Fed’s economic index, a GDP proxy. We could see the US economy start turning down again. See this week’s weekly comment, “To “V” or not to “V”.
Oil was higher than Friday’s closing level but coming off on reports that OPEC’s Joint Ministerial Monitoring Committee, the panel that reviews OPEC+’s progress, will meet on Wednesday to consider whether the group should maintain its 9.6mn b/d cutbacks for another month or taper the cutbacks to 7.7mn b/d as originally planned. Bloomberg reported that members are leaning toward the latter option, which would mean an increase in supply. That would also be bearish for CAD as well as for oil.
Commitments of Traders Report
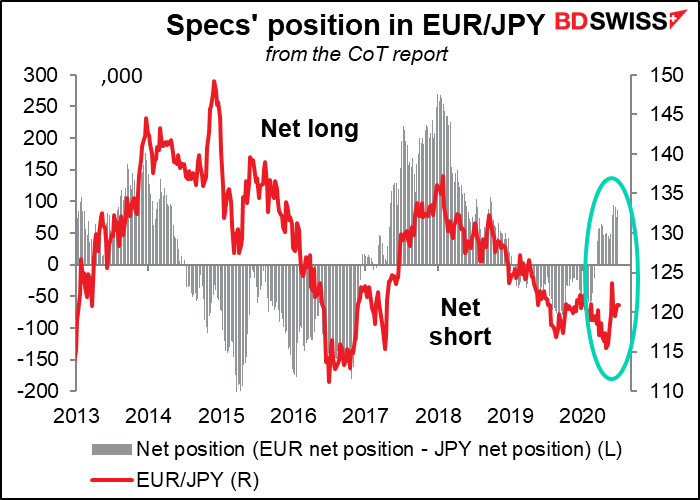
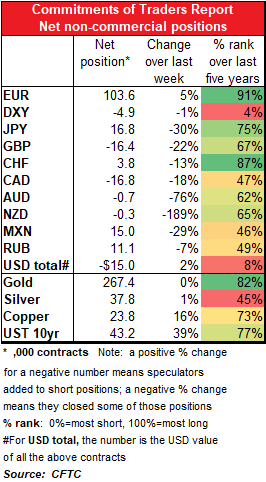
Speculators are still bailing out of dollars and into other currencies, noticeably the euro.
They also cut short positions in GBP, CAD and AUD.
However they also cut JPY longs significantly. In fact in dollar terms, they reduced JPY longs by more than they increased EUR longs. Perhaps this was specs turning bullish EUR/JPY?
Today’s market
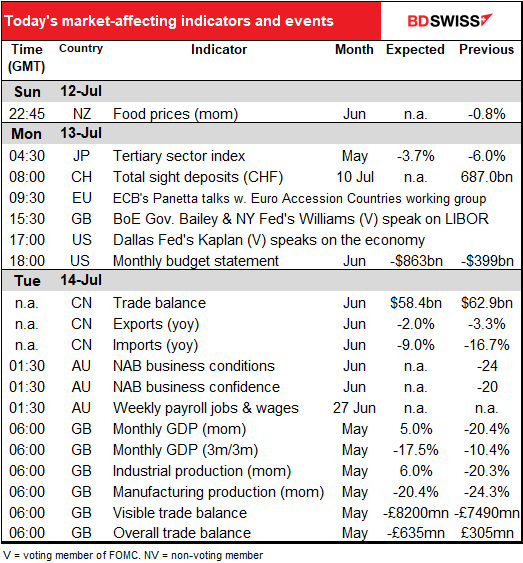
Not that much on the schedule today. Most of the excitement is overnight.
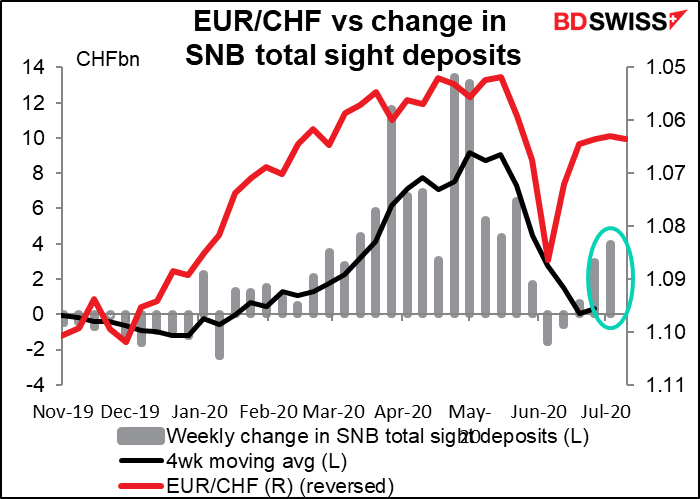
The weekly Swiss sight deposit data indicates that the Swiss National Bank (SNB) has been stepping up its intervention to keep EUR/CHF from going below 1.06. EUR/CHF seems to have flatlined for now. I wonder how much money that took?
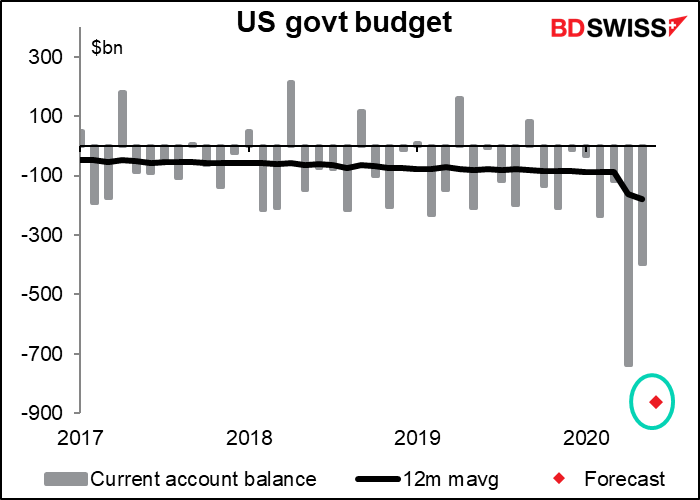
The US budget deficit probably hit a record in dollar terms in June. That should be no surprise to anyone. Spending is up thanks to unemployment benefits and the Paycheck Protection Program, while lower economic activity and deferred taxes are depressing revenues. The Congressional Budget Office currently projects a $3.7tn deficit for the current fiscal year, but nine months in the year it’s at $2.7tn and headed higher. So much winning!
That’s it for Monday.
Overnight, China announces its trade data. The surplus is expected to rise, but that’s only because imports are forecast to fall faster than exports – not great for anyone. We’re still waiting for Chinese demand to turn up and help drive recovery elsewhere.

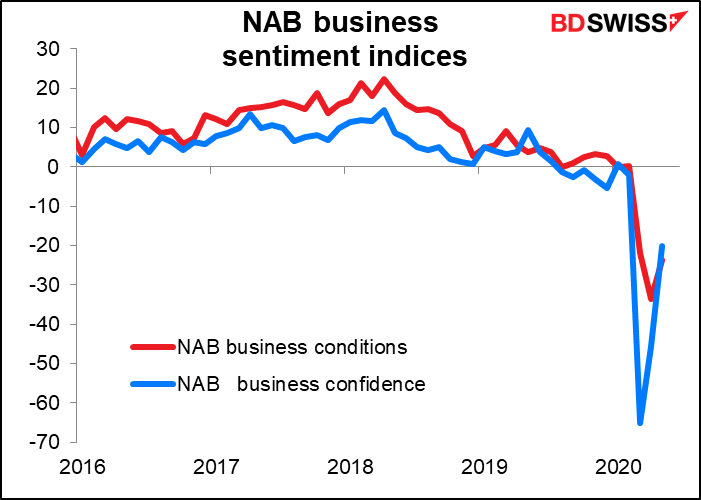
No forecasts for Australia’s NAB business sentiment indices, but they can and do sometimes affect AUD.
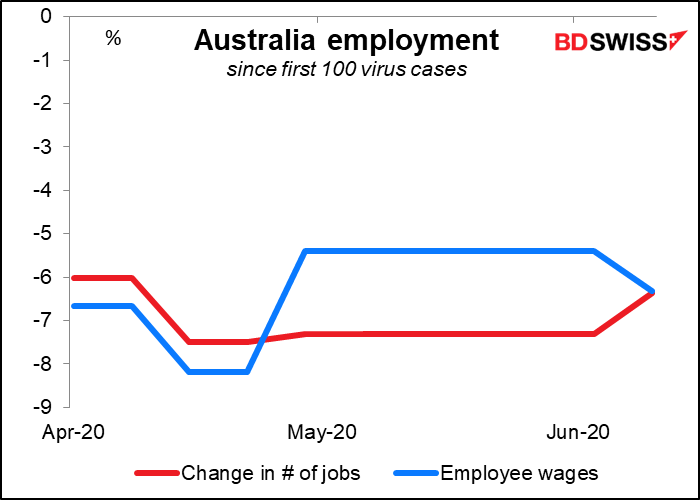
Australia also has a new short-term series of employment indicators that show the change in jobs and wages since the first 100 virus cases were discovered. It’s only been updated four times so far, twice in April, once in May, and last during the week of 13 June. We’re supposed to get another update today for the week of 27 June. No forecast available.
Then as the day gets under way in Europe, the UK springs short-term indicator day on everyone just as they’re staring bleary-eyed at their coffee (maybe from a GBP 180 Ember Travel Mug, like UK Chancellor of the Exchequer Sunak has. The price sounds outrageous for a coffee mug, but it’s a pretty nifty gizmo: it has a battery-powered heating element that will keep your coffee at the temperature you choose for up to three hours, according to the company’s ads. Just what every busy caffeine-dependent Chancellor needs!)

The data include the monthly GDP figures, as well as industrial & manufacturing production and the occasionally distorted trade data.
UK GDP for May is expected to rebound 5% from the record fall in April. That would be in line with the usual pattern that we’ve seen worldwide, that April was the trough of activity.
By the way, the GDP figures aren’t that closely watched, I just discovered – Bloomberg gives them both of them pitiful single-digit scores, indicating that almost no one who follows UK indicators has an alert set for them. I’m surprised, as I had thought they’re the most important of the figures coming out today.

Looking at the Bloomberg rating, the most important of the day’s indicators is industrial production mom, followed closely by manufacturing production mom. So I’m going to include graphs of those.
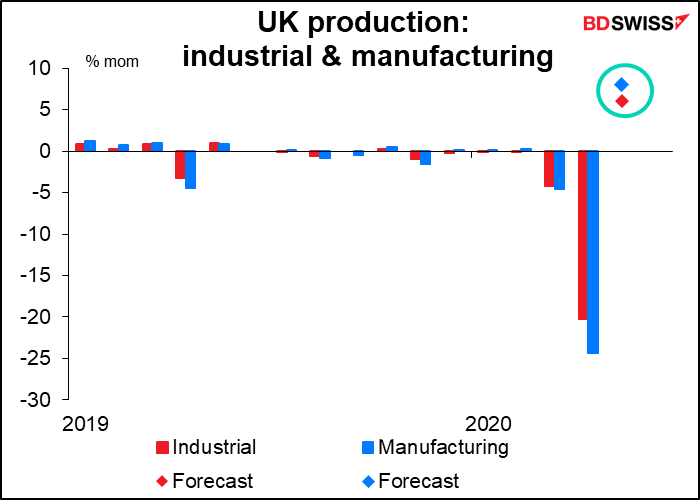
Of course these are just more meaningless graphs with no visible trend, so it’s more useful to show the indices themselves. That would demonstrate that although production is expected to have bounced back a bit in May, it’s still well below the levels of March, much less before the virus hit (the May forecast would show IP down 19% from the Jan-Feb average and manufacturing production -22%).

As for UK trade, the overall trade balance (red line) is expected to swing from a small surplus to a small deficit. Merchandise trade alone is expected to be a slightly wider deficit.
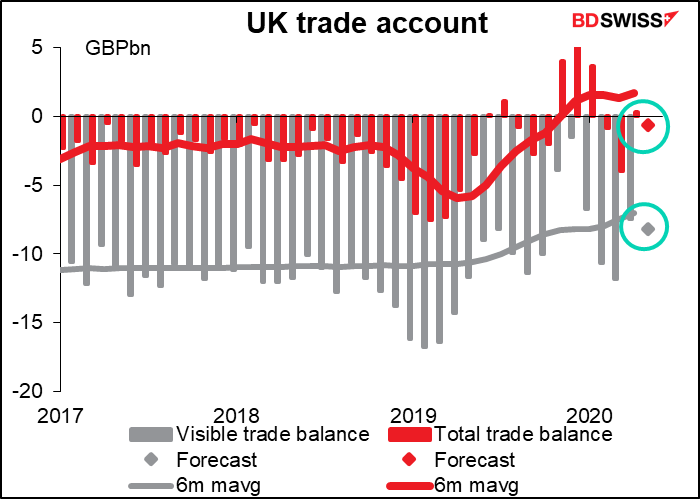
The relatively small change in the overall surplus/deficit belies the enormous change in the components. Imports overall are down 37% yoy, while exports are down 31%.

