We’ve heard a lot about inflation. Next Thursday is Thanksgiving Day in the US, the biggest national holiday, when much of the country gathers together and basically eats until they’re feeling ill. At least they used to before Trump came to power – a lot of families have since given up on large family gatherings because they’ve become too acrimonious as Uncle Fester starts nattering on about how Biden is a Communist and the people who stormed the Capital are patriots or antifa, whichever, while little Wednesday chooses the occasion to come out as nonbinary whose pronouns are Ze/Zir. Chaos ensues.
So I thought to ask, what kind of inflation are people facing at the dinner table? Because this is more real to most people than the “imputed rent” that accounts for some 24% of the CPI. Not everyone buys a used car every month but everybody eats, usually daily.
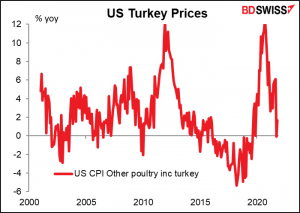
For the main feature of the traditional US Thanksgiving meal – a turkey – the inflation rate isn’t that bad. Turkey prices were up 1.7% yoy in October after falling slightly on a yoy basis in September. No reason to get upset at President Biden here – Uncle Fester will just have to rant about gasoline prices.
(I thought I had found a similar index for the EU, “EU CPI Meat Turkey,” but then realized that “Turkey” in this case referred to the country, not the food. There’s no EU CPI for poultry in Bloomberg, unfortunately.)
Let me stress that I’m a vegetarian so this is strictly for informational purposes only.
One year my late father came to visit me in Tokyo around this time and brought with him a Tofurkey, a tofu-based version of a turkey, so that we could continue this American tradition. Suffice it to say that although as a vegetarian I am accustomed to eating many sub-optimal foods, this one did not become a family tradition. But the thought was appreciated.
There is no US CPI for tofu that I can find, unfortunately. However there are futures on many grains and foods, including soybeans, the raw material for tofu. I’m in luck – US soybean prices are down 6.2% this year. But prices of other things on the average American dinner table are soaring, ranging from +8% for pork to +71% for the coffee that they’re going to need after dinner to stay awake for the football game.
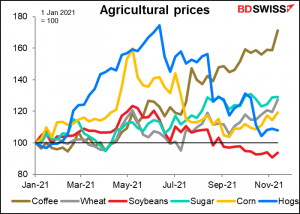
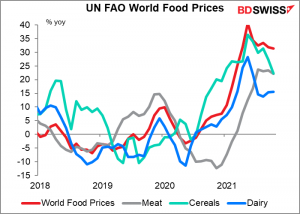
Agricultural prices aren’t just rising in the US, either. According to the UN Food and Agriculture Organization (FAO), world food prices are up a stunning 31% yoy, ranging from 16% for dairy to 74% for oils (not shown).
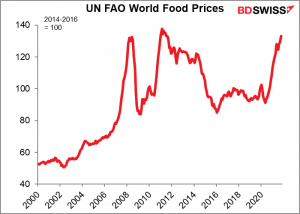
Their index of world food prices is almost back up to its record high of 2011 (not adjusted for inflation, however.)
As for why agricultural prices are going up like this…I have to admit, I don’t know for sure. Two causes come to mind. First, global shipping costs have increased dramatically, as have transportation prices generally. Secondly, fertilizer costs have soared too – the US PPI for fertilizer is up 51% yoy. Both stem from higher energy costs, although transportation is also being hampered by bottlenecks and supply shortages (not enough ships, congestion at loading ports, etc.)
There are two reasons for making this point. First, it’s to emphasize that inflation is not just an abstract concept but rather that people are feeling higher prices in their day-to-day lives. This may have political implications in the US, where the President gets blamed for everything. Secondly, monetary policy cannot do anything to boost the supply of coffee in the world. This kind of inflation may well be stickier than the authorities expected. Central banks may also decide the supply problems are not amenable to dealing with through higher interest rates, leading to lower real interest rates and a continued boom in stock markets.
If Thursday is Thanksgiving, then Friday is Black Friday, the biggest shopping day of the year. According to a recent survey, some 20% of Americans plan on shopping that day, while 45% plan on shopping on Saturday. I imagine it’s similar in many other countries where Christmas is the big gift-giving occasion. A lot is riding on this weekend for retailers around the world. Also for doctors – watch the Black Friday Death Count, which tracks how many people in the US get killed or injured shopping on this day.
Next week: preliminary PMIs, personal consumption expenditure (PCE) deflators, FOMC minutes, Black Friday, RBNZ meeting
The US week may be interrupted by the holiday on Thursday, but there’s still a lot on the schedule.
Tuesday we have the preliminary purchasing managers’ indices (PMIs) from the major industrial countries. They’re expected to be down significantly in Europe, with manufacturing in Germany and services in France expected to take particularly large hits, and up in the US.
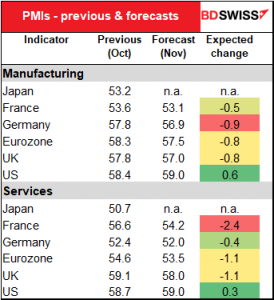
The pattern – worsening Europe, improving US — could well reinforce the view that the US is doing better than the Eurozone and push EUR/USD down further.

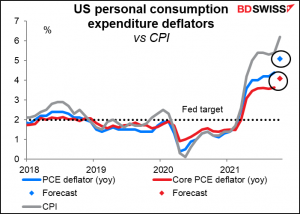
Wednesday we get the US personal consumption expenditure (PCE) deflators. While these are not as well known nor as closely followed as the consumer price indices, they should be, because they’re the Fed’s preferred inflation gauge. When Fed officials talk about their 2% inflation target, this is what they’re talking about, not the CPI. (If you’re curious about the difference between the two, please see my report, PCE Deflator: the Little Indicator that should be Bigger)
Regardless of the technical differences between the two series, the PCE deflators are also expected to soar. That could cause investors to speculate that the Fed might accelerate its pace of tapering and start raising rates earlier than people think, which could be positive for the dollar.
Although admittedly the odds of an early rate hike have diminished slightly over the last week and that didn’t hurt the dollar any.
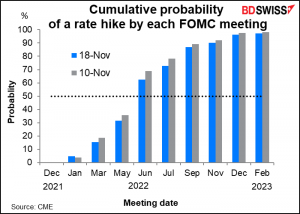
Speaking of rate hike expectations, on Wednesday we also get the minutes of the November meeting of the rate-setting Federal Open Market Committee (FOMC). Usually what’s interesting in these minutes is to see the debate that went on. This time the Committee decided unanimously to start “tapering” down its $120bn-a-month bond purchases. There might not have been that many dissenting voices in the decision to illuminate in the minutes. Still, there might have been some differences on the pace of tapering and how long to wait after tapering before starting to hike rates – the fabled “lift-off.”
The weekly US jobless claims will also come out on Wednesday because of the Thanksgiving holiday Thursday. On the other hand, the Commitments of Traders (CoT) report won’t come out on Friday as usual but instead will be released the following Monday.
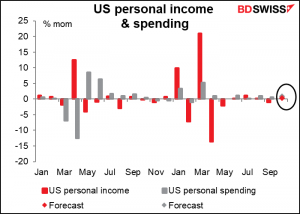
Other major US indicators out during the week include personal income & spending, which come out together with the PCE deflators. They’re both expected to show an increase from the previous month (0.3% and 0.9%, respectively) which is encouraging as the federal government’s special pandemic unemployment benefits ended in September. One of the major concerns for the US economy was what would happen when it was taken off this fiscal life support, but apparently the patient is quite strong enough to survive on zir own. Income is forecast to be 8.5% above pre-pandemic levels and spending 9.7%.
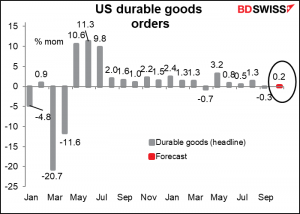
US durable goods orders are expected to be up modestly – not enough to get anyone excited, but at least enough to convince people that the US economy is still expanding.
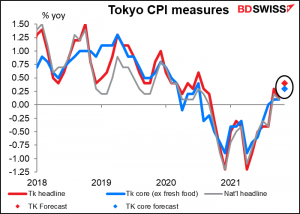
In Japan, the Tokyo CPI on Friday will be the major indicator of the week. But with headline inflation expected to creep up to +0.4% yoy from +0.1% and “Japan-style” core inflation (ex-fresh foods) +0.3% yoy, it’s not likely to be ringing any bells anywhere.
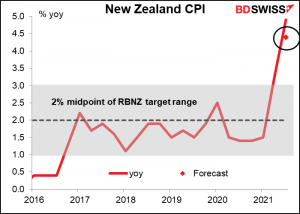
There’s one G10 central bank meeting this week, the Reserve Bank of New Zealand (RBNZ). They’re generally expected to raise the official cash rate (OCR) by 25 bps to 0.75%, their second hike after raising it to 0.50% on Oct. 6. The market is already discounting a steady increase in rates over the next two years.
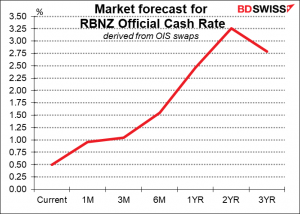
The focus will therefore be not so much on the rate move (unless it’s different from what’s expected) as it will be on their policy guidance and the forecasts in the accompanying Monetary Policy Statement (MPS).
The RBNZ’s policy guidance is quite vague. In October they said,
The Committee noted that further removal of monetary policy stimulus is expected over time, with future moves contingent on the medium-term outlook for inflation and employment.
Looking at the data from the August MPS, it looks to me like the GDP forecasts will have to be revised substantially.
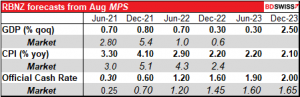
It also seems that the market is less hawkish than the RBNZ when it comes to rate hikes – that it believes the RBNZ will be faster than advertised to hike rates and therefore won’t have to hike them as far as it expects. Given the surprisingly high Q3 CPI figure (+4.9% yoy vs + 4.4% expected) the RBNZ is likely to go with the market on this one, in my view. That could be positive for NZD.