Rates as of 04:00 GMT
Market Recap
A wild day! The main feature was a rise in US Treasury yields, both nominal and real, that knocked the wind out of the precious metals market.
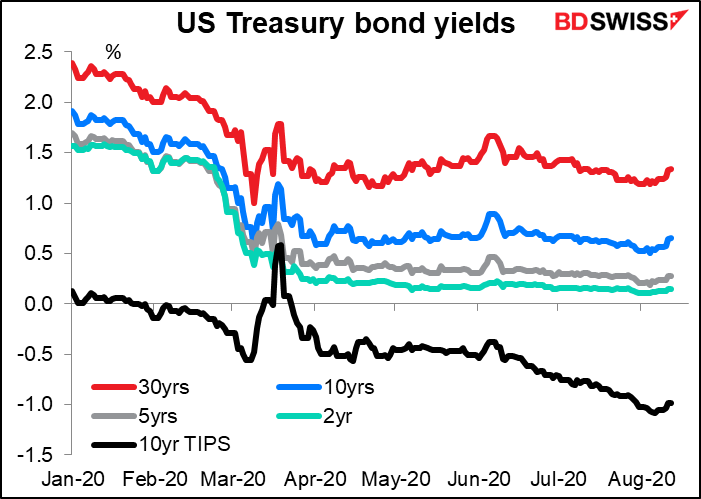
Russia’s announcement of a COVID-19 vaccine, plus a stunning beat on the ZEW Survey expectations index (never mind a much worse-than-expected current situation index) started the day off with a strong “risk-on” sentiment that sent bond yields higher. Comments from White House Advisor Kudlow about a modified unemployment benefits executive order and China’s meeting its obligations under the “phase one” trade talks also helped sentiment.
I was wrong about the US producer price index (PPI) – apparently people in the Treasury market are still concerned about inflation, because a higher-than-expected PPI reading yesterday (+0.6% mom vs +0.3% expected, -0.2% previous) created some concern about today’s US consumer price index and also helped push yields higher.
Later in the day, Senate Majority Leader McConnell said that negotiations about a fiscal package to replace the Coronavirus Aid, Relief, and Economic Security (CARES) Act were “at a bit of a stalemate,” due to issues such as liability protection and aid to state and local government. There were also more headlines about the surge in virus cases in the US and Europe. These headlines pushed US stocks lower, which oddly enough just sent Treasury yields up further. So yields seem to have risen on “risk-on” and risen on “risk-off” too.
An underlying reason for the higher bond yields and steepeing of the yield curve is the deluge of Treasury bond issuance this week, including a record $48bn auction of 3-year notes yesterday, a large ($38bn) 10-year auction today and $26bn in 30-year bonds tomorrow. See comments below about the US government’s monthly deficit, which will be announced later today. You can see how this indirectly affects our portfolio. (Although despite the weaker tone in bonds (= higher yields), the 3-year notes had a record-low yield of 0.179% anyway.)
The big news for us was that the “risk-on” mood in the morning plus higher interest rates sent precious metal prices reeling.
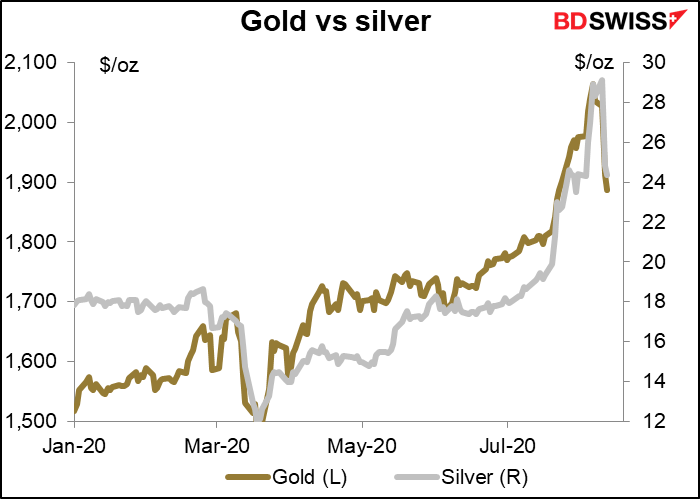
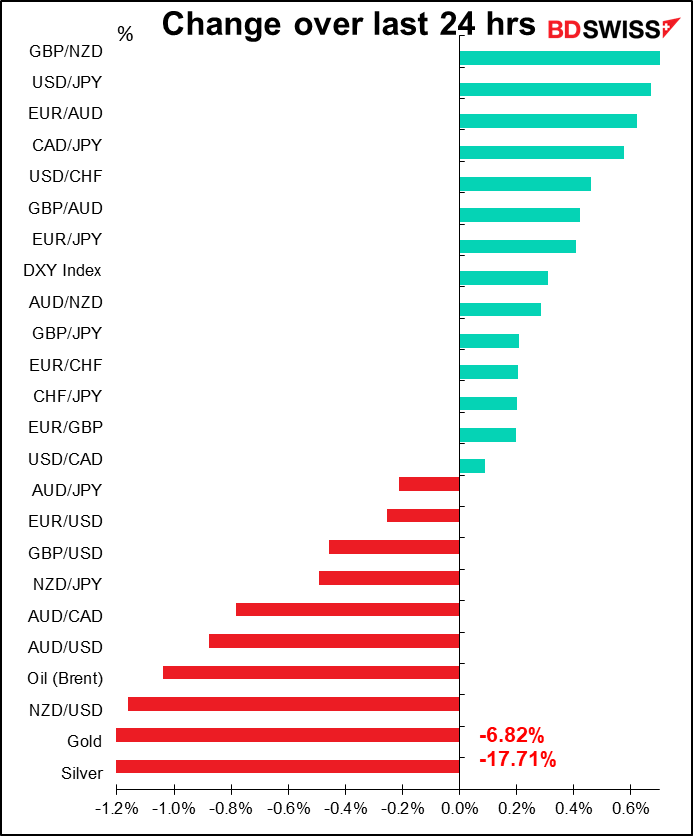
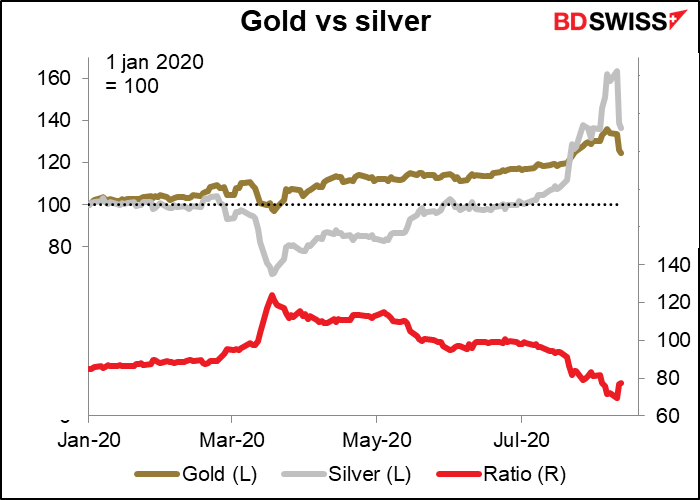
Both gold and silver crashed, with silver crashing by much more (-17.7% vs -6.8%). Nonetheless silver had outpaced gold by so much recently that the gold/silver ratio only came back to 76.6, where it has been a week before.
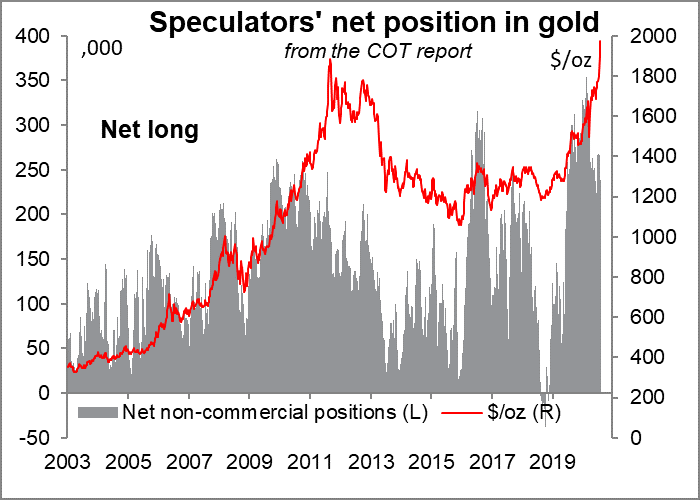
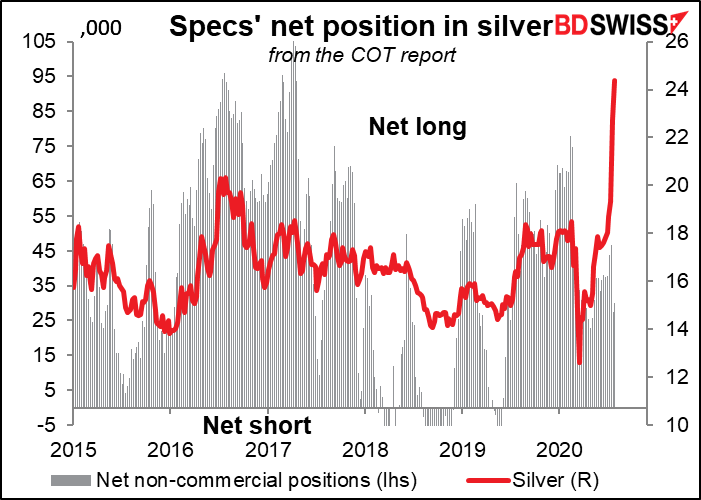
Looking at the Commitments of Traders (CoT) report, positioning among speculators was long in gold but not particularly stretched – not as long as it has been as recently as April, for example – and positioning in silver was positively low. This shows the limit of just looking at this kind of positioning data – issues like the rate of change have to be taken into account as well. The RSI for silver had consistently been in the 80s since late July .
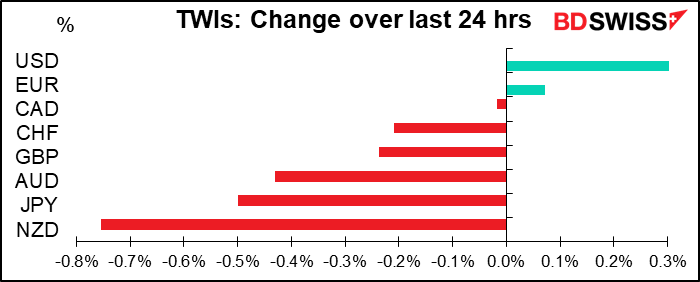
It’s surprising to me that in this “risk-off” environment, JPY was one of the worst-performing currencies. USD resumed its traditional role as the safest of the safe-haven currencies and most currencies fell vs USD.
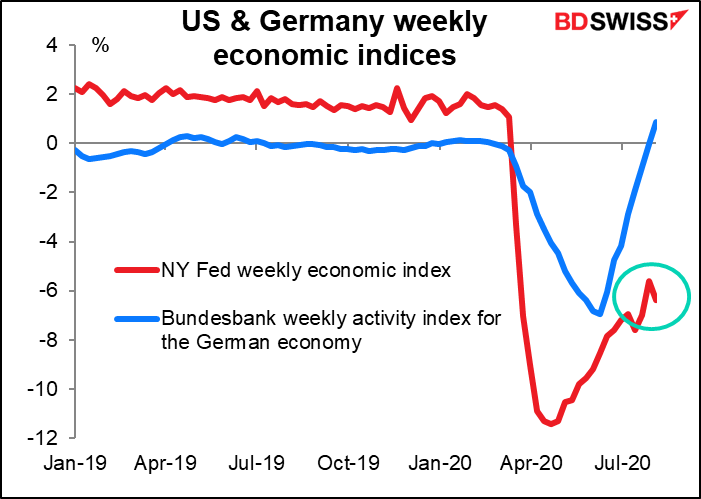
The Fed released its weekly economic index. Last week was revised up a bit, but the reading for this week shows a drop. It’s noticeable that the US recovery path is both slower and shakier than Germany’s.
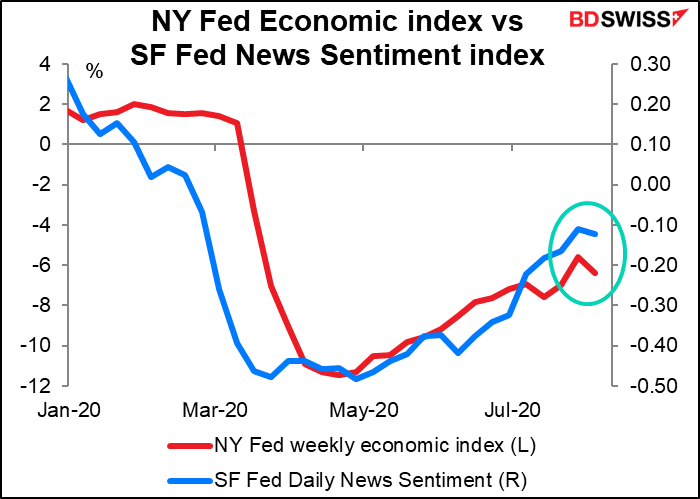
Of course, one week doesn’t make a trend, but the San Francisco Fed’s Daily News Sentiment Index of consumer sentiment has also turned down at the same time. This index, which is derived from newspaper articles, has a close correlation with consumer sentiment.
In other news, Democratic Presidential nominee Joe Biden chose California Senator Kamala Harris as his VP running mate. Harris has already run for office several times and was one of the dozens of people running for the Presidential nomination, so she’s already been subject to a lot of public scrutiny. She therefore shouldn’t generate any big negative surprises to the campaign. No wonder Trump immediately began criticizing her.
Reserve Bank of New Zealand (RBNZ): look out below for NZD!
As expected, the RBNZ kept rates steady, saying that “the level of monetary stimulus required … is broadly unchanged relative to May.” But that statement seemingly contradicts their decision to expand the Large-Scale Asset Purchase (LSA) program anyway to NZD 100bn while extending the timeframe for purchases out to June 2022. (It started as an NZD 30bn program to last until March 2021, expanded to NZD 60bn in May.)
How can we square the idea that the level of stimulus required is unchanged, but the LSAP program has to be expanded? Only by assuming that the LSAP program isn’t very effective at stimulating the economy. That suggests it’s reaching its limits (how big is the NZ government bond market anyway? There’s only NZD 86.4bn in issues outstanding.) This makes me think that the next move, if any, is likely to be something even more extreme. Indeed, today’s RBNZ statement said,
Reflecting a possible need for further monetary stimulus, the Committee also agreed that a package of additional monetary instruments must remain in active preparation…The package of further instruments includes a negative OCR supported by funding retail banks directly at near-OCR (a Funding for Lending Programme). Purchases of foreign assets also remain an option. (emphasis added)
As I said yesterday, a negative official cash rate (OCR) plus purchases of foreign assets is straight out of the Swiss National Bank’s playbook – and a big negative for NZD.
Today’s market
Yesterday’s comments discussed the outlook for today’s disastrous UK GDP figures, which in the event were almost spot on the consensus estimate at -20.4% qoq (vs -20.7% consensus).
So now we start off with EU industrial production. It’s expected to be up sharply on a mom basis, although that would only bring it back to March’s level.
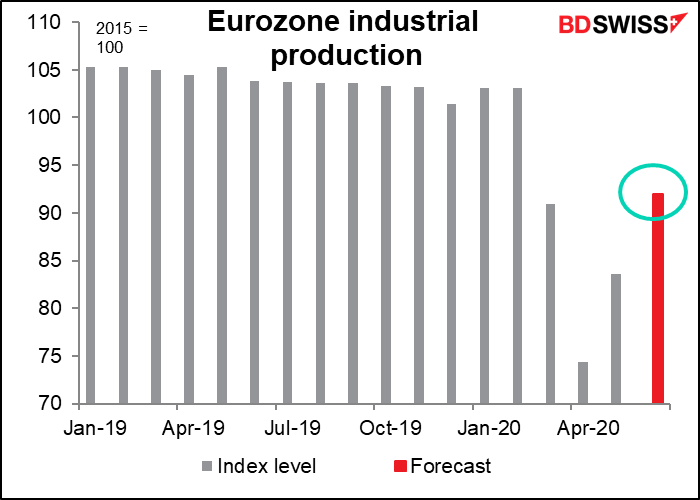
The yoy forecast would bring production back into line with where the Eurozone manufacturing purchasing managers’ index (PMI) says it should be, so it would be no surprise.

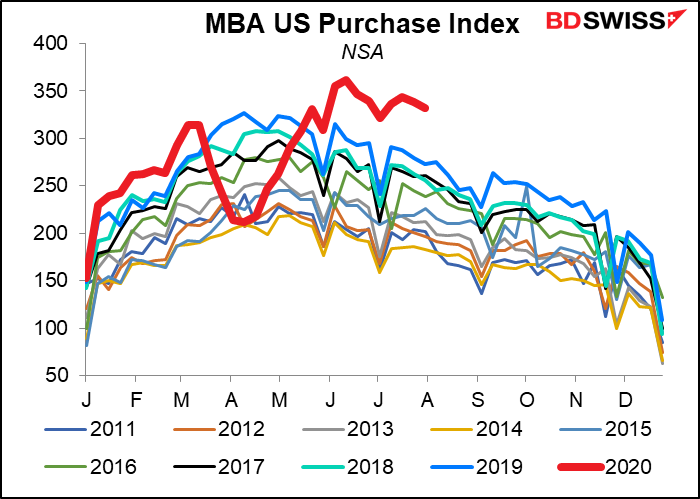
The Mortgage Bankers Association (MBA) mortgage application index continues to run well above previous years. As I mentioned yesterday with the Canadian housing starts, people who find they can work from home suddenly realize they can move out of the city and get a house (where they can also have a home office so they can keep working from home, maybe). This trend coupled with record-low mortgage rates is keeping the housing market brisk.
The US consumer price index (CPI) used to be one of the big indicators of the month, but no more (although looking at the Treasury bond market’s reaction to yesterday’s PPI, I’m not so certain about this, at least on a short-term horizon). Over the longer term, the virus count, the fiscal response and short-term indicators will determine monetary policy, not inflation. Fed Chair Powell said in his press conference that “I think fundamentally, this is a disinflationary shock…. I do think for quite some time, we’re going to be struggling against disinflationary pressures, rather than against inflationary pressures.” In that respect, we might look to further easing if consumer prices should start falling, but I think there’s little chance of anyone getting concerned if it ticks up a bit – which headline inflation might, as oil prices rise, but core inflation – which is what the Fed watches – isn’t.

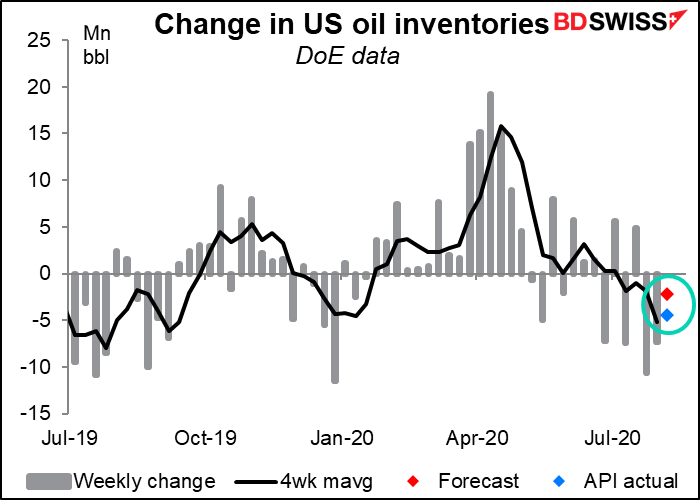
Will crude oil inventories fall for the third consecutive week, as the market predicts? The odds are yes. The American Petroleum Institute (API) last night said inventories fell 4.4mn barrels during the latest week, more than the -2.2mn the market is expecting.
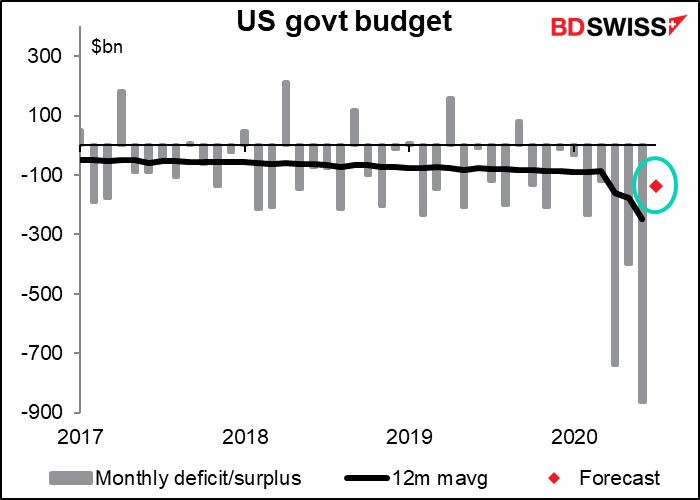
The US budget deficit is expected to narrow a lot in June from the previous month, but in this case, with an indicator that’s so seasonal, a better comparison is with the like year-earlier period, and there it’s expected to be just a little wider (-$137bn vs -$120bn). I’m rather surprised to see such a small difference. The range of forecasts is from -$44bn to -$380bn.
I don’t think this indicator is market-moving itself, but as it is the underlying cause for all the Treasury’s bond-selling and the Fed’s money-printing, it’s worth watching.
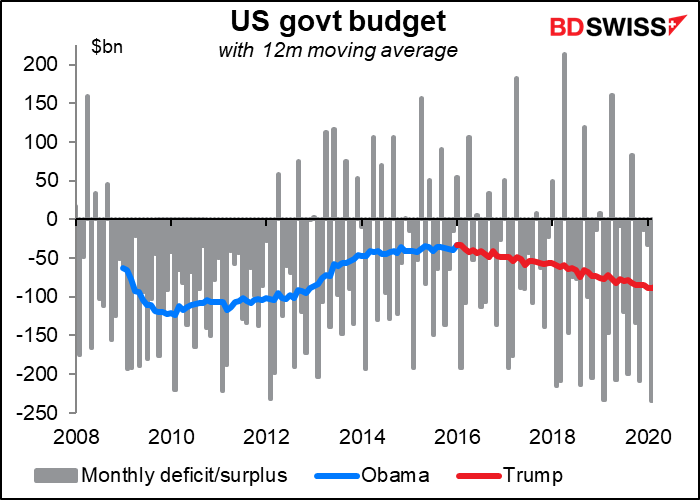
By the way, while I was working with this spreadsheet I got curious – how did the deficit compare under Obama and under Trump? Answer: even before the pandemic, no comparison. I wonder what happened to Trump’s campaign promise to eliminate the budget deficit in eight years. Maybe he found that Mexico was paying so much money to build the wall, they couldn’t afford to pay any extra?
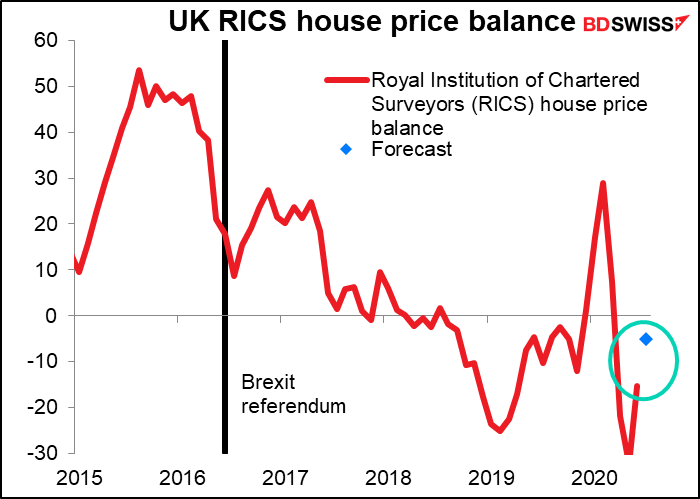
The UK Royal Institution of Chartered Surveyors (RICS) house price balance is expected to show a continued improvement, but still a negative balance. This is a sentiment indicator of chartered surveyors – a diffusion index of the proportion of respondents reporting a rise in prices minus those reporting a fall. It doesn’t say how much prices are going up or down, but it does give a quick reading on the breadth of price changes (that is, how widespread the change is throughout the regions covered). That makes it a leading indicator of house prices. It’s not that important within the panoply of housing indicators released in Britain every month, but it is watched.
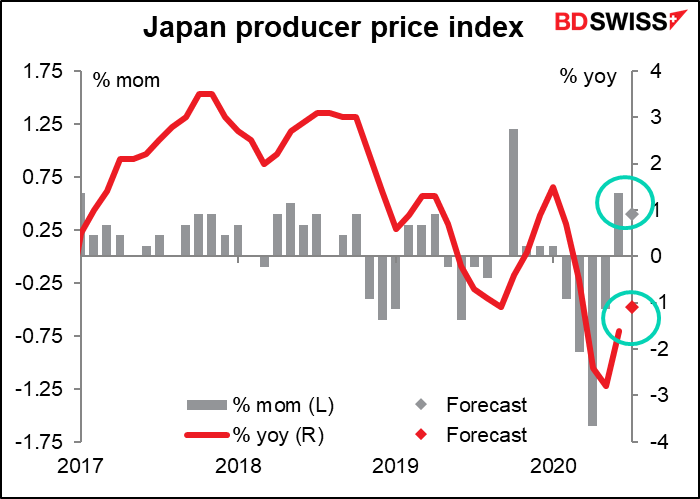
Overnight, Japan releases its producer price index. It’s one of the most closely watched Japanese indicators, according to Bloomberg, so I’m including it here. My suspicion is that it’s watched by equity analysts, who are looking to figure out what’s happening with companies’ margins, and not watched so much by FX people. In any event, it’s expected to show continuing but diminishing deflationary pressures. I doubt whether that will influence the BoJ though.
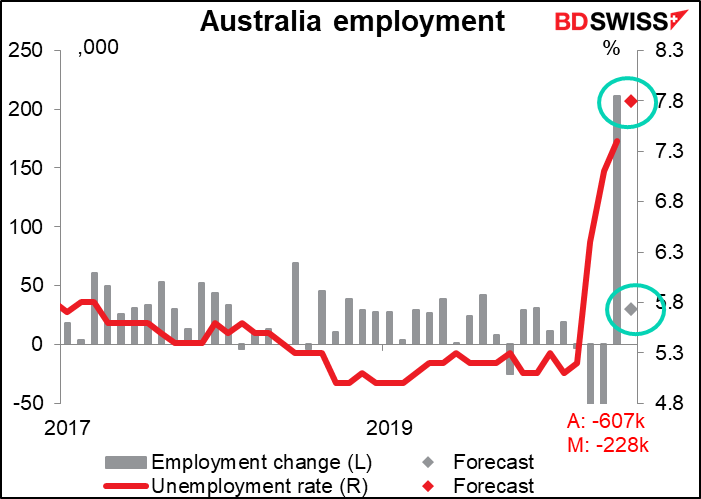
Finally, the Australian employment data is expected to be slightly contradictory. On the one hand, employment is forecast to have risen; on the other, the unemployment rate is forecast to have risen even more. That could be because of more people coming into the labor force looking for jobs after the massive job cuts of April and May (which I’ve abbreviated in the graph and replaced just with the numbers). The survey for July took place 28 June – 11 July, which means it was largely finished when Melbourne went into severe lockdown on 8 July. In any event, don’t pay too much attention to any good figures on Australian employment, because if there are any, they’re only temporary.
