Previous Trading Day’s Events (15.04.2024)
The unemployment rate rose by more than expected to 4.2% from 3.9%, also suggesting a loss of momentum in the jobs market, but the ONS said it was still overhauling its survey which produces that figure and it was subject to volatility.
Yael Selfin, chief economist at KPMG UK, said the rise in the unemployment rate and the latest slowing of pay pressure suggested the labour market was generating less inflation.
“The UK’s labour market looks increasingly two-speed. Unemployment is rising and inactivity persists,” Matthew Percival, the Confederation of British Industry’s future of work & skills director, said.
“The labour market continues to gradually cool but continued high wage growth underlines concerns over inflation persistence,” Jack Kennedy, senior economist at jobs platform Indeed, said.
Source:
https://www.reuters.com/world/uk/uk-regular-wages-grow-60-3-months-february-2024-04-16/
BoC Governor Tiff Macklem: “As expected headline inflation came in close to 3%. … Importantly, though, measures of core inflation did tick down again and that does suggest that underlying inflationary pressures are continuing to ease,” he said.
______________________________________________________________________
Winners vs Losers
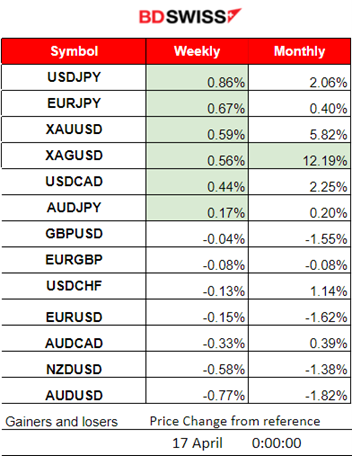
USDJPY reached the top, having 0.86% gains so far this week. Metals moved to lower positions. Silver remains on the top of the month’s list with 12.19% gains so far. The U.S. dollar remains strong and upwards.
 ______________________________________________________________________
News Reports Monitor – Previous Trading Day (15.04.2024)
Server Time / Timezone EEST (UTC+03:00)
- Midnight – Night Session (Asian)
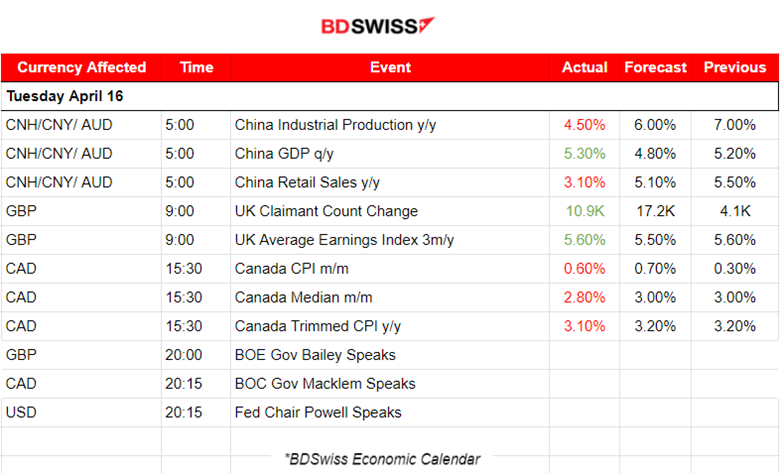
According to the GDP (q/y) figure China’s economic growth beat expectations in the first quarter, as factory output led the expansion bolstering expectations the government can hit its ambitious annual target. Gross domestic product increased 5.3% in the January-to-March period from a year earlier. Retail Sales annual change dropped to 3.10%
- Morning – Day Session (European and N. American Session)
At 9:00 the employment data ( Claimant Count change) and labour market report for the U.K. were released. Unemployment rate increased to 4.2% from the previous 3.9%. The Change in the number of people claiming unemployment-related benefits during the previous month (Claimant Count) was reported higher, near 11K. Payrolled employees in the UK fell by 18,000 (0.1%) between January and February 2024 but rose by 352,000 (1.2%) between February 2023 and February 2024. The GBP appreciated at first but the effect reversed soon. The GBPUSD overall fell to nearly 27 pips after the release.
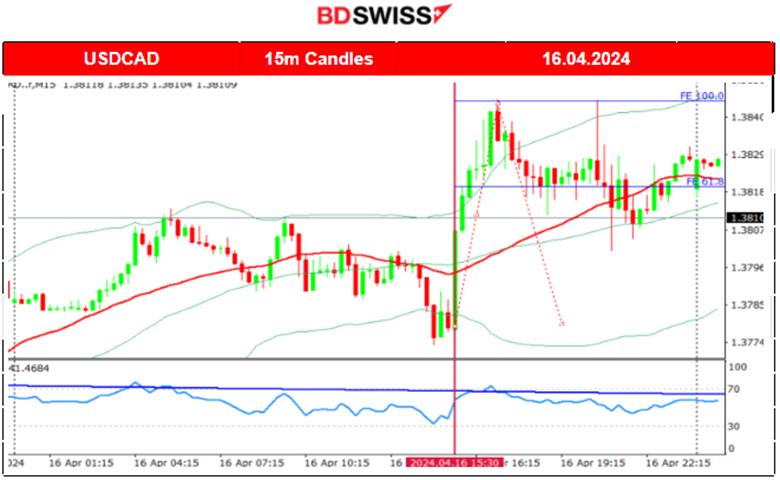
At 15:30 the inflation report for Canada shows that the Consumer Price Index (CPI) rose 2.9% on a year-over-year basis in March, up from a 2.8% gain in February. Gasoline prices contributed the most to the year-over-year headline acceleration. The USDCAD jumped 60 pips, as the CAD depreciated greatly at the time of the release.
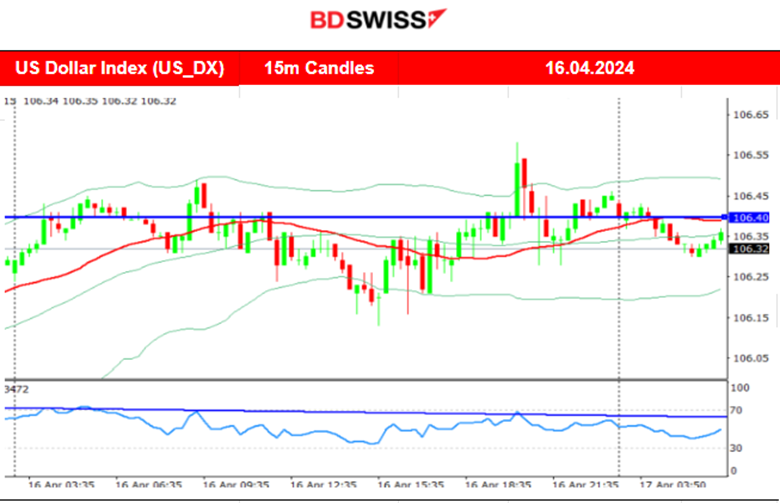
General Verdict:
 __________________________________________________________________
FOREX MARKETS MONITOR
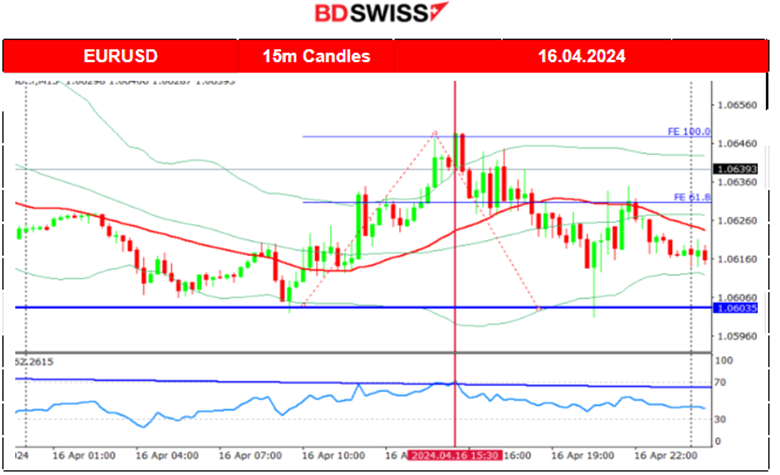
EURUSD (16.04.2024) 15m Chart Summary
Server Time / Timezone EEST (UTC+03:00)
Price Movement
EURUSD was moving to the downside early but changed direction after the start of the European session. The pair moved to the upside crossing the 30-period MA on its way up and as the USD depreciated the pair found resistance near 1.06480 before retracing to the MA. It continued to move with moderate volatility around the mean until the end of the trading day.
 USDCAD (16.04.2024) 15m Chart Summary
Server Time / Timezone EEST (UTC+03:00)
Price Movement
The USCAD started the trading day with high volatility and that escalated later during the inflation report release. After the release of the less-than-expected figures, the CAD weakened greatly causing the USDCAD to jump. After it found strong resistance it experienced a retracement to the 30-period MA.
 ___________________________________________________________________
CRYPTO MARKETS MONITOR
BTCUSD (Bitcoin) Chart Summary 1H
Server Time / Timezone EEST (UTC+02:00)
Price Movement
Bitcoin saw a drop from 71K USD in the last few days and was moving below the 30-period MA. On Saturday, April 13th, Iran launched a drone attack on Israel and Bitcoin’s price dropped sharply reaching just below the 62K USD support. Volatility remained high and after Bitcoin’s price reversed to the upside passing the 30-period MA on its way up it signalled the end of the downside movement and the start of a sideways but volatile path. It currently trades around the MA and it tests the 62K USD support. The MA however is on a downward path for now and settled currently near the 64K USD.
Crypto sorted by Highest Market Cap: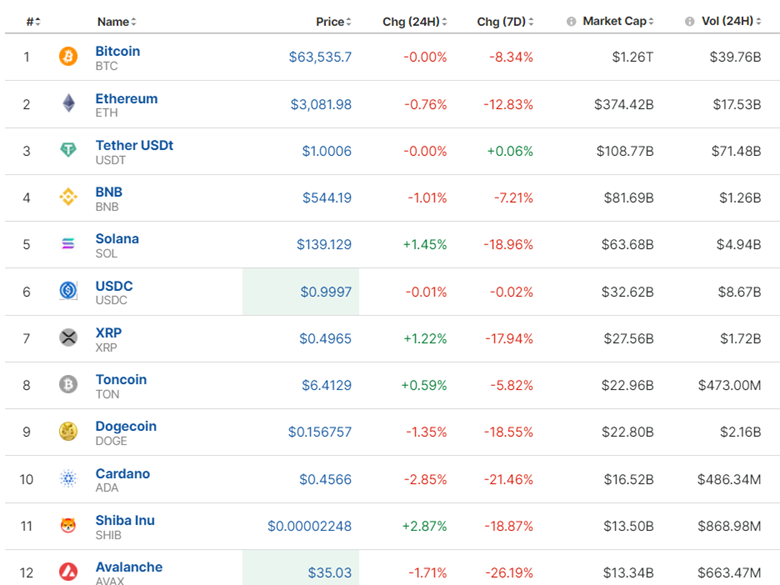
The market has not improved. Downward trend for now. The next halving is projected on April 19th 2024. Historically, halving events have been associated with increases in Bitcoin’s price. This might be the turning point this market needs.
Source: https://www.investing.com/crypto/currencies
______________________________________________________________________
EQUITY MARKETS MONITOR
S&P500 (SPX500) 4-Day Chart Summary
Server Time / Timezone EEST (UTC+03:00)
Price Movement
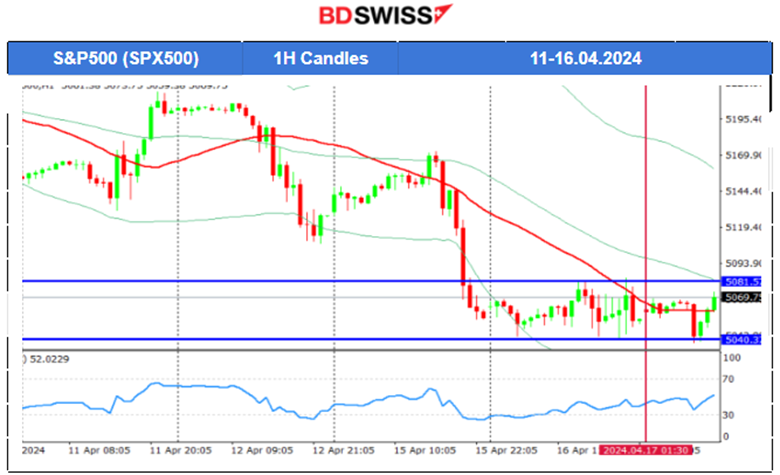
On the 12th of April, volatility continued being high and the index suffered a huge drop breaking the support at 5,135 USD, reaching the next level at 5,100 USD before eventually retracing to the 30-period MA. On the 15th of April, it was the situation when stocks plunged after the exchange opened and the index broke out from the channel as depicted on the chart. Since then the index remained stable, sideways.
 ______________________________________________________________________
COMMODITIES MARKETS MONITOR
USOIL (WTI) 4-Day Chart Summary
Server Time / Timezone EEST (UTC+02:00)
Price Movement
Following Iran’s weekend attack on Israel, the price actually dropped, flirting with the 84.3 USD/b. Its breakout occurred on the 15th of April, and as mentioned in our previous analysis, the breakout caused a significant drop reaching the support of around 83.5 USD/b. The price recovered eventually with a full reversal, crossing the 30-period MA on the way up reaching 85.5 USD/b. It retraced from that level and currently remains close to the MA. Since the 16th of April, the market has shown that volatility lowers and this was the cause of a triangle formation to appear. Currently, waiting for the breakout. According to the fundamentals, this could be to the upside.
 XAUUSD (Gold) 4-Day Chart Summary
Server Time / Timezone EEST (UTC+03:00)
Price Movement
On the 12th of April, Gold experienced a sudden drop after 18:00 and the start of the N.American session. It seems that positions on these commodities have been closed ahead of the weekend, perhaps due to increased uncertainty or information about the upcoming Iran attack on Israel during the weekend. On the 15th of April, the market opened with a gap to the upside. Despite the dollar strengthening due to better-than-expected retail sales data, Gold kept its resilience and picked up momentum, moving to the upside again. It might test the 2,400 USD next. The dollar might see some depreciation lately according to the technicals so this could boost the view for an upside momentum.
 ______________________________________________________________
News Reports Monitor – Today Trading Day (17 April 2024)
Server Time / Timezone EEST (UTC+03:00)
- Midnight – Night Session (Asian)
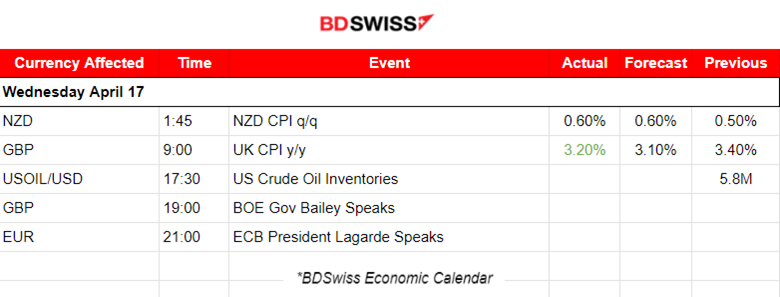
During the report at 1:45, the March annual inflation for New Zealand was reported to be higher than what RBNZ expected. New Zealand’s annual inflation rate dropped to 4% in March, from 4.7% in December. The Consumers Price Index (CPI) increased just 0.6% in the March quarter, up from 0.5% in the previous period. An intraday shock occurred at the time of the release. The NZD depreciated at first. The NZDUSD dropped near 30 pips before immediately reversing and continuing with a steady movement to the upside.
- Morning – Day Session (European and N. American Session)
At 9:00 the Consumer Prices Index in the U.K. was reported to have risen by 3.2% in the 12 months to March 2024, down from 3.4% in February. At the time of the release, the GBP appreciated heavily causing the GBPUSD to jump near 60 pips.
General Verdict:
______________________________________________________________


