PREVIOUS TRADING DAY EVENTS –10 Nov 2023
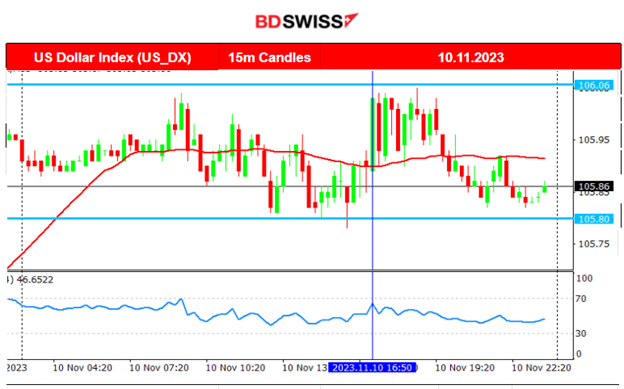
“We have had rates roll over here a little bit and I think that’s one of the reasons we have seen this rally over the last couple of weeks,” said Chuck Carlson, Chief Executive Officer at Horizon Investment Services in Hammond, Indiana. “If you think this rally has legs, yesterday gave you an opportunity to go buy some stocks today.”
“In general, the expectation investors have is that the upcoming inflation data is going to be positive for the market and I think they want to get in front of it a little bit,” said Rick Meckler, partner at Cherry Lane Investments in New Vernon, New Jersey. “People are looking at megacap tech and saying in an environment of higher rates and a slowing economy, these companies remain the best place to be and are willing to pay a premium for them,” Meckler said.
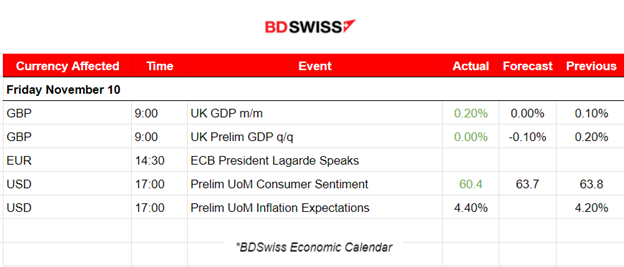
The preliminary reading of its Consumer Sentiment Index dropped to 60.4, the lowest level since May, from October’s final reading of 63.8.
“While current and expected personal finances both improved modestly this month, the long-run economic outlook slid 12%, in part due to growing concerns about the negative effects of high interest rates,” Joanne Hsu, the director of the University of Michigan’s Surveys of Consumers, said in a statement. “Ongoing wars in Gaza and Ukraine weighed on many consumers as well.”
Consumers’ outlook for inflation in the year ahead rose for a second month to a seven-month high of 4.4%, “indicating that the large increase between September’s 3.2% reading and October’s 4.2% reading was no fluke,” Hsu said.
In the U.S. overall employment is back to record highs, jobless rates are near historic lows, wages have been rising faster than before the health crisis, and overall economic growth has been running well above trend.
Gasoline prices have fallen 12% from their highs of the year set in September and are now at their lowest since March, according to the U.S. Energy Information Administration.
“The rise in consumer inflation expectations, despite falling gas prices, will be concerning to the Fed,” Grace Zwemmer, economic research analyst at Oxford Economics, wrote. “The Fed will want to see a decline as they try to bring inflation down to their target rate of 2%, and elevated inflation expectations would be another sign that rates will need to stay higher for longer.”
______________________________________________________________________
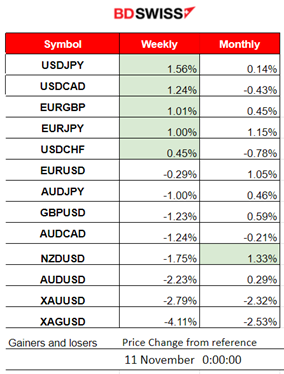
Winners and Losers
News Reports Monitor – Previous Trading Day (10 Nov 2023)
Server Time / Timezone EEST (UTC+02:00)
- Midnight – Night Session (Asian)
No major announcements, no special scheduled releases.
- Morning–Day Session (European and N. American Session)
The monthly real gross domestic product (GDP) is estimated to have grown by 0.2% in September 2023, following a growth of 0.1% in August 2023, revised down from the growth of the previous report at 0.2%. GDP, in general, showed no growth in the three months leading up to September 2023. No major impact on GBP pairs was recorded.
The report released at 17:00 showed that U.S. Consumer long-term inflation expectations increased to the highest since 2011 amid concerns about high borrowing costs and the economy’s prospects. Consumers expect prices will climb at an annual rate of 3.2% over the next five to 10 years, up from 3% a month earlier. At the time of the release, no major impact was recorded.
General Verdict:
____________________________________________________________________
FOREX MARKETS MONITOR
EURUSD (10.11.2023) Chart Summary
Server Time / Timezone EEST (UTC+02:00)
Price Movement
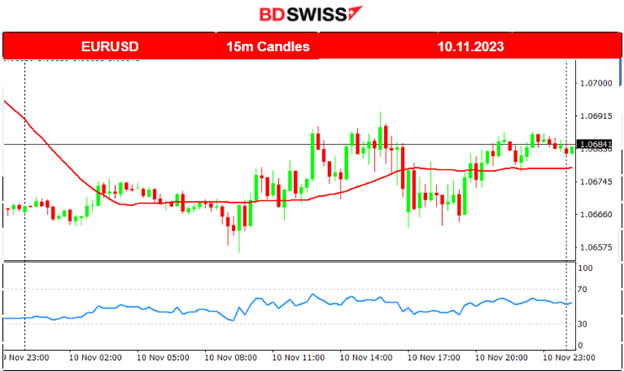
The pair started to deviate from the mean by going downwards. It changed direction to the upside and soon after it did the same multiple times. Low volatility levels, small deviations from the mean and sideways around the mean movement on Friday. Nothing significant to report except that this week we have U.S. inflation data reports that will cause volatility to burst and deviate from the levels seen on the below chart.
 ___________________________________________________________________
CRYPTO MARKETS MONITOR
BTCUSD (Bitcoin) 4-Day Chart Summary
Server Time / Timezone EEST (UTC+02:00)
Price Movement
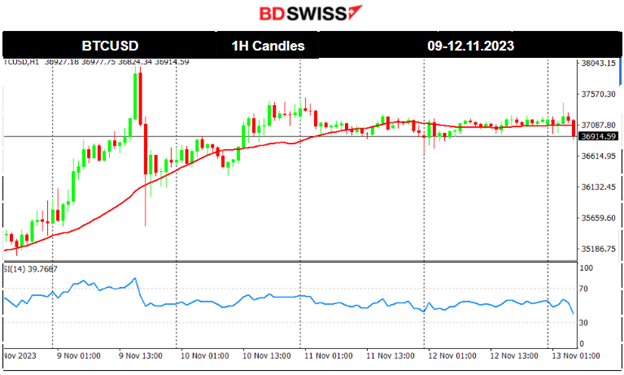
Bitcoin started to gain ground and began a path to the upside that seemed to have an exponential pace. The price broke the 36000 resistance and jumped to the next level at near 36800. Then it surprisingly jumped to the strong resistance near 38000 before eventually reversing back fully to the mean and settling near 36500.
Bitcoin’s recent upswing is mainly due to “optimism around a near-term spot Bitcoin ETF approval and a resulting short-squeeze,” Brian Rudick, a senior strategist at crypto trading firm GSR, told Fortune. Bitcoin “continues to perform well as the market focuses on the U.S. spot ETF approval process,” sources say.
https://finance.yahoo.com/news/bitcoin-approaches-38-000-ethereum-165519468.html
As per the chart below, Bitcoin moved higher again after the mean reversal and volatility dropped to lower levels with the price moving sideways around the mean, being close to 37000 currently.
Crypto sorted by Highest Market Cap:
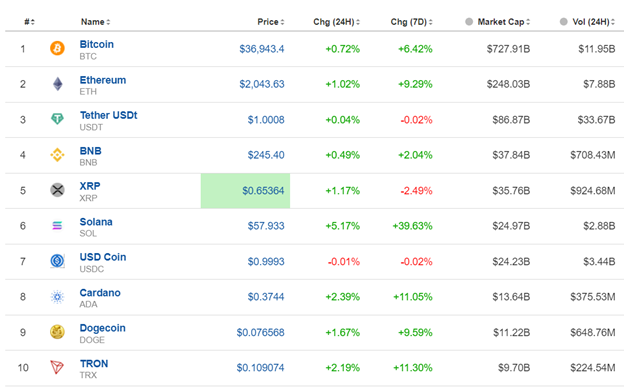
The crypto market continues with gains. It seems that optimism regarding the ETFs is growing with investors keeping more crypto in their portfolios so as not to miss the potential gains from sudden crypto-favourable announcements.
Source: https://www.investing.com/crypto/currencies
______________________________________________________________________
EQUITY MARKETS MONITOR
NAS100 (NDX) 4Hour Timeframe Chart Summary
Server Time / Timezone EEST (UTC+02:00)
Price Movement
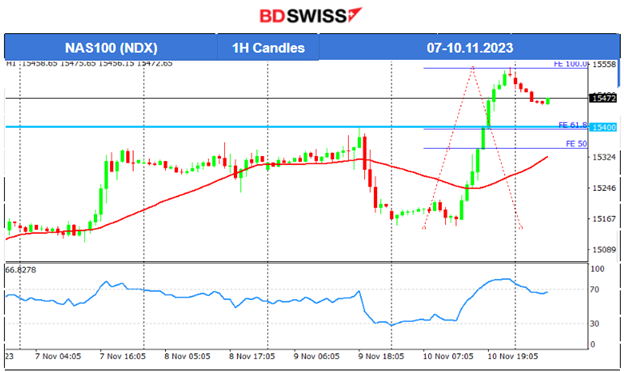
Instead of a retracement, the U.S. Stocks experienced a shock on Friday. We were expecting that the indices would break significant support levels and eventually trigger a retracement after a long and rapid movement to the upside. Instead, on friday, they jumped to higher and higher levels rapidly. The NAS100 broke the resistance at 15400 and moved higher until it reached levels near 15550 before retracing. The retracement is not completed yet technically, since the index did not reach apparently to the 61.8 Fibo level.
TradingView Analysis and Ideas:
https://www.tradingview.com/chart/NAS100/qdNfiDiR-NAS100-Retracement-13-11-2023/
 ______________________________________________________________________
COMMODITIES MARKETS MONITOR
USOIL (WTI) 4-Day Chart Summary
Server Time / Timezone EEST (UTC+02:00)
Price Movement
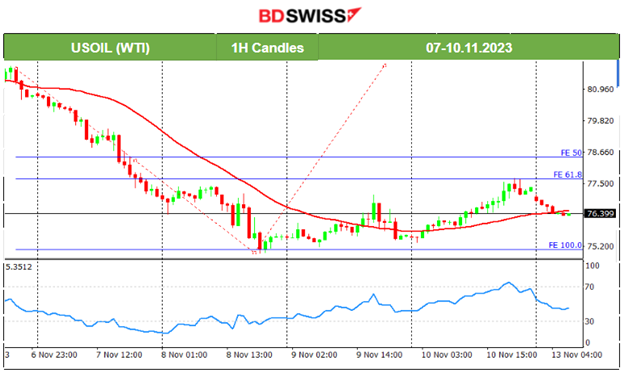
Crude movement was to the downside last week, following a short-term downward trend. It found strong support at 75 USD/b, after which the price eventually reversed to the upside, showing signs that the trend is over and confirming the bullish divergence signal. It eventually broke the 77 USD/b moving to the upside reaching near 78 USD/b in order to complete the retracement to the 61.8 Fibo level but soon later reversed back again to the 30-period MA.
XAUUSD (Gold) 4-Day Chart Summary
Server Time / Timezone EEST (UTC+02:00)
Price Movement
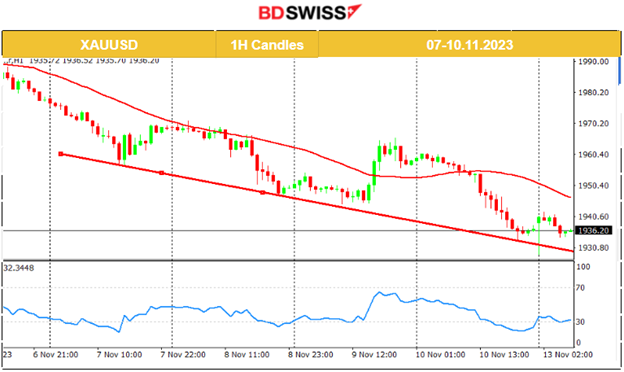
We had a clear downward trend last week regarding Gold’s price.
The RSI showed signals of a bullish divergence (higher lows) while the price was showing lower lows. On the 9th Nov, the price reversed. It jumped higher crossing the 30-period MA, confirming the bull signal and retraced back to the mean after finding strong resistance.
It, however, reversed again on the 10th Nov, to the downside this time. Wall Street’s main indices ended with big gains on Friday, boosted by heavyweight tech and growth stocks as Treasury yields calmed. Metals lost ground instead. Gold broke the support near 1945 USD/oz and currently remains under the 30-period MA testing levels near 1935 USD/oz.
 ______________________________________________________________
News Reports Monitor – Today Trading Day (13 Nov 2023)
Server Time / Timezone EEST (UTC+02:00)
- Midnight – Night Session (Asian)
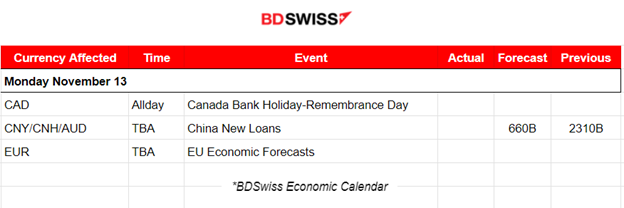
No major announcements, no special scheduled releases.
- Morning–Day Session (European and N. American Session)
No major announcements, no special scheduled releases.
General Verdict:
______________________________________________________________


