Rates as of 05:00 GMT
Market Recap
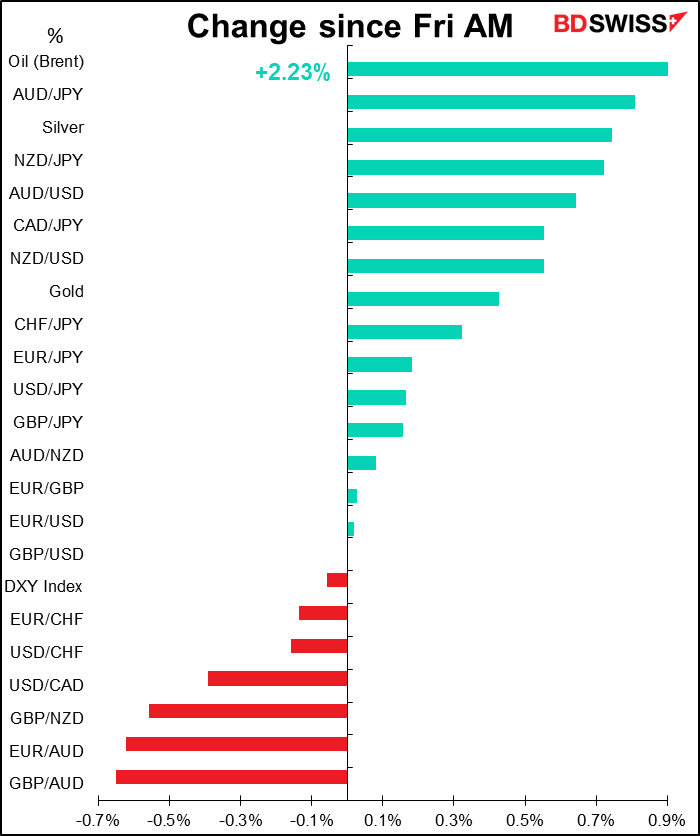
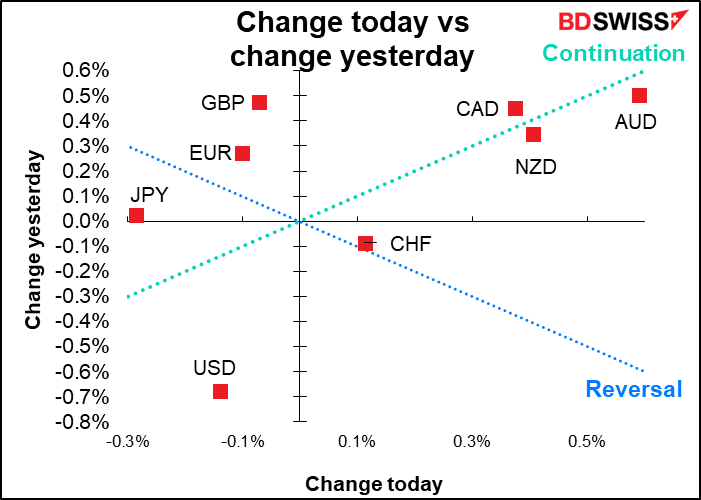
Risk appetite has come back! See my Weekly Outlook for an explanation. To sum up, financial conditions have tightened considerably as the markets front-runs central bank tightening. Because of this, inflation expectations have come down. Less expected inflation means less expected tightening. That leads to a revival in growth expectations.
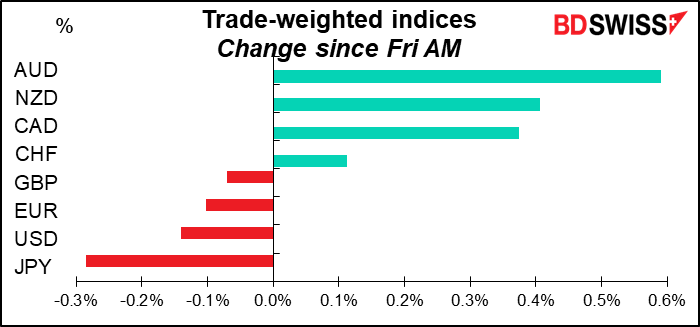
The result is a recovery in risk appetite. Along with that, the commodity currencies recovered and the safe-haven yen and USD fell. No big surprise there.
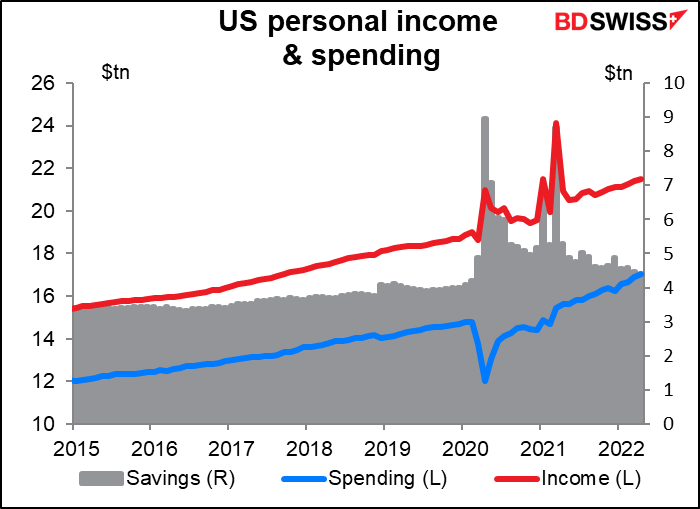
Markets were encouraged Friday by the personal income & spending data (see above). Although incomes were up less than expected, spending was up more than expected, showing that consumers are willing to run down the large amount of savings they accumulated during the pandemic to maintain their standard of living. The household savings rate has fallen to 4.4%, the lowest since 2008.
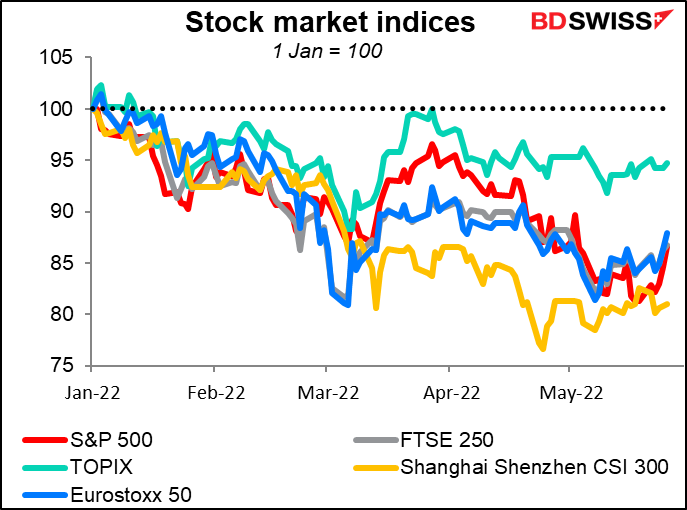
Stocks have been recovering as well. The S&P 500 and NASDAQ were both up over 6% last week.
Other points
Just FYI, there may be a meteor shower tonight. The recent lunar eclipse was a bust where I live, but I hope to see some shooting stars tonight. You can read all about it here. Unfortunately it’s not certain – some experts expect we’ll see it, some don’t.
Commitments of Traders (CoT) report
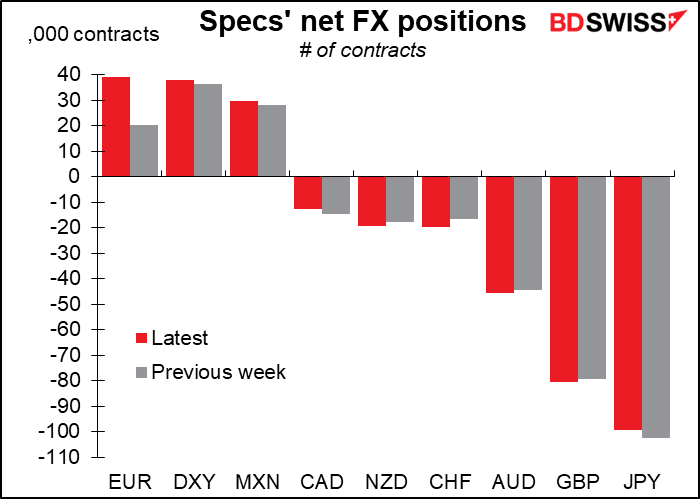
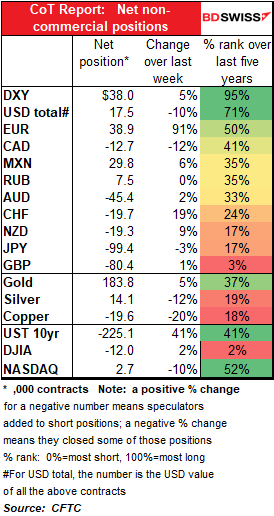
The only major change this week: speculators became significantly more bullish EUR as EUR/USD recovered to the 1.07 level. This obviously reflects the increasing conviction in the market that the European Central Bank (ECB) will soon embark on a tightening cycle, while at the same time a rethink of how much the Fed is likely to tighten. Outside of that, all the other changes in positioning were small. Specs sold into CHF strength while NZD shorts continued to increase.
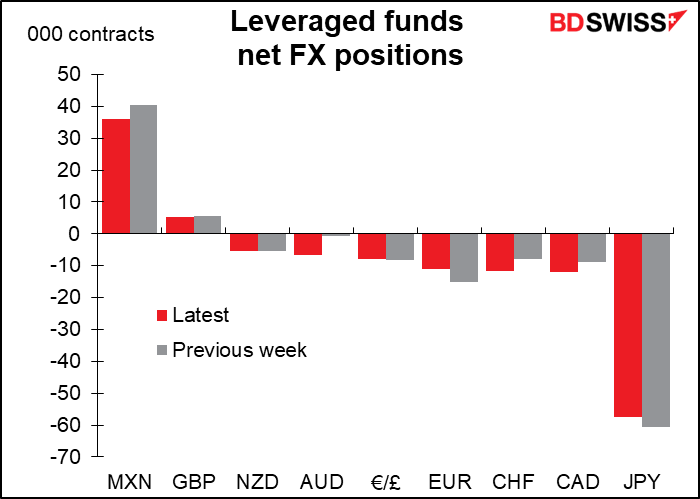
Hedge funds on the other hand are still short EUR, although they trimmed their EUR shorts a bit last week. Their biggest move in percentage terms was going from only slightly short AUD to significantly short. Some of the other moves were significant in percentage terms if not in absolute value, such as a 47% increase in short CHF and 38% increase in short CAD.
Hedge funds on the other hand are still short EUR, although they trimmed their EUR shorts a bit last week. Their biggest move in percentage terms was going from only slightly short AUD to significantly short. Some of the other moves were significant in percentage terms if not in absolute value, such as a 47% increase in short CHF and 38% increase in short CAD.
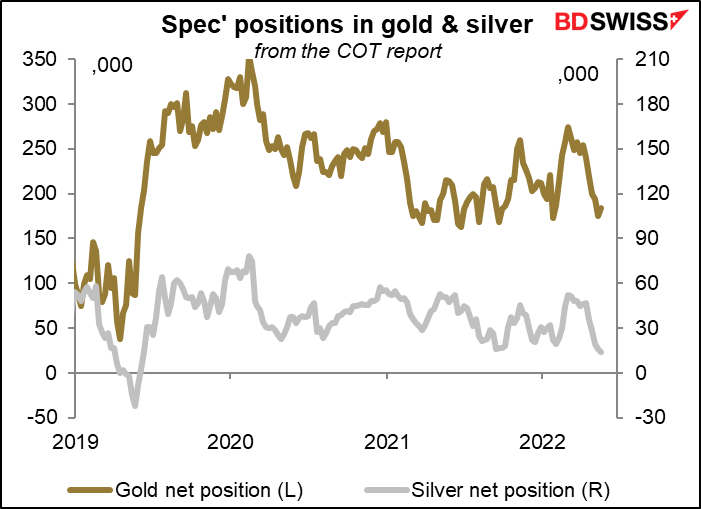
Precious metals: Specs’ holdings of gold ticked up slightly after five consecutive weeks of decline but silver longs had their fifth consecutive fall.
Overall, speculators are extremely long DXY – their continued USD bullishness — and extremely short GBP. DJIA positions are also unusually short.
Today’s market
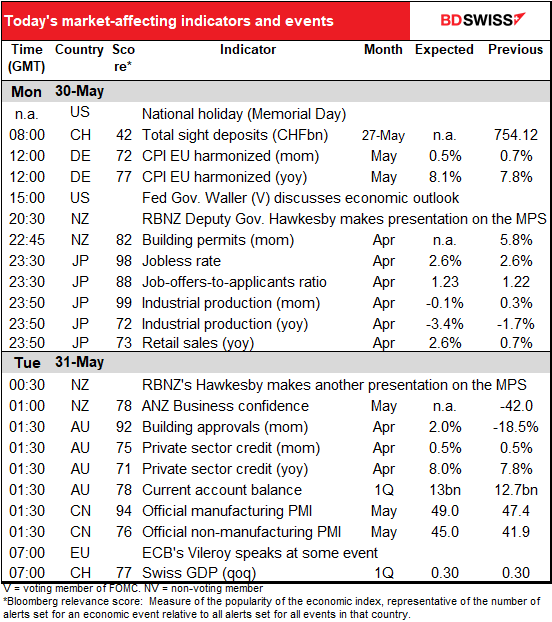
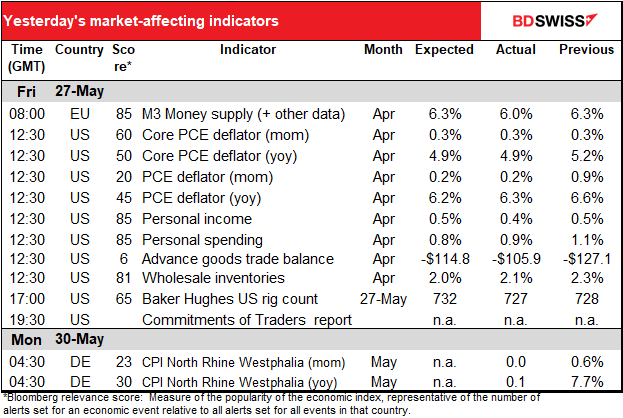
Note: The table above is updated before publication with the latest consensus forecasts. However, the text & charts are prepared ahead of time. Therefore there can be discrepancies between the forecasts given in the table above and in the text & charts.
The US is on holiday for Memorial Day, better known as The Official Start of Summer. In the old days, women were not supposed to wear white dresses before Memorial Day nor after Labor Day (the first Monday in September). I have no idea whether such fashion norms are still observed.
Memorial Day is supposed to be for mourning the US military personnel who have died while serving in the US armed forces. This year it’ll be for mourning those killed by 18-year-old kids who could buy military-grade weapons & ammo three years before they’re allowed to drink (I am not making this up). One wonders what they would’ve done if they were drunk. Perhaps crashed their cars on the way and only killed themselves (one hopes).
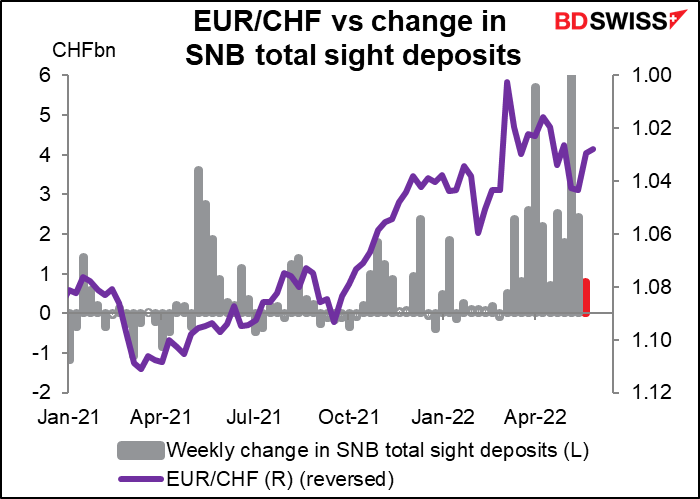
As usual, we start the week with the ever-lovin’ Swiss sight deposits, a proxy for Swiss National Bank (SNB) intervention in the FX market. Last week they rose by a mere CHF 738mn, the smallest rise in a month. Most weeks, intervention is another decimal place (billions, not millions). This despite a fall in EUR/CHF to 1.029 from 1.043. Perhaps the SNB is gradually letting CHF appreciate to hold down imported inflation, as they’ve been suggesting they might?
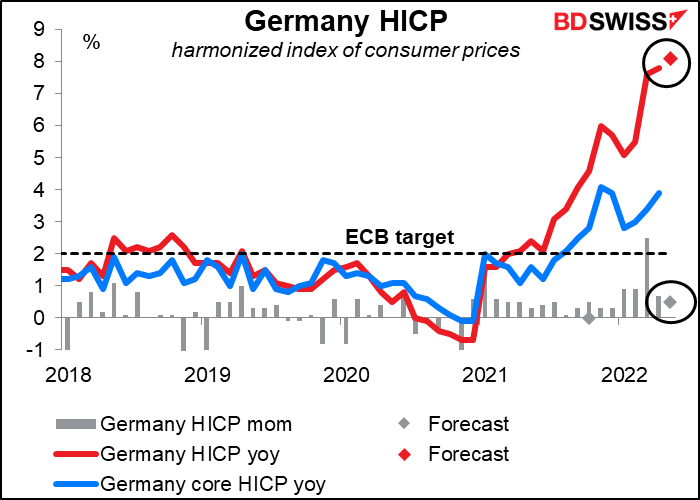
Germany’s harmonized index of consumer prices (HICP), the version of the consumer price index (CPI) that’s consistent across all Eurozone countries, is expected to go up, up, and away! Over 8% yoy. Today’s German inflation data will set the scene for tomorrow’s Eurozone inflation data. It’s likely to strengthen the hands of the hawks on the European Central Bank (ECB) Governing Council, such as Dutch Central Bank Gov. Knot, who wants to see a 50 bps hike ASAP. EUR+
With the US on holiday today, that’s about it for the European and North American day.
Overnight, we get the usual end-of-month data dump from Japan.
The unemployment rate is expected to stay at its (relatively low) level while the job-offers-to-applicants ratio is forecast to creep up one tic. This is good news but probably not enough good news to move the currency.
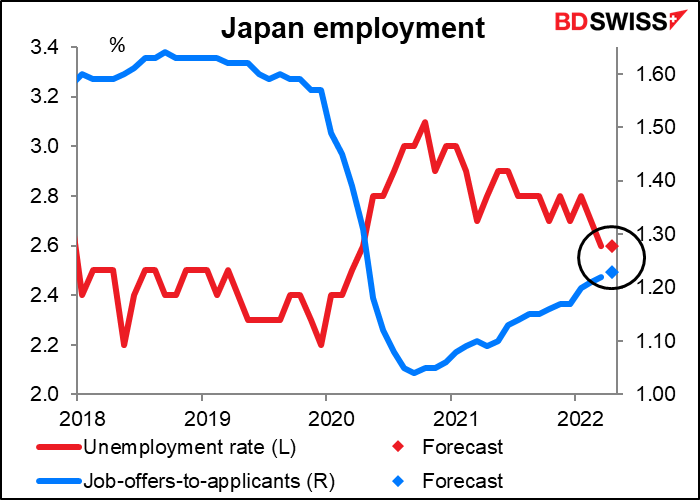
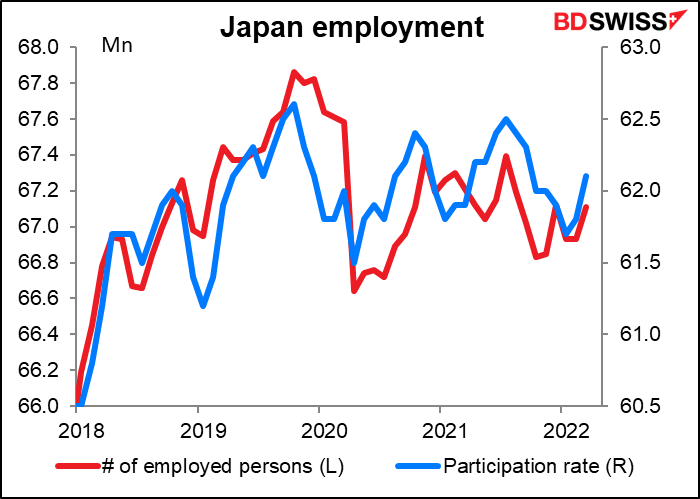
Japan’s employment situation isn’t that great. It perhaps deteriorated less than some other countries, but the recovery has been more sluggish. Neither the number of people employed nor the participation rate has recovered to anywhere near the pre-pandemic level. This is a sharp contrast with the 2%-3% annual rise in employment from 2013-2019. (My daughter said that a lot of students who graduated last year with job offers in hand got a letter saying “sorry, we decided not to take any new employees this year.”) One hopes that as the pandemic recedes (please!) and global trade picks up, Japan labor demand will too.
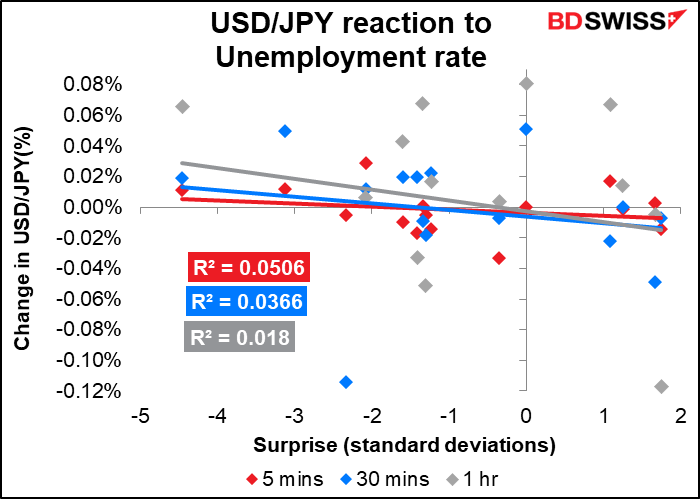
Despite its high Bloomberg relevance score, the unemployment rate doesn’t have a consistent impact on USD/JPY.
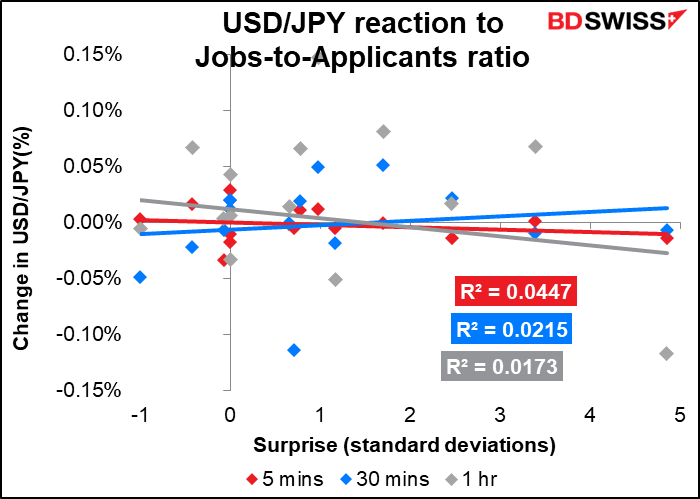
Nor does the job-offers-to-applicants ratio. I suspect this is because the Bank of Japan is on hold and monetary policy isn’t going to change no matter what the data says.
Japan’s industrial production is forecast to be down a slight 0.1% mom.
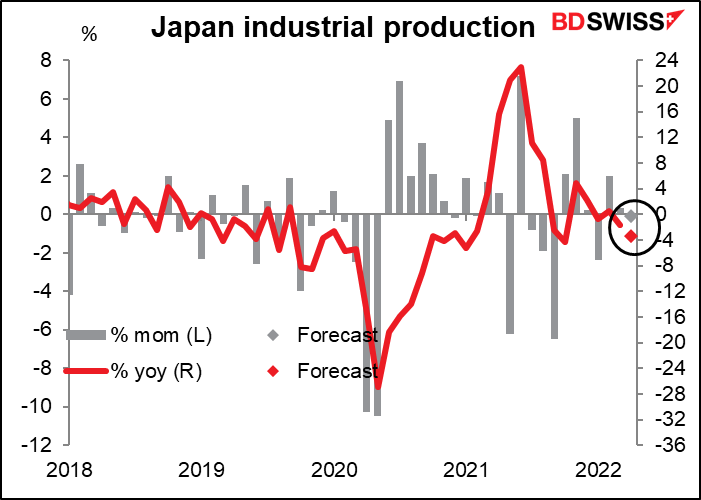
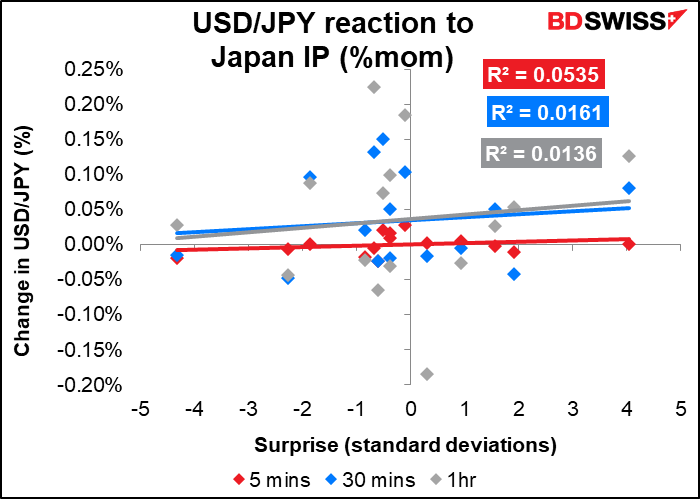
The month-on-month change in industrial production has the highest Bloomberg relevance score of any Japanese indicator. Nonetheless it too has only a mixed impact on USD/JPY.
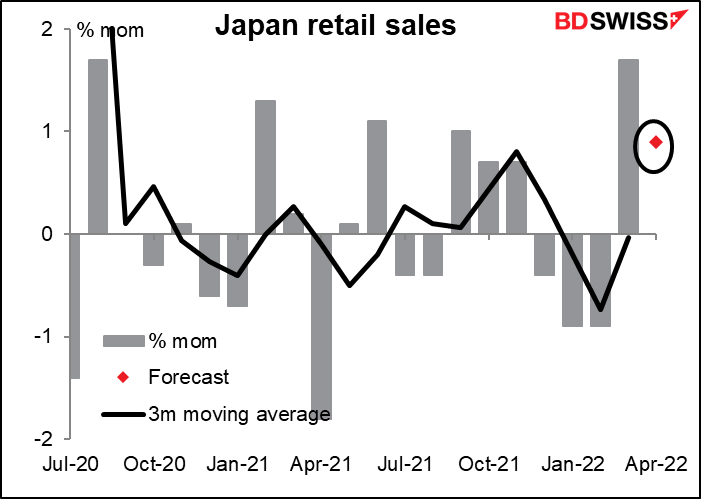
With employment stagnant, retail sales aren’t doing so great, either. They’re expected to be up in April, but the six-month moving average shows no growth at all on average each month.
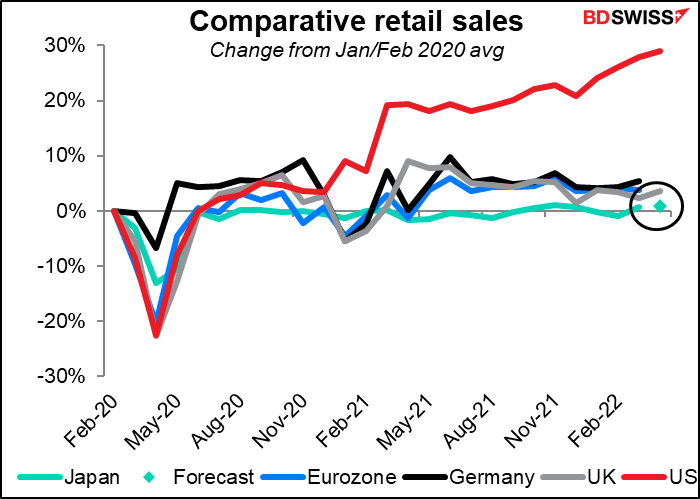
On this forecast, sales would be +0.9% above pre-pandemic levels, the most sluggish of the major economies. (The US is #1 – I wonder how much of that is spending on guns, which soared during the pandemic?)
We then get a slew of Australian indicators.
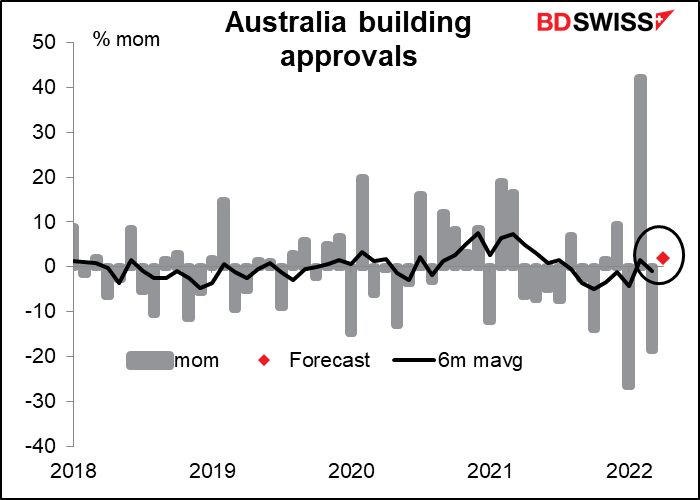
The most important one is the building approvals. The pandemic and weather disruptions have caused the number to be incredibly volatile this year: -27% mom in January, +42% mom in February, -19% in March. Much of the fall is in apartment buildings, which have come under pressure due to a shortage of foreign students to rent to (COVID-19 restrictions) plus supply chain and labor force disruptions that have caused building times and costs to blow out. Demand for multi-unit buildings should recover a bit this month but overall building is likely to remain soft – and the Reserve Bank of Australia (RBA) interest rate hikes have yet to feed through.
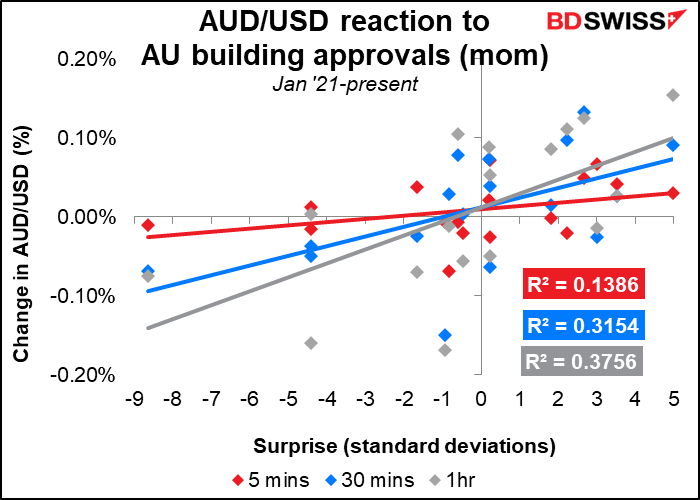
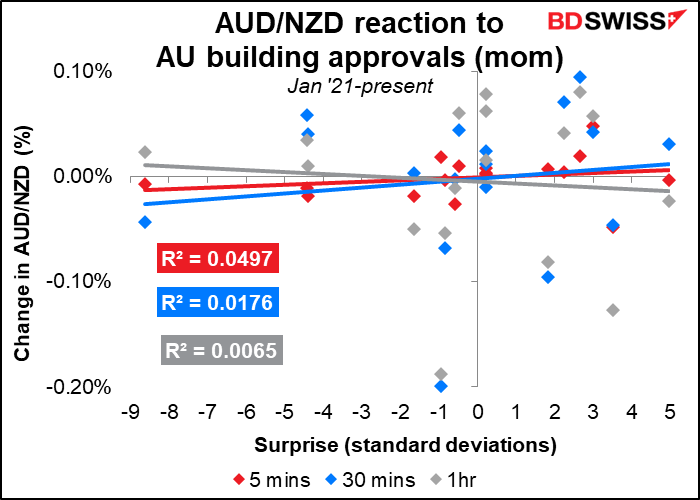
If you’re thinking of trading this indicator, past performance suggests you’d be better off trading AUD/USD rather than AUD/NZD. The indicator has a close and appropriate relationship with AUD/USD (that is, when it beats expectations AUD tends to strengthen, as you’d expect) that only gets stronger as the market absorbs the data…
…but the relationship with AUD/NZD is much less consistent.
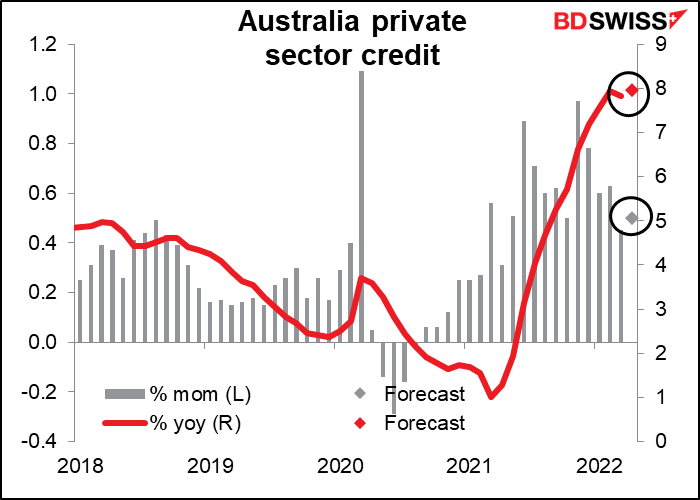
Private sector credit has been booming recently. The February rate of 7.9% yoy was the highest in the post-Global Financial Crisis period, although well below the Dec 2007 peak of +16.5% yoy. Households and businesses have both stepped up their borrowing, as the Reserve Bank of Australia no doubt intended when it cut rates to near zero. The market consensus forecast for April of +8.0% yoy would be the post-GFC high. Now as rates rise – the RBA hiked to +0.35% from +0.10% on May 3rd — one would expect to see borrowing slow, but that’s for future months. AUD+
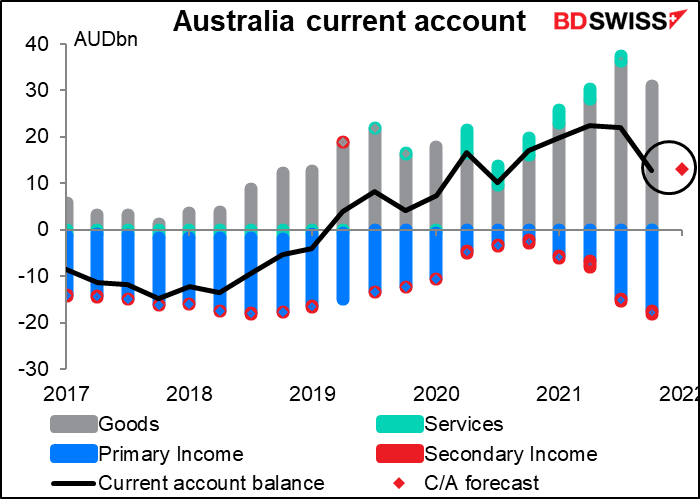
Australia’s current account balance is expected to be in surplus for the 12th consecutive quarter, although down sharply from the record AUD 22.4bn in Q2 last year. The trade surplus in Q1 was AUD 29.2bn (based on the monthly numbers), down slightly from AUD 31bn in Q4 2021. The “primary income” deficit – the net flow of money abroad from profits, interest and dividends plus net remittance flows from migrant workers – has widened back out significantly after narrowing in the wake of the pandemic. That will keep the overall current account surplus from regaining its previous highs even if exports stay buoyant.
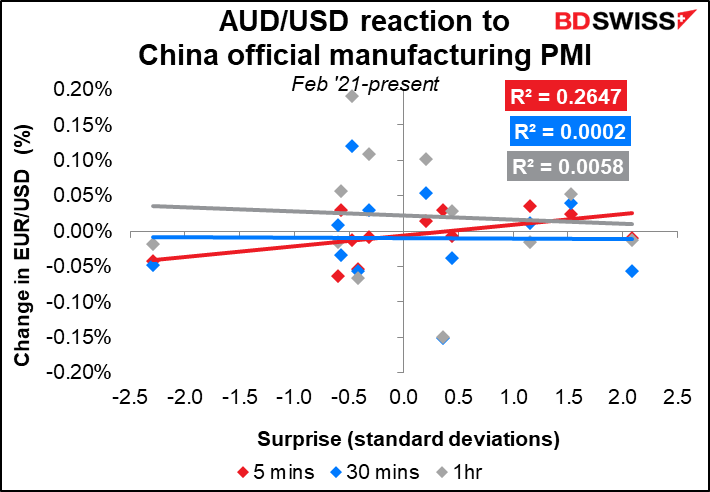
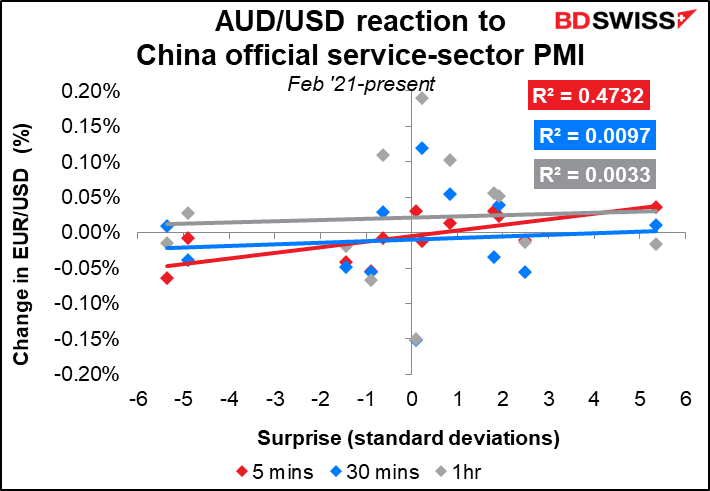
China’s official purchasing managers’ indices (PMIs) (as opposed to those put out by Caixin/Markit) are both expected to be sharply higher and yet still below the 50 “boom-or-bust” line that signifies an expansion. Services in particular are expected to show a hefty but still insufficient recovery.
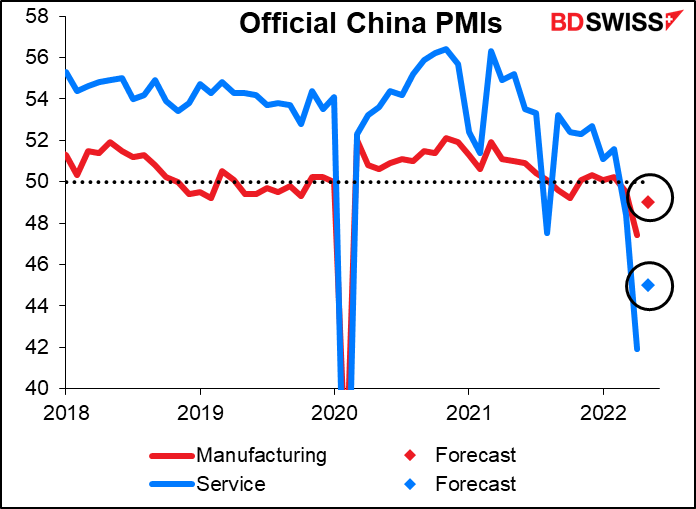
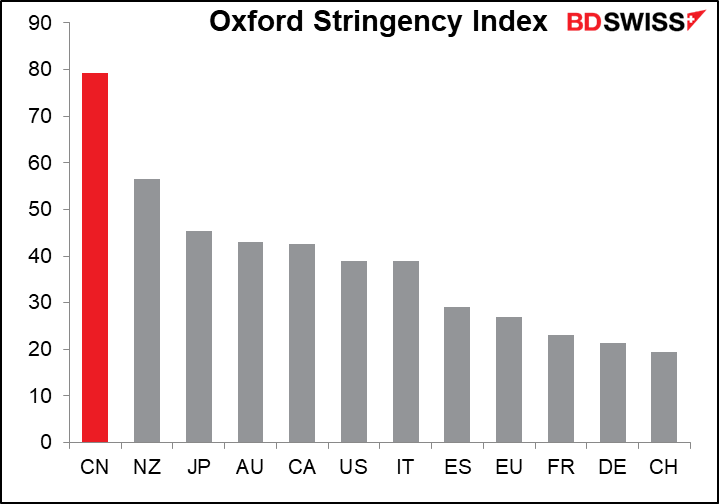
The contraction is no doubt due to the country’s relatively strict lockdown measures — almost as strict as they’ve ever been. It may be the most tightly locked-down country in the world, still.
AUD/USD seems to respond to the China PMIs, at least initially. Recently the service-sector PMI has had a bigger impact than the manufacturing PMI. The impact of both seems to fade rather quickly though.