

Rates as of 04:00 GMT
Market Recap
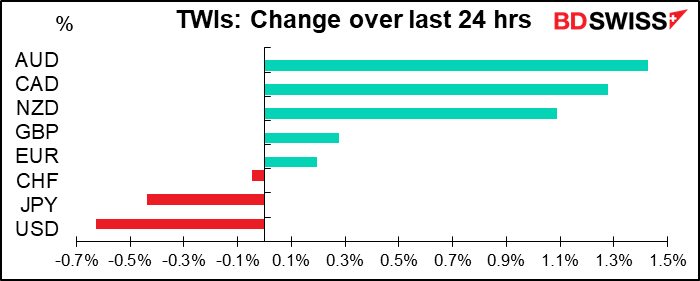
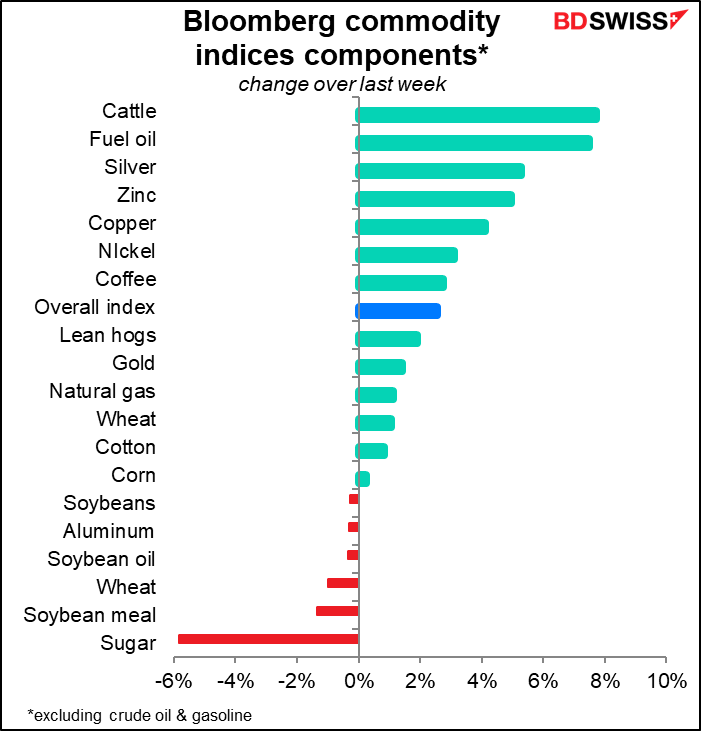
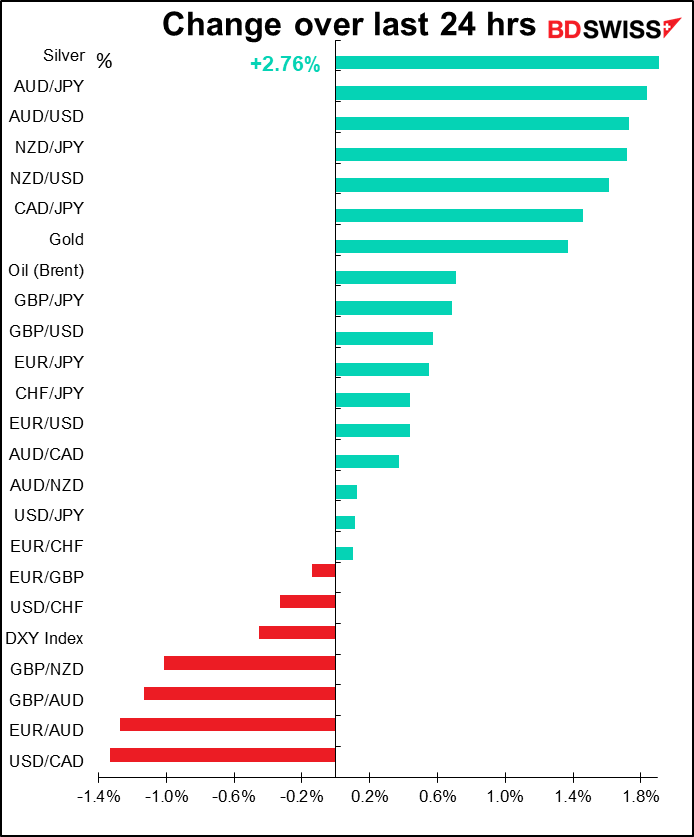
A notably strong rally in the commodity currencies as the rally spread out of the energy complex into a wider range of commodities. Commodity prices have been beaten down this year as demand for everything besides toilet paper collapsed, but as many countries start to ease lockdown requirements, expectations are that demand will gradually recover.

Sentiment was also boosted this morning by news that US and China trade negotiators spoke by phone and vowed to continue to support the Phase One trade deal. Markets were hit on Wednesday after Trump said the US would be evaluating whether China had complied with the terms of the deal, which require the country to buy an extra $200bn a year of US goods. The Office of the US Trade Representative (USTR) posted a statement on its website today saying that “both sides agreed that good progress is being made on creating the governmental infrastructures necessary to make the agreement a success.” That suggests that Trump’s attempts to blame China for the COVID-19 virus are not likely to spill over into the trade arena but rather remain simply theater aimed at distracting his easily-distracted myrmidons from noticing that his appalling incompetence has resulted in the deaths of tens of thousands of people oh pardon me I shouldn’t go on like this.
The improving outlook boosted “risk on” sentiment and USD and JPY weakened. The dollar was also hit by dovish rhetoric from a number of Fed speakers, who said they expected the recovery in the US would only be gradual and extended. Their comments drove Fed fund futures to price in a negative policy rate for late this year and early next year, even though Richmond Fed President Barkin (NV) said he doesn’t see negative rates as a suitable policy for the US.

The amazing thing to me though was the recovery in EUR. Following Tuesday’s ruling by the German Constitutional Court that ECB policy partly violates the German constitution, ECB President Lagarde Thursday said the ECB will refuse to recognize the German court’s jurisdiction. The ECB may refuse to recognize their jurisdiction, but what about the Bundesbank? Can they ignore their national court? The ruling thereby sets up a Eurozone constitutional crisis that has the potential to delay and distract officials from acting quickly in this emergency. If worst comes to worst, the ECB may carry on undeterred, but the Bundesbank will have to stop participating. In effect Germany may have to withdraw from the Eurosystem. Ultimately I would assume German Chancellor Merkel will have to intervene in some way. The whole affair seems to me to be terribly EUR-negative. See this week’s Weekly Outlook for more details.
Today’s market
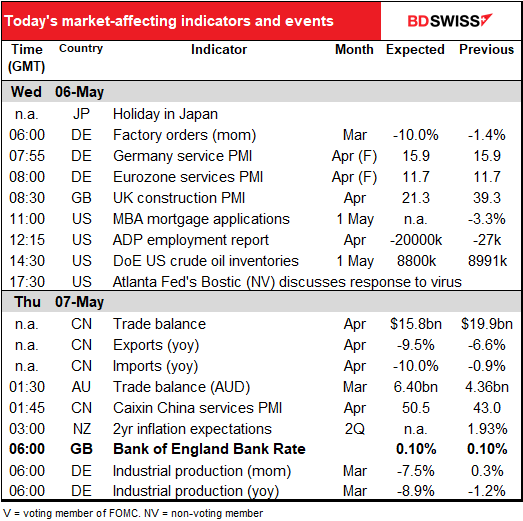
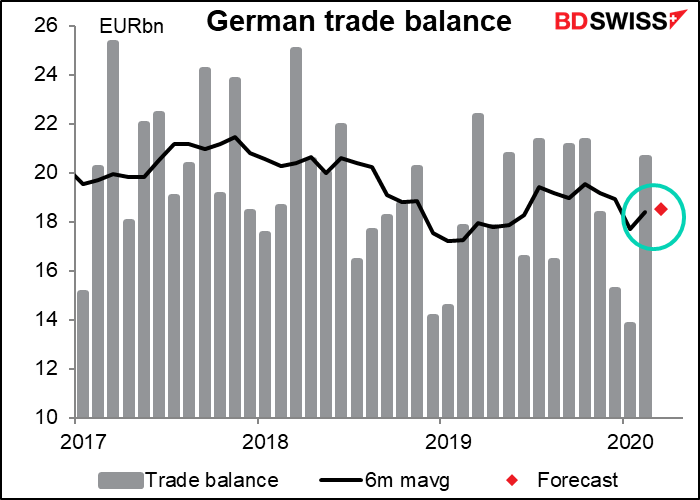
Germany’s trade balance has been holding up remarkably well.
But that’s not what you’re interested in today. I also suspect you don’t care very much about Canadian housing starts, either. No, what’s on your mind – well, insofar as the markets are concerned – is the one and only US nonfarm payrolls. The granddaddy of all economic indicators.
Last month it didn’t fully reflect the carnage in the US labor market because of the timing of the survey, but this month – watch out! This will be one for the record books no doubt.
I ran through this in detail in my Weekly Outlook last week, but given the focus on this statistic – and the fact that I get paid by the word – I’ll repeat it all here anyway.
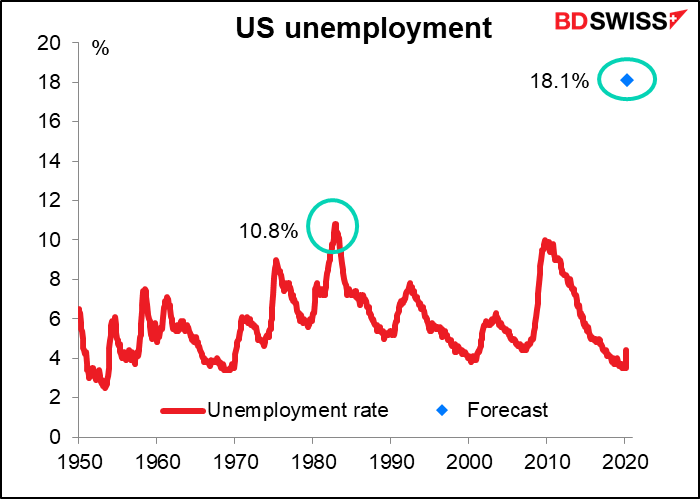
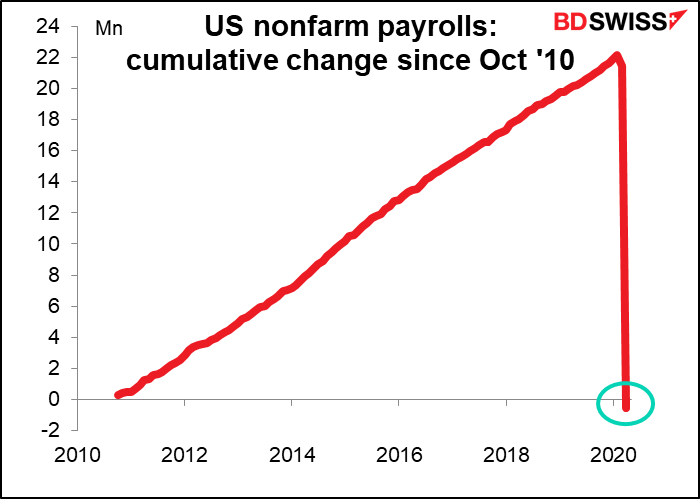
We’ve seen a lot of unprecedented statistics recently, but this one is likely to be The Mother of All Unprecedented Statistics. Nonfarm payrolls are forecast to fall by an astonishing 22mn and the unemployment rate is expected to leap to 18.1%. And these numbers aren’t the whole story. The jobless claims show that 31mn people filed for unemployment benefits in March and April, meaning that these figures wouldn’t count 8mn people who have already lost their jobs – and more will lose theirs before the May figures are calculated.
Since Oct. 2010 there were 113 consecutive months of increases in the NFP, the longest string on record, for a net increase of 22.13mn jobs. If this month’s forecast is correct, all 113 months of payroll gains will be wiped out in two months.
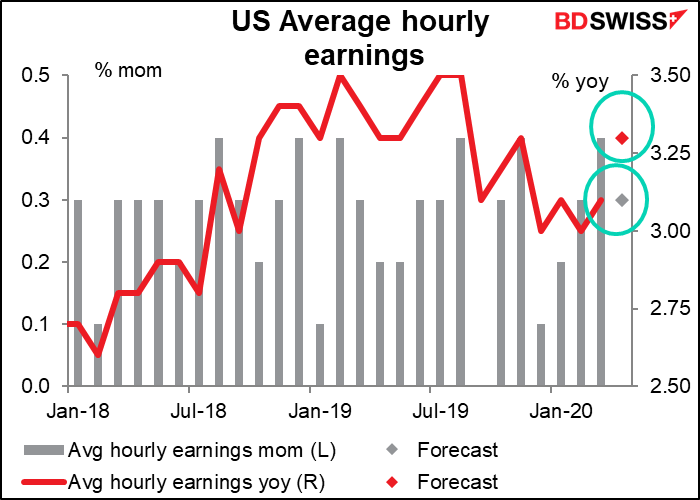
The average weekly earnings figure is expected to show an acceleration in earnings. Don’t be fooled! If it does, it’s only because so many lower-paid people in the service industry have lost their jobs that the average has risen.
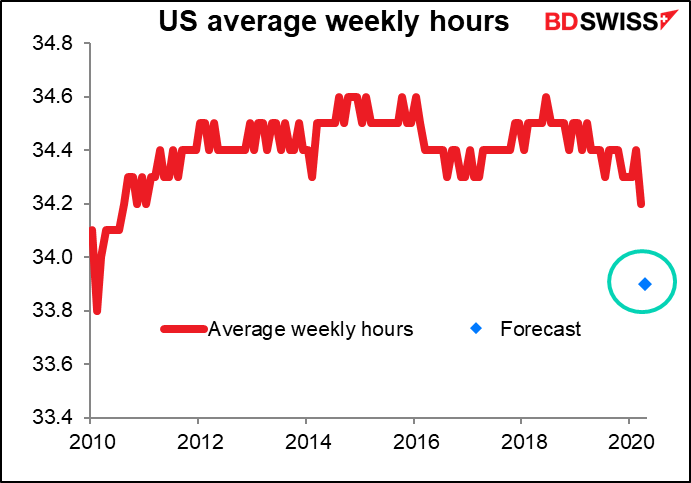
One figure that up to now only economists have paid attention to is the average weekly hours of all private-sector employees. That’s because until recently, this has been a deathly boring number –ranging between 34.3 and 34.6 since March 2011. Snore! But it’s expected to fall this month, and the implications of this are serious. Many people are paid by the hour, so if they work fewer hours, they make less money. And if they make less money, then they usually spend less money too. The rule of thumb is that one-tenth of an hour on the average workweek is equivalent to around 250k jobs in terms of aggregate income creation, according to Bloomberg economist Carl Riccadonna. So the expected fall in average hours is equivalent in spending terms to another 750k people losing their jobs – not a lot in the face of this month’s expected 22mn lost jobs, but something to watch for as the economy recovers.
Market impact: Although the data are likely to be disastrous, I don’t think the market reaction will be especially dramatic. US Q1 GDP was worse than expected, and yet stocks rallied on the day as there was some hope for a drug to treat the virus. The fact is, a) no one has any idea what the indicators are going to be nowadays; b) everyone is braced for them to be unparalleledly bad in any case; and c) there’s not likely to be any immediate change in market expectations for official policy no matter how bad they are, because governments are already planning on doing everything that they can anyway.
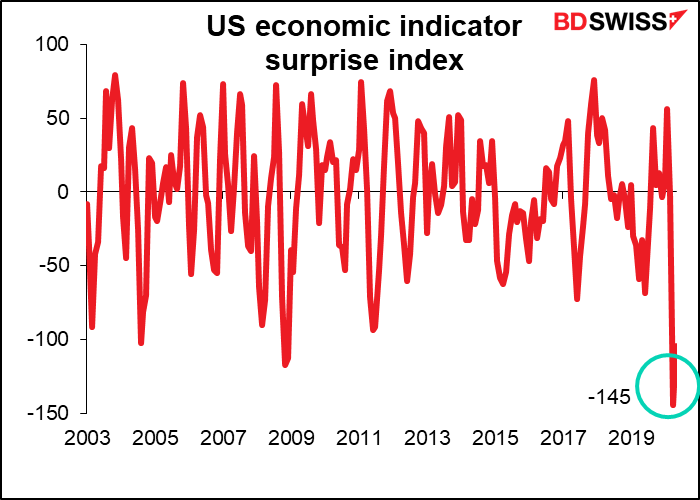
The US economic indicator surprise index, a measure of how economic statistics compare to economists’ estimates, hit a record low of 144.60 on 30 April. (Data back to 2003.) A minus figure indicates that the statistics as reported are worse than expected. I should add that the record high was 97.50 (March 2011). The figure shows that economists’ uncertainty about economic indicators is the highest it’s been in at least the last 17 years, and that the data is coming in worse than the profession as a whole imagined. As Powell said, there’s “an unusually new kind of uncertainty added on top of our regular uncertainty.”
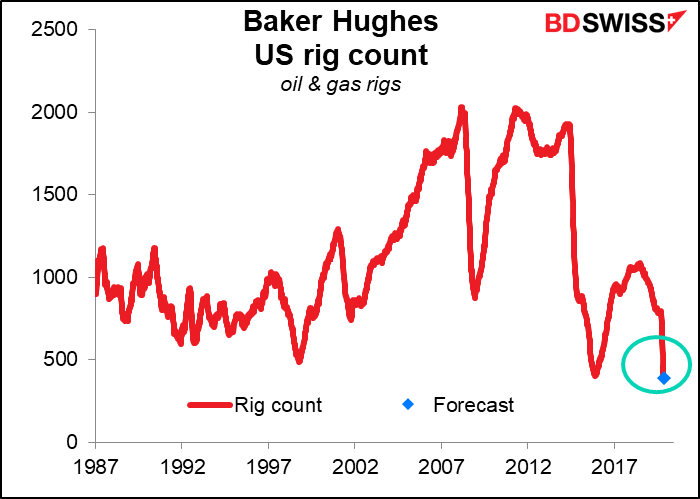
Finally, the Baker Hughes rig count is expected to show that the number of oil & gas rigs has fallen to the lowest number (388) since records began in 1987. The previous low was 404 in May 2016. The data suggest that Saudi Arabia and Russia are winning the oil price war: the US shale oil industry is indeed shutting down in the face of lower prices.
Watch Marshall Gittler Market Preview video here:


