Rates as of 05:00 GMT
Market Recap
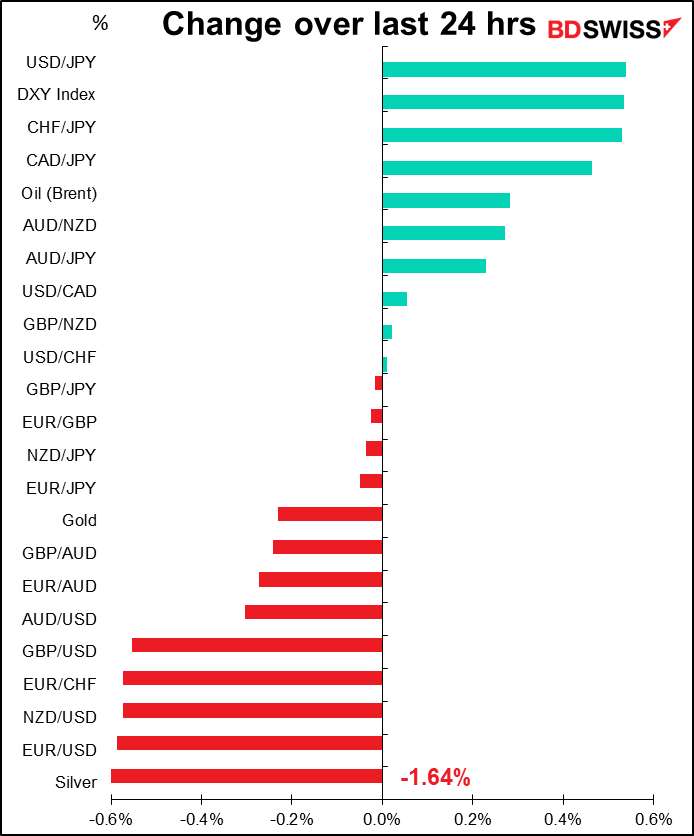
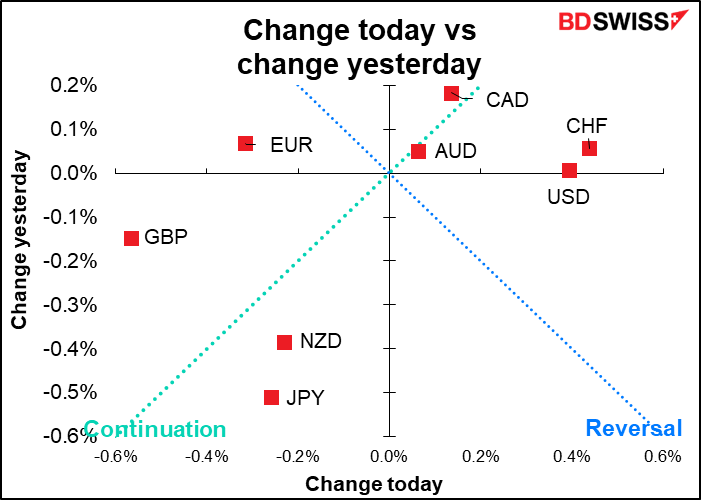
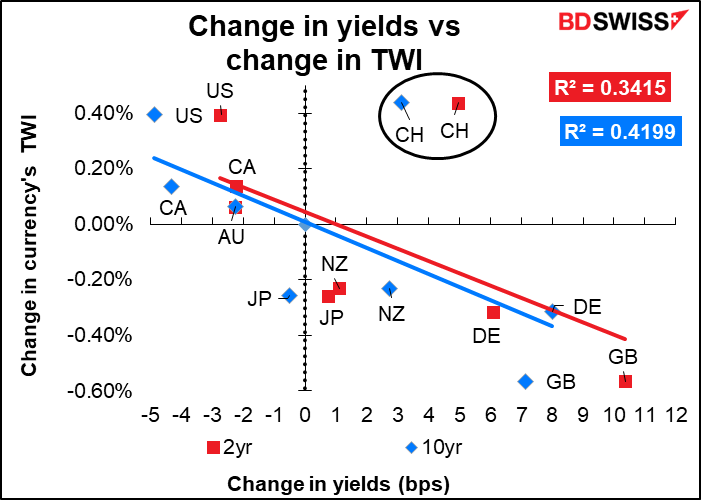
Currencies yesterday moved largely on interest rate changes.
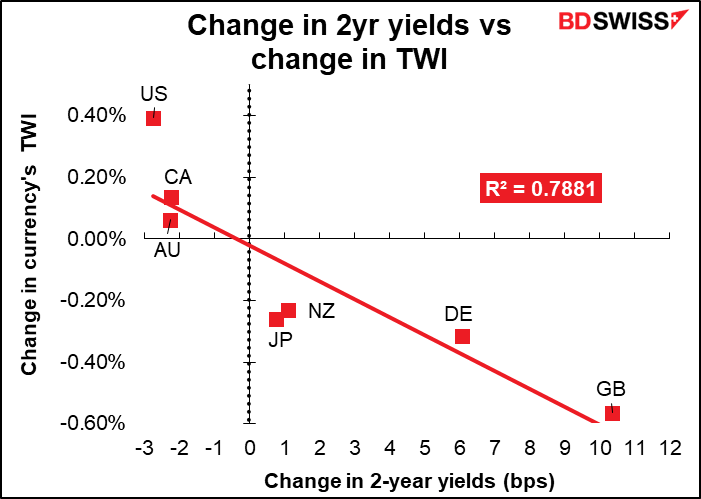
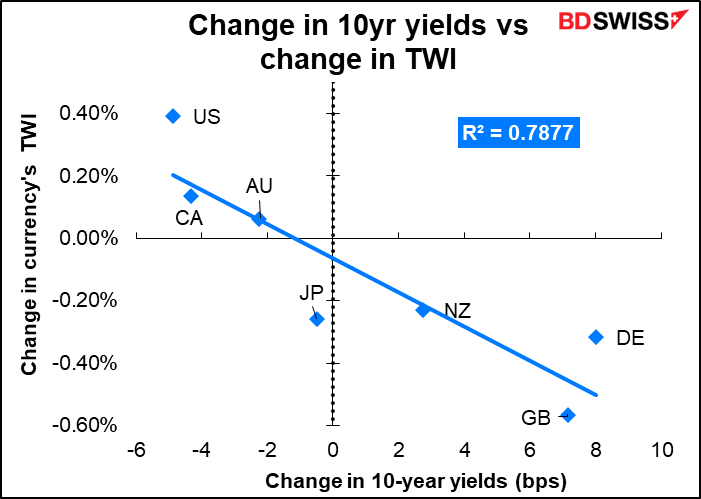
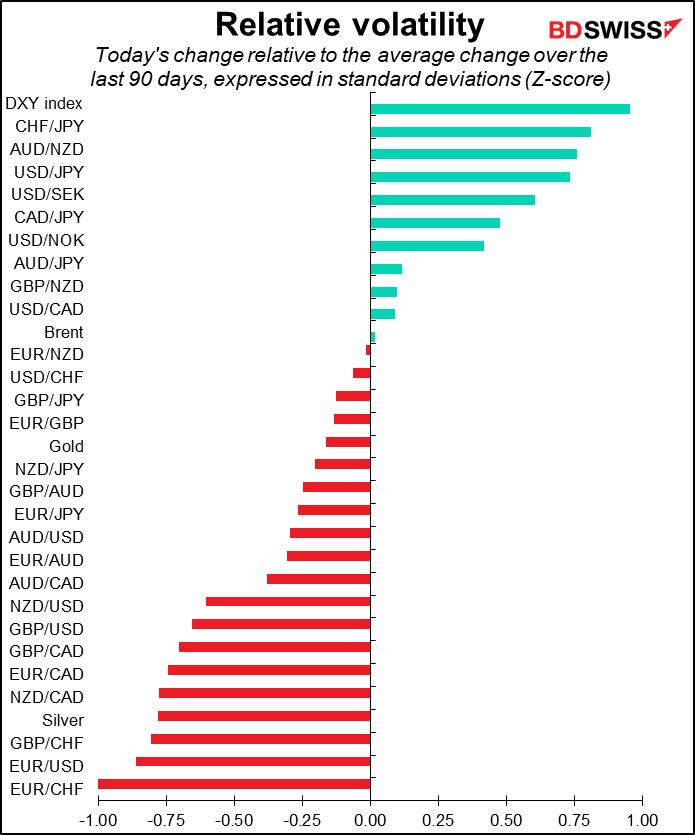
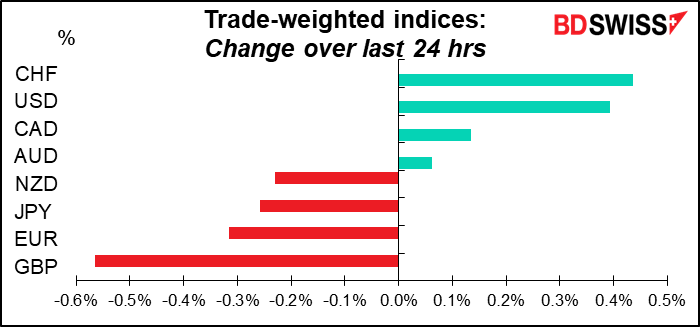
Sharp-eyed viewers may notice that CHF isn’t included in the above charts. That’s because CHF was the outlier yesterday –including it significantly lowers the R-squared (the “goodness of fit” measurement).
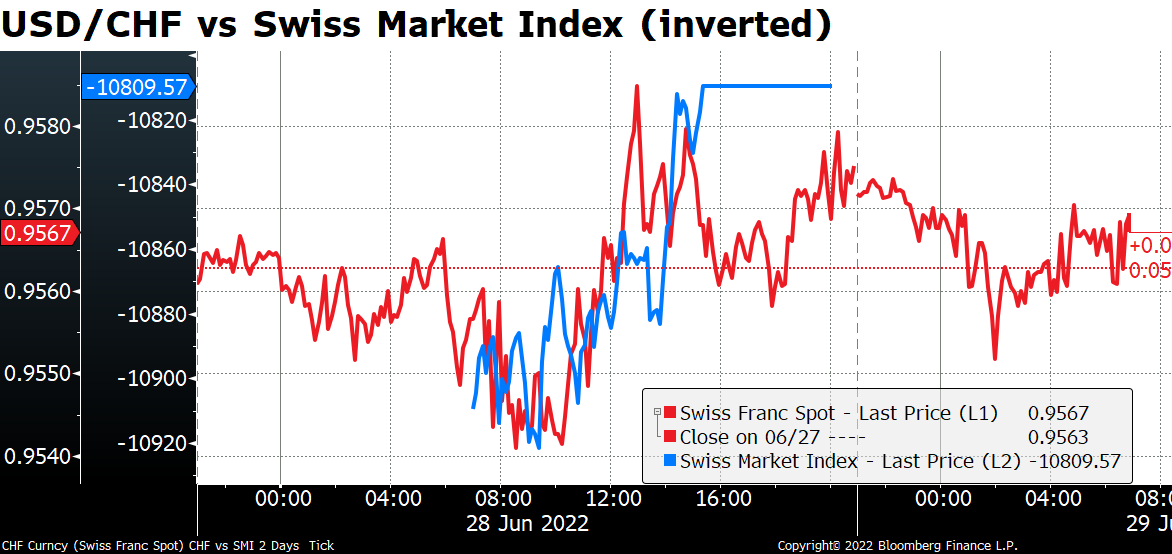
It appears that CHF was following risk sentiment as reflected in the Swiss Market Index (SMI) – or perhaps the SMI was following CHF? That might make more sense as the value of foreign earnings to Swiss companies would be going down, and therefore the value of Swiss companies would be going down, as the value of the Swiss franc increased.
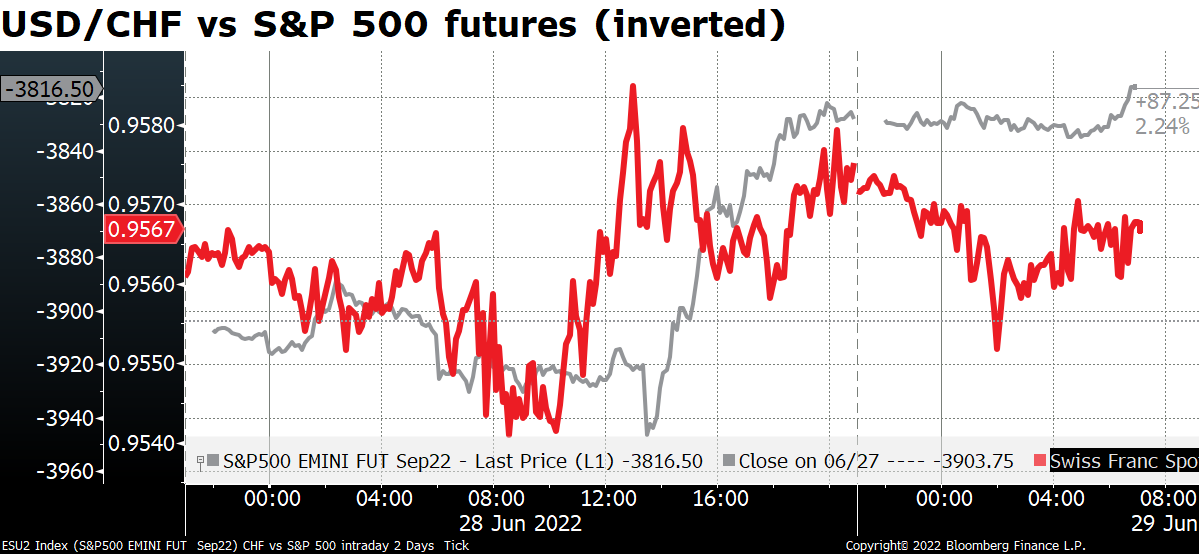
USD/CHF wasn’t following the S&P 500, at least not that closely.
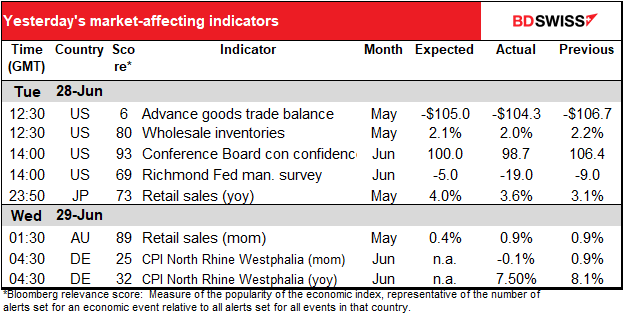
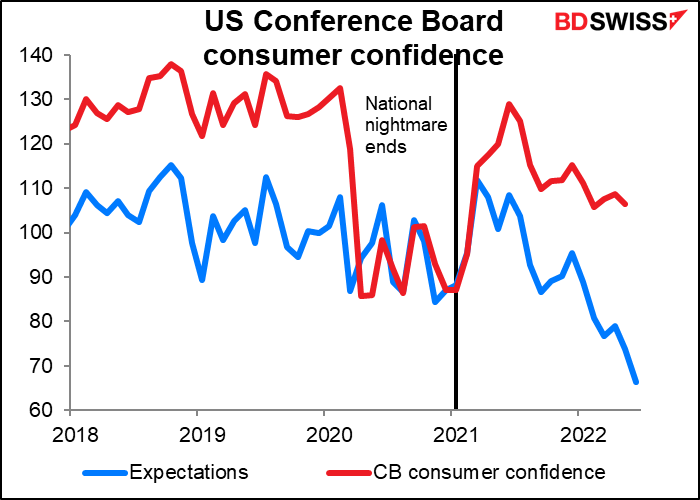
The poor performance of the S&P 500 was blamed on the disappointing US Conference Board consumer confidence figure, which fell more than expected. The fall in the expectations index was particularly sad.
In short, we can’t determine exactly why CHF was the outlier. There wasn’t any particular news out of Switzerland. It could’ve been due to “supernatural forces” operating in the FX market (i.e., Swiss National Bank (SNB) intervention).
My assumption is that it was a further reassessment of the outlook for Swiss monetary policy. As various European Central Bank (ECB) members talk more about tightening and tightening, the prospect increases that the SNB will have to tighten even more aggressively in order to prevent CHF from weakening vs EUR.
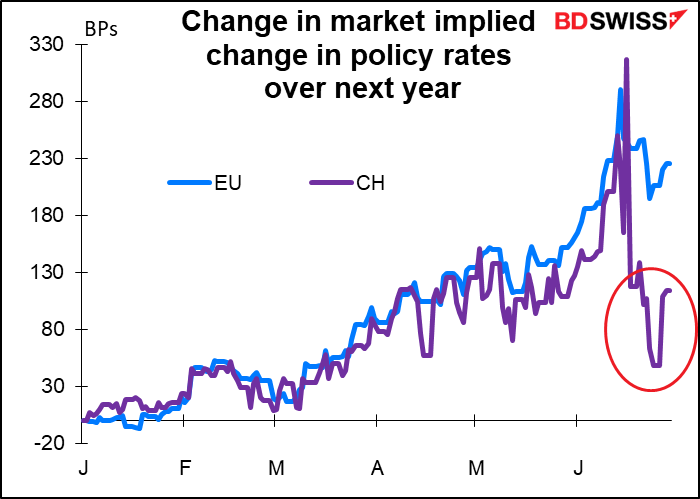
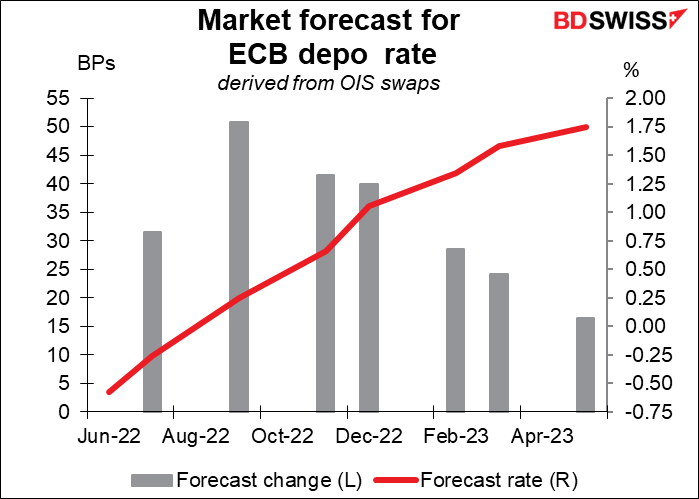
Yesterday at the ECB’s symposium in Sintra, Portugal, ECB President Lagarde largely reaffirmed guidance from the June ECB meeting that they would raise rates by 25 bps in July. The size of the September hike would depend on the data, she said. Before she spoke, ECB Governing Council Member Kazaks expressed his support for a 50 bps hike in September and front-loading the hiking cycle, if there are signs that high inflation readings are threatening to de-anchor inflation expectations. Markets are now pricing in a cumulative 165 bps of tightening by the ECB this year.
Today’s market
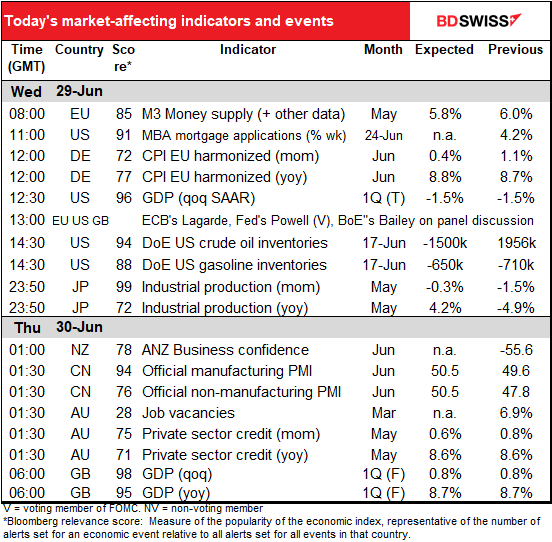
Note: The table above is updated before publication with the latest consensus forecasts. However, the text & charts are prepared ahead of time. Therefore there can be discrepancies between the forecasts given in the table above and in the text & charts.
The indicators today are a secondary thought – the main show is this afternoon’s “Policy Panel” discussion with European Central Bank (ECB) President Lagarde, Fed Chair Powell, and Bank of England Gov. Bailey, along with the head of the Bank for International Settlements (BIS). Sparks will fly! Feathers will be ruffled! Stances will be taken! You can bet that they’ll all be eager to fight inflation and to do so without crashing their economies. Tune in to see how they imagine that that’s possible.
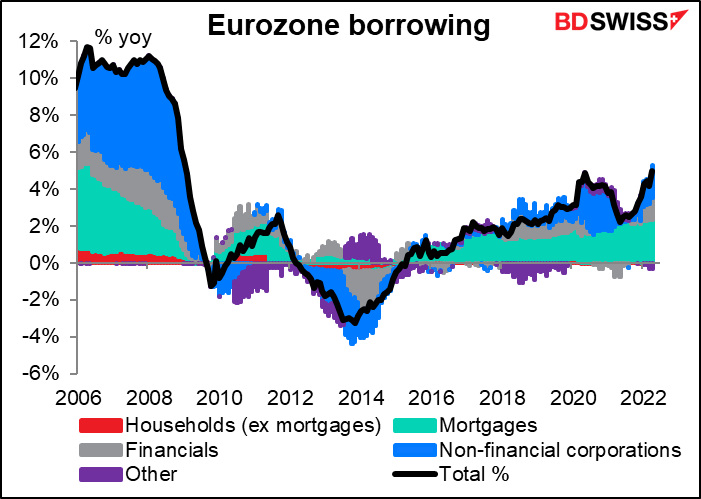
Aside from that, the day starts out with the EU money supply data, which no one cares about anymore. But the ECB does care about bank lending growth, which has been growing recently at the fastest pace in the post-Global Financial Crisis period.
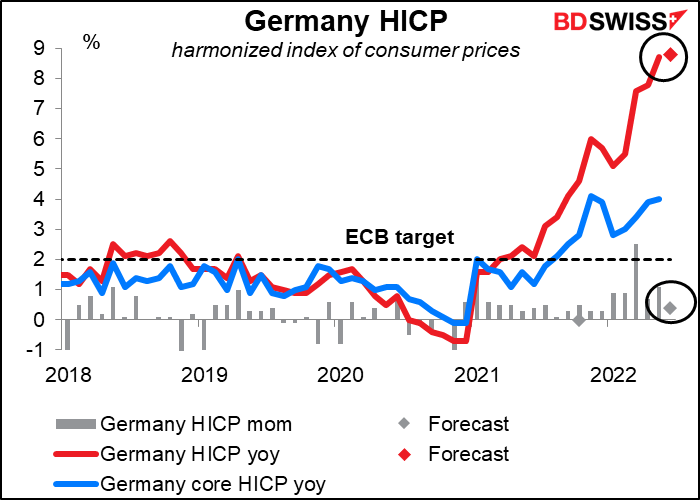
The German harmonized index of consumer prices (HICP) is expected to move inexorably higher. This presents a big risk for Friday’s EU-wide CPI and would therefore be positive for EUR as it would give more ammunition to the hawks on the ECB Governing Council.
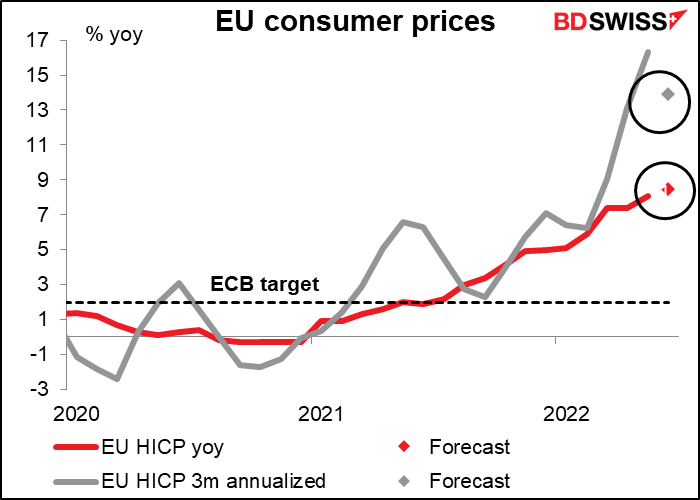
The three-month rate of change (annualized, of course) is however expected to come down substantially. This is probably a more accurate way of estimating inflation trends because it eliminates the base effect (what happened a year ago). It corroborates other information that we have from the US that suggests inflation is peaking. Will the figure therefore be taken as the beginning of a slowdown in inflation? I doubt it. It’s the kind of thing that economists or academics might latch onto but not traders, who have to act immediately in response to headlines.
The third & final estimate of US Q1 GDP is of only historical interest by now.
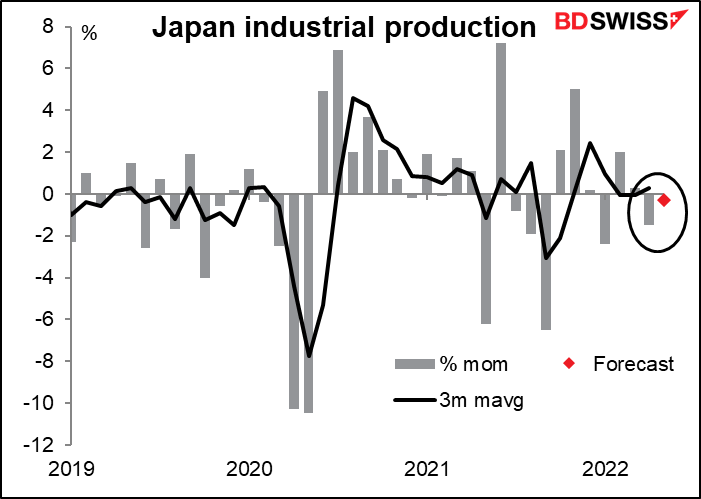
Overnight, Japan releases its industrial production. This is the most closely watched Japanese economic indicator, judging from the Bloomberg relevance score (see table above). Output collapsed a year ago May, probably because of lockdowns, so the year-on-year rate of growth is forecast to explode. We’ll therefore look only at the month-on-month change, which in any case is the one the market focuses on. The Ministry of Economy, Trade and Industry (METI)’s forecast – and the market’s – are for a small decline, probably because of a decline in shipments to Europe and the US.
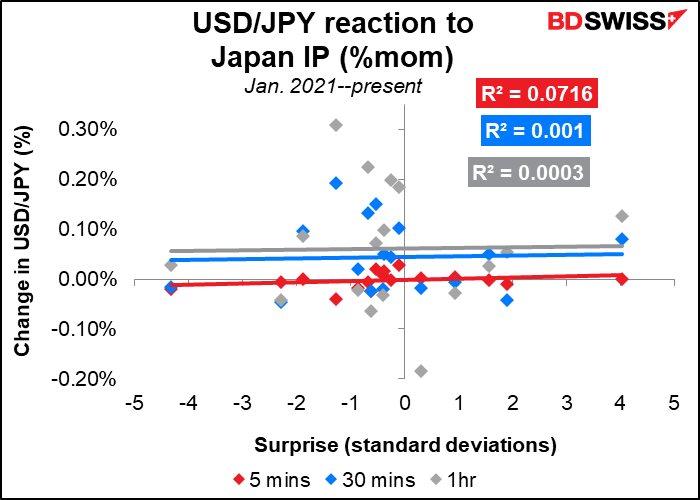
Despite the high Bloomberg relevance score, this indicator doesn’t seem to be that crucial for the FX market. This seems to be the reaction to most economic indicators out of Japan. It wasn’t like this when I worked there. I assume it’s because the Bank of Japan is on perpetual hold and is freezing the bond market, so no matter what happens to the economy, interest rates won’t move.
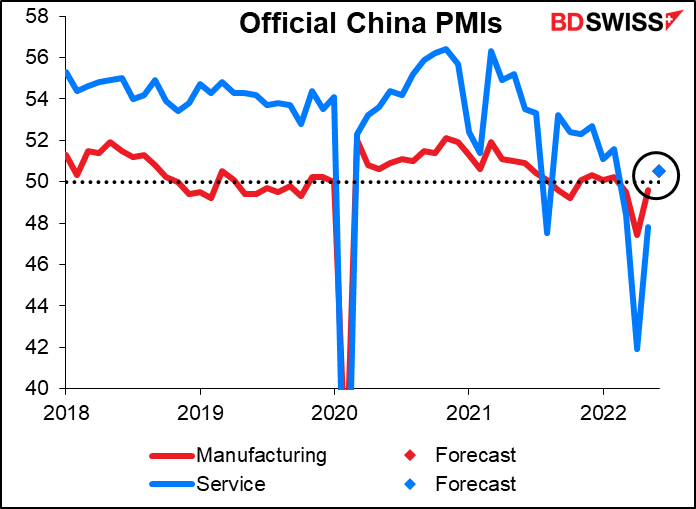
China’s official purchasing managers’ indices (PMIs) are both expected to poke their noses over the 50 “boom-or-bust” line (in fact they’re both expected to be 50.5, which is why there’s only one dot visible in the chart). This could add to the recovery in risk sentiment that’s come about recently as China lifts some COVID-19 restrictions. That would tend to be good for AUD and NZD.
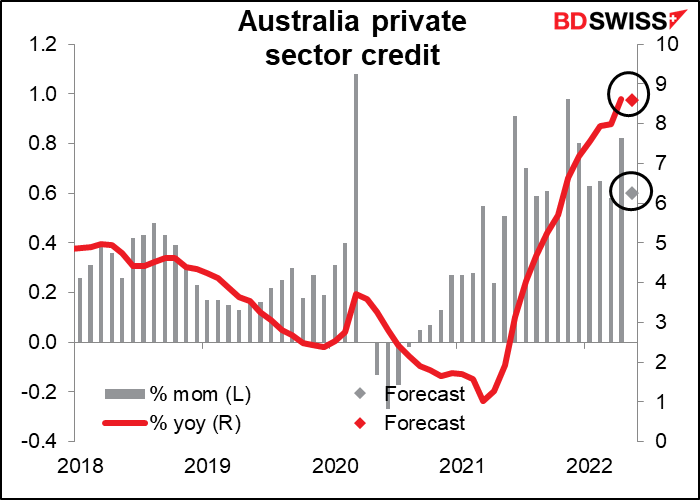
Australia’s private sector credit is forecast to slow a bit from May’s strong 8.6% yoy growth, which was the fastest pace since the Global Financial Crisis. The Reserve Bank of Australia (RBA) started hiking rates in May, plus there was a Federal election that month, which may have caused some uncertainty among businesses. Against that background, I would say that the forecast increase suggests relatively strong demand for credit and therefore the need for the RBA to hike significantly further. That may be positive for AUD.
