
Rates as of 05:00 GMT

Market Recap
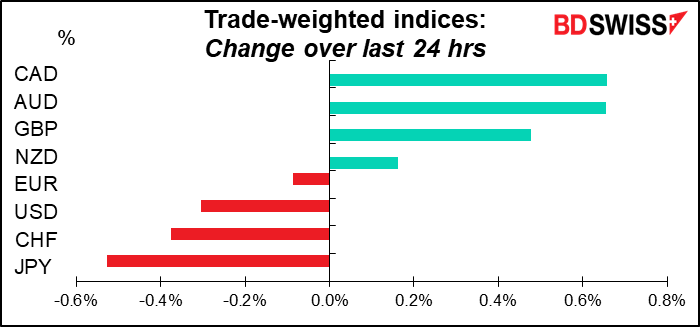
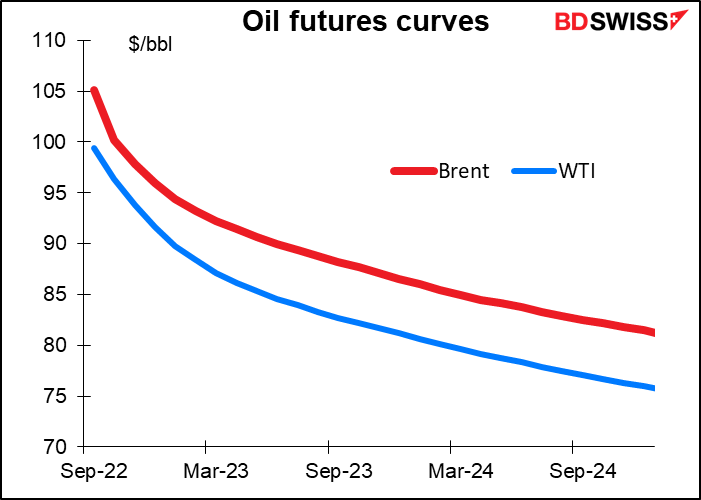
In Europe, Russia reduced the supply of gas to the Nord Stream 1 pipeline to only 20% of capacity from 40% due to turbine maintenance. This led to about a 10% rise in European natural gas prices and helped to push Brent up as well, which supported CAD.
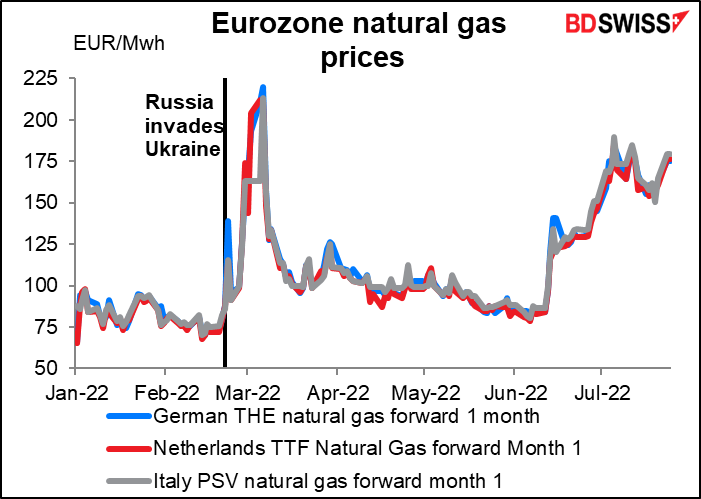
There’s a difference of opinion on why the flow is being restricted – Russia says it’s because it needed to halt the operation of a Siemens gas turbine at a compressor station on instructions from an industry watchdog, but Germany said it saw no technical reason for the reduction. The Russian position is what some analysts are calling “strategic ambiguity,” that is, not explicitly saying that they’re going to cut off gas supplies as a tactical weapon but acting as if they will. Putin’s press secretary, Dmitry Peskov, said that “the turbine will be installed after all the technological formalities have been completed” and that “Russia is not interested” in cutting off gas supplies but that “If Europe continues its course of absolutely recklessly imposing sanctions and restrictions that hit itself, the situation may change.”
There’s a big difference between the pipeline operating at 40% of capacity and 20%. At 40% capacity Germany could make it through the winter with just light rationing, but at 20% Germany’s storage tanks would be empty by March. There would have to be either considerable rationing or a reduction in re-exports to the rest of Europe, which of course would cause rationing in those countries and wouldn’t make Germany very popular.
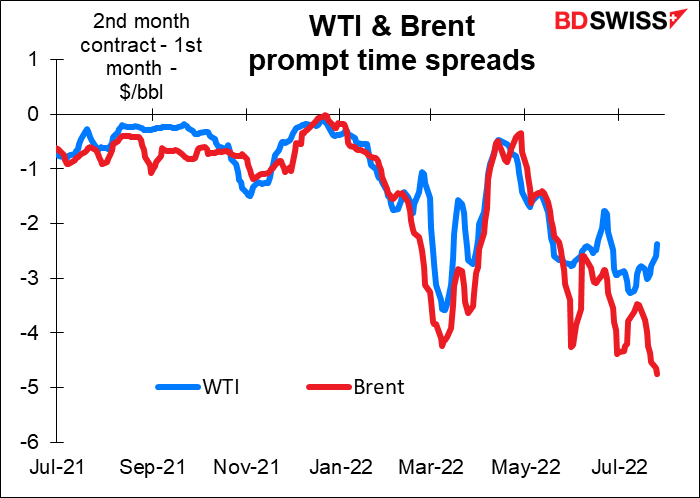
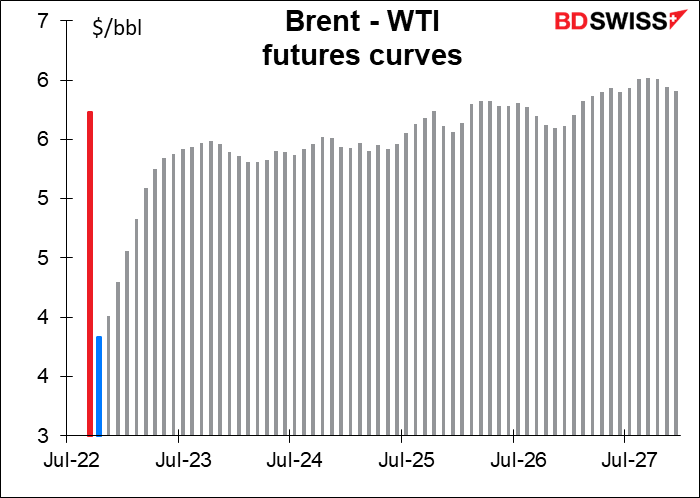
There’s a notable difference in the energy market in Europe and the US. If we look at the prompt time spread – the difference between oil for delivery in the next month vs delivery a month later – it’s headed lower in Europe but upward in the US. That means the panic to get oil ASAP is getting worse in Europe but is starting to be alleviated in the US.
There’s a difference of opinion on why the flow is being restricted – Russia says it’s because it needed to halt the operation of a Siemens gas turbine at a compressor station on instructions from an industry watchdog, but Germany said it saw no technical reason for the reduction. The Russian position is what some analysts are calling “strategic ambiguity,” that is, not explicitly saying that they’re going to cut off gas supplies as a tactical weapon but acting as if they will. Putin’s press secretary, Dmitry Peskov, said that “the turbine will be installed after all the technological formalities have been completed” and that “Russia is not interested” in cutting off gas supplies but that “If Europe continues its course of absolutely recklessly imposing sanctions and restrictions that hit itself, the situation may change.”
There’s a big difference between the pipeline operating at 40% of capacity and 20%. At 40% capacity Germany could make it through the winter with just light rationing, but at 20% Germany’s storage tanks would be empty by March. There would have to be either considerable rationing or a reduction in re-exports to the rest of Europe, which of course would cause rationing in those countries and wouldn’t make Germany very popular.
There’s a notable difference in the energy market in Europe and the US. If we look at the prompt time spread – the difference between oil for delivery in the next month vs delivery a month later – it’s headed lower in Europe but upward in the US. That means the panic to get oil ASAP is getting worse in Europe but is starting to be alleviated in the US.
European stock markets generally gained despite the worries over Russian gas, which gave a “risk-on” tone to the market and generally supported EUR/USD.
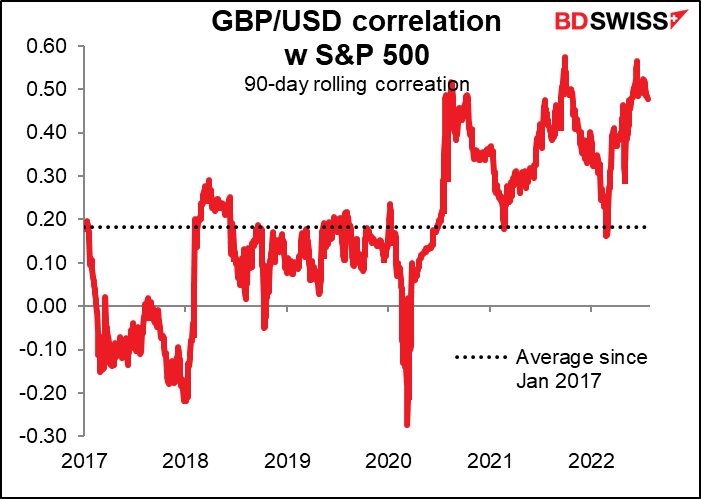
The risk-on mood also boosted GBP/USD back above the 1.20 level. GBP has become increasingly sensitive to general global risk trends recently.
In the risk-on mood, USD continued to retreat while the safe-haven CHF and JPY lost ground. JPY’s trade-weighted index gained 1.14% on Friday but was down 0.53% yesterday, so the currency lost about half its gains.
I should say though that the “risk-on” mood in the US was rather fragile. The S&P 500 gained only 0.13% with only around 9bn shares trading, the lowest volume so far this year. This is the biggest week for US Q2 earnings, with over half of the S&P 500 by market capitalization reporting this week, meaning that investors are probably waiting to see how earnings go before getting involved.
Today’s market

Note: The table above is updated before publication with the latest consensus forecasts. However, the text & charts are prepared ahead of time. Therefore there can be discrepancies between the forecasts given in the table above and in the text & charts.
A quiet schedule during the European and US days, with some excitement at 14:00 GMT, when three US indicators come out.
The Richmond Fed manufacturing survey doesn’t get much attention as it’s the third of the regional Fed surveys to be announced each month (after the Empire State and Philadelphia Fed surveys), but my research shows that it’s the best of all of them for forecasting the Institute of Supply Management (ISM) manufacturing PMI, which is one of the most closely watched US indicators. This month’s forecast suggests that the ISM index is likely to fall into contractionary territory. That would probably be a surprise as the S&P Global (formerly Markit) manufacturing PMI only fell slightly to 52.3 from 52.7, remaining over the 50 line. The ISM index falling below 50 would probably be negative for the dollar.

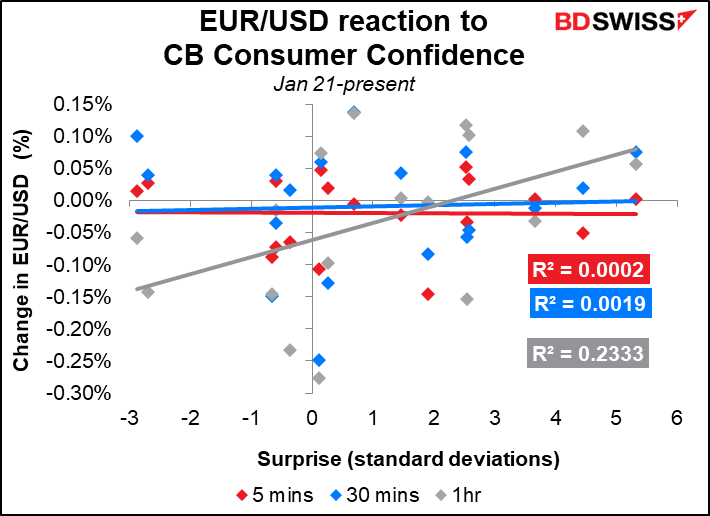
The Conference Board consumer confidence index is expected to fall further – not quite back to the pandemic-era levels but getting there slowly but surely.
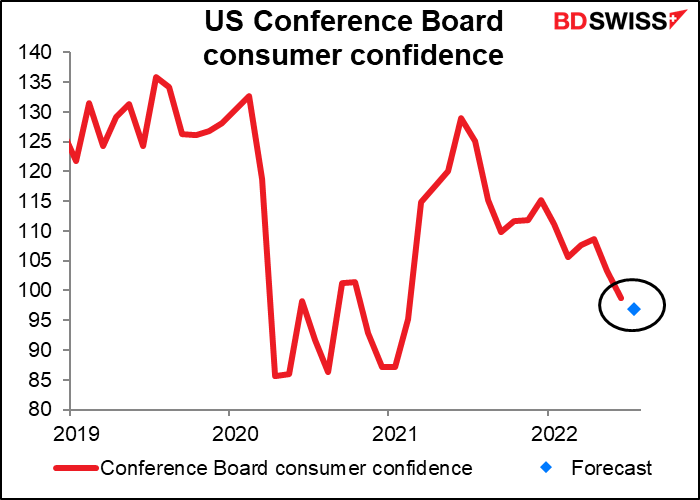
Although this is a closely watched indicator, it doesn’t seem to have much immediate impact on the currency. And the later impact (after one hour) is the opposite of what one might expect: the dollar tends to weaken when confidence is better than expected. We see the same reaction to GBP/USD and USD/JPY too.
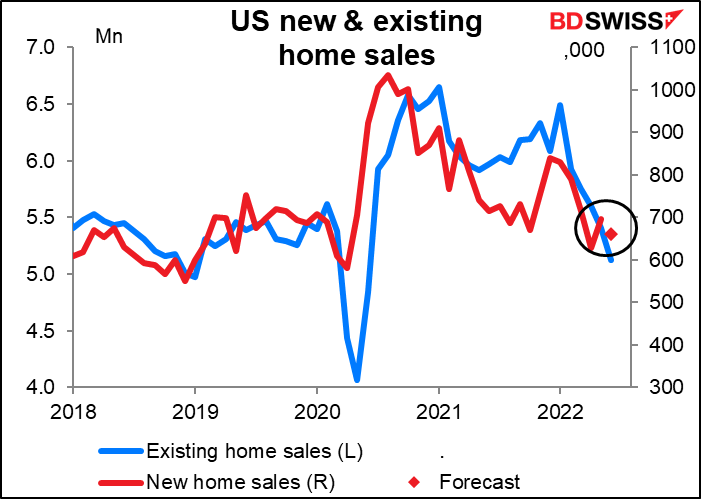
US new home sales are expected to be down 5.0% mom, not far off the -5.4% decline seen in existing home sales last week. This is a major way in which the Fed’s rate hikes impact the US economy: higher mortgage rates dampen the housing market, which ripples through the economy.
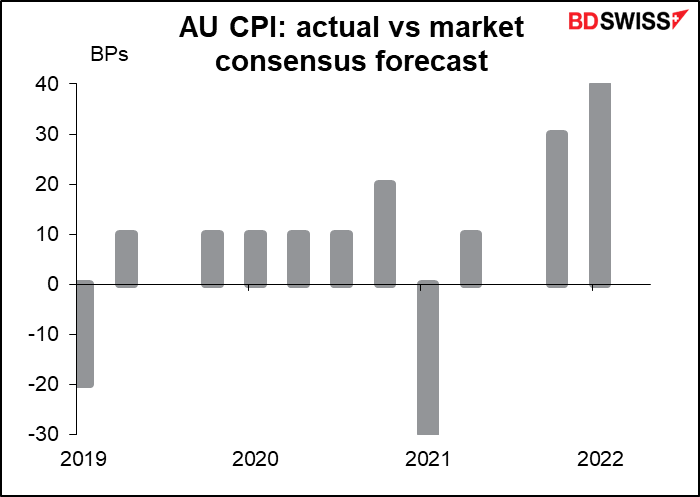
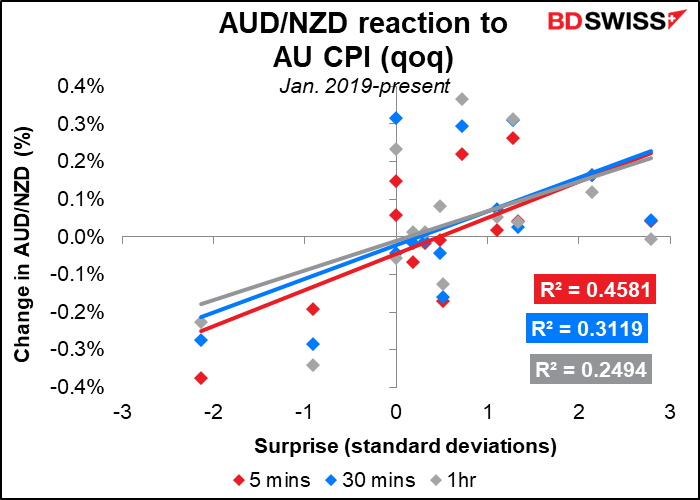
Overnight Australia releases its consumer price index (CPI). It’s particularly important for that country because it only comes out quarterly, not monthly as in most other countries. It will therefore be the CPI figure that the RBA will discuss at their August, September, and October meetings (the next CPI comes out on Oct. 26th whereas the October RBA meeting is on the 4th). It’s expected to continue to rise, as is generally the case globally. That may put some upward pressure on AUD.

If you’re thinking of trading this indicator, you should definitely consider trading AUD/NZD rather than AUD/USD. AUD/NZD exhibits a much stronger correlation with the surprise in the index than AUD/USD does.

How do the economists do forecasting this indicator? Like in many countries, economists have failed to accurately predict just how high inflation would go. Since the beginning of 2019 it’s beaten forecasts 9 times and missed only twice. Economists got it right twice too.