Note: The table above is updated before publication with the latest consensus forecasts. However, the text & charts are prepared ahead of time. Therefore there can be discrepancies between the forecasts given in the table above and in the text & charts.
Rates as of 05:00 GMT
Market Recap
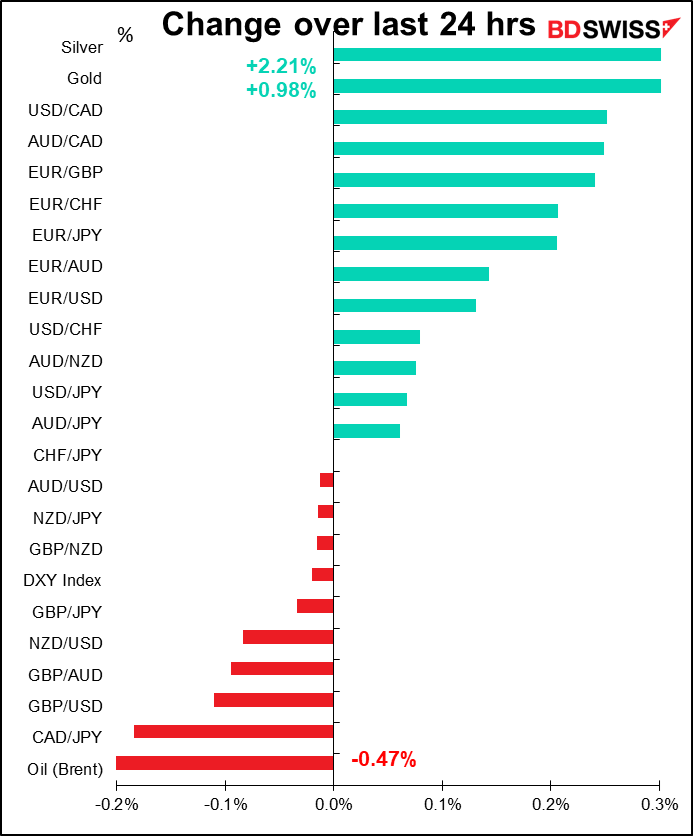
I’ve rarely seen such narrow movements in currencies in a day. We must be getting toward the end-of-year shutdown period. A lot of hedge funds for example have already closed their books for the year. Other traders are thinking: what if I make a mistake? I could blow my bonus for the year with one wrong trade and no time left to make it up.
Actually though the end of the year isn’t usually that calm. True, there are fewer market participants and fewer people taking big speculative positions, so what that means is that if there is any big news or a big order, the market is less liquid and therefore prices move more.
I deduced this from looking at the seasonal pattern of the Deutsche Bank CVIX index, which is the currency version of the VIX index: it measures the implied volatility of currency options and is therefore a measure of the market’s expectation of future currency volatility. (Of course future volatility isn’t the same as current volatility, but it’s a good proxy.)
I ranked the volatility for each week from most volatile (100) to least volatile (0) of the year. I then took the average for 2010-2019. If volatility were distributed randomly, over time each week should have an average ranking around 50. The graph shows the divergence from 50. Weeks with positive bars have been more volatile than average, those with negative bars are less volatile. As you can see, the end of the year tends to be right around average. The summer is when things usually get dull.

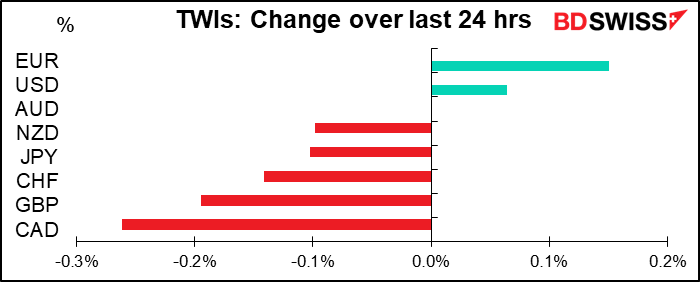
OK I have to write about something, so I’ll look at why CAD was the worst-performing currency of the day. Normally a movement of around 2 1/2% on the country’s trade-weighted index wouldn’t excite me, but that’s all we’ve got today.
As usual, we can attribute a lot of the movement to a fall in oil prices (blue line in this graph, inverted).

As far as I can tell, that was due to the usual worries about the virus, which is exploding in the US nowadays with little sign of any slowdown.
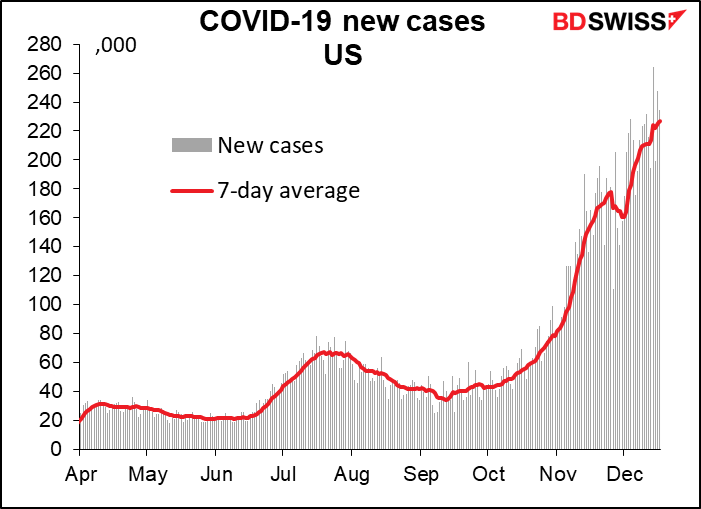
The poor record of the US compared to other countries is self-evident. (Note: some people in Japan do not believe the official Japanese figures, so those may be unreliable.)

At the same time, there are fears that the dysfunctional US government won’t be able to cobble together a fiscal support package by the end of today and avert a government shut-down. Politico is reporting that “Congress is preparing for the possibility of a short government shutdown as leaders attempt to wrap up a nearly $1 trillion coronavirus relief package ahead of Friday’s deadline but as weekend work becomes almost inevitable…While negotiators maintained they were close and senators said an announcement could come at any time, there were no overt signs of an imminent breakthrough.”
More virus = more lockdown, less economic activity. No agreement = less money = less spending. Add those onto yesterday’s disappointing initial jobless claims, which rose by 32k instead of falling by 35k as expected. All told it suggests fewer people driving around or taking trips or perhaps even heating their houses! And so less demand for fuel.
The odd thing is, during the US trading day the mood was quite different. The S&P 500 (+0.58%), the NASDAQ (+0.84%) and the DJIA (+0.49%) all closed at record highs, while in Europe both the STOXX 600 (+0.30%) and the DAX (+0.75%) hit their highest levels since the pandemic began. Oil was also firmer and the reflation trade accelerated with US bond yields higher and 10yr US breakevens (the expected inflation rate that would mean investors break even between buying a normal Treasury bond and buying a Treasury inflation-protected bond) rising further to 1.95%, the highest level since April 2019. But this risk-on mood has largely reversed during Asian trading. Most Asian stock markets are lower and the S&P 500 index is indicated to open -0.1%.
GBP was also lower as both sides keep talking up the problems. UK PM Boorish Johnson talked w EC President vd Leyen, but neither of them was in a particularly good mood afterward. PM Johnson said discussions are in a “serious situation” and a no deal scenario was “very likely” unless the EU position changed “substantially.” Ms. vd Leyen said bridging “big differences,” particularly on fishing rights, would be “very challenging.” It’s really appalling that these talks are hung up on fishing, which amounts to something like 0.5% of UK GDP. As one analyst noted, the Harrod’s department store has a higher Gross Value Added than the entire UK fishing industry.
I’ve been trying to think of a theme song for the Brexit talks. Of course looking at the entire time since the vote, it would have to be The Beatle’s Long and Winding Road. For right now though, given what some of the negotiators have said, I’d choose the traditional Hebrew song Kol Haolam Kulo (“The whole world is a narrow bridge, and the most important thing is to not be afraid”). But for those of us trying to follow the talks and trade minute-by-minute on every news snippet, Bananarama had the perfect song!
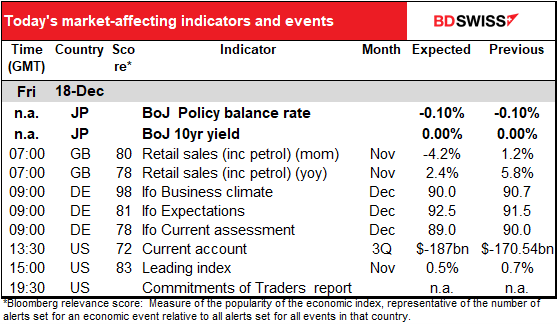
Separately, the Bank of Japan kept policy unchanged, as everyone who had an opinion on the matter thought would happen. It decided to extend its special lending support programs for pandemic-hit businesses by six months, as was also widely expected.
The surprise was that it announced that it would “conduct an assessment for further effective and sustainable monetary easing…” While this review of policy was not expected, it’s not unusual at all. Many central banks, including the US Fed and the European Central Bank, have recently undertaken reviews of their monetary policy. Oddly enough though the BoJ pre-judged the conclusion of the review by adding that “since the framework of “QQE with Yield Curve Control” has been working well to date, the Bank judges that there is no need to change it.” The results of the study, such as they are, will probably be announced at the 19 March meeting, they said.
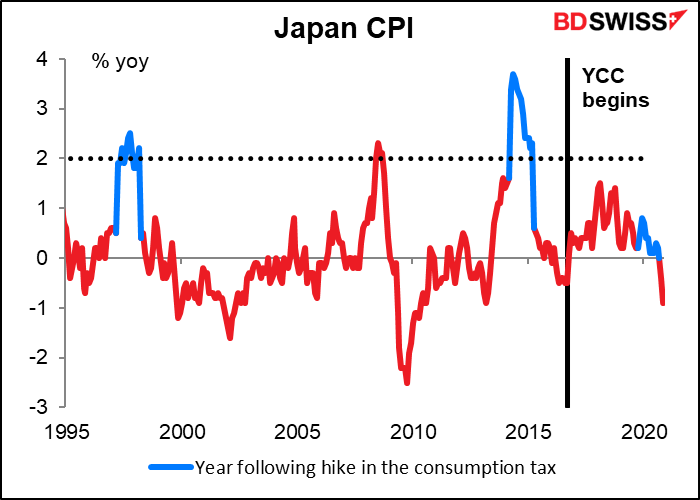
I’m not sure how the BoJ defines “working well,” but it was announced overnight that inflation had fallen to the lowest level since March 2013. Yield curve control (YCC) did help for some time to get price movements into positive territory, but no longer.
Today’s market
A quiet end to a busy week.
We’ve already had the UK retail sales data. It was not as bad as expected or better than expected, depending on which way you want to look at it.

The Ifo Survey is expected to show a fall in the current assessment but a rise in the expectations index. That stands to reason if people believe that the tighter restrictions now may make things worse in the near future, but combined with the rollout of a vaccine will make the future better.

As a result the gap between the two, which had fallen to almost nothing in November, is expected to widen out a bit.

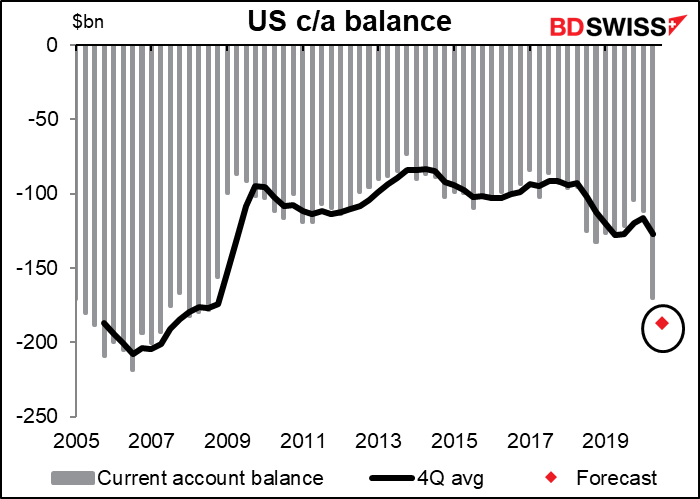
The US current account deficit is expected to widen out considerably. It’s still not expected to be as wide as the record deficits of 2005 and 2006.
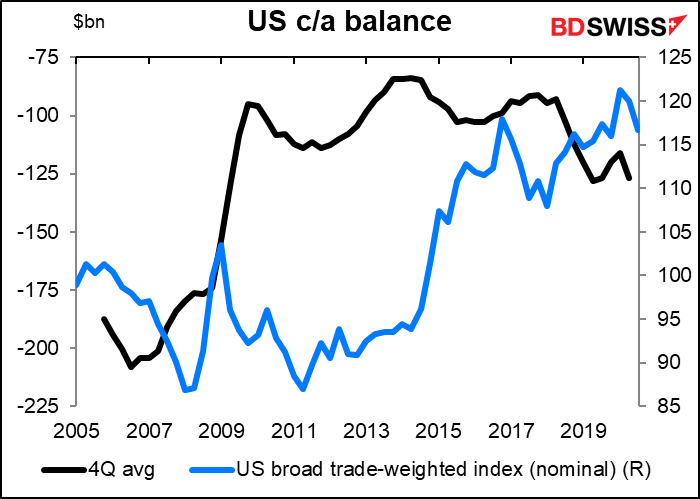
I was wondering whether the recent widening of the current account deficit could be behind the recent fall fo the dollar, so I looked at the longer-term relationship. Answer: there isn’t any that I can see.
The US leading index is expected to be a bit lower but still showing expansion. I’m not sure how well the leading index leads nowadays though since the virus and lockdowns have added a new factor into the equation. Past performance is no guarantee of future performance.

