Rates as of 04:00 GMT
Market Recap
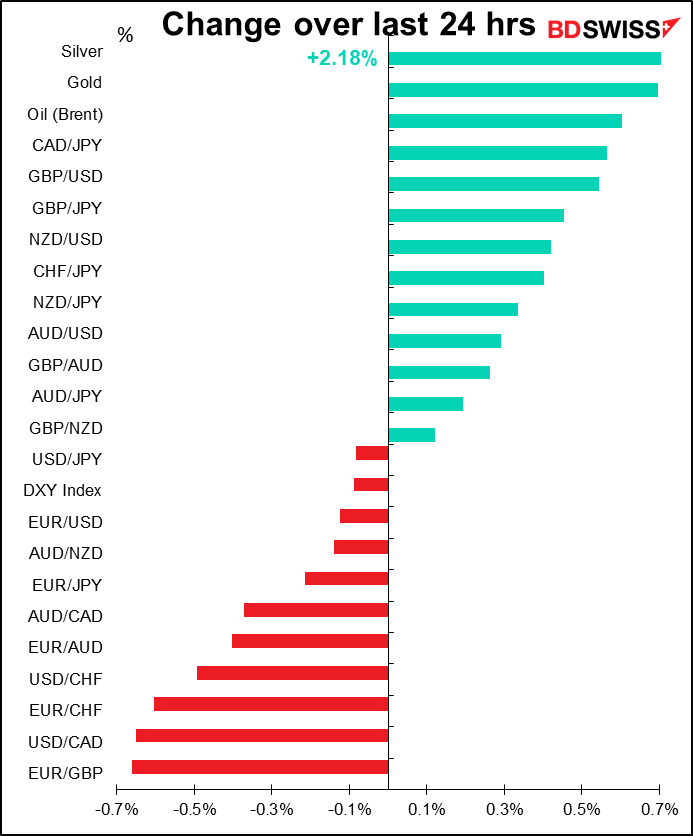
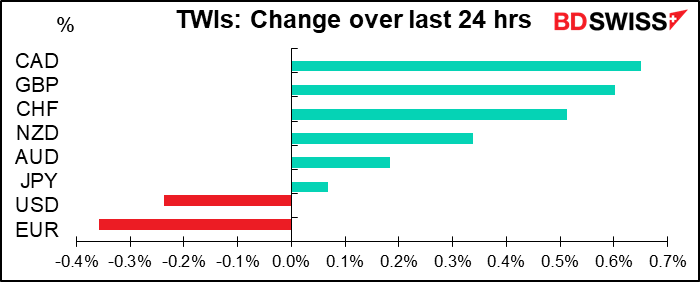
The FX market was largely driven by month- and quarter-end flows yesterday. These boosted CAD and GBP. The EUR/GBP cross was a particularly big mover.
CAD may also have been helped by news of an 11.6% mom decline in Canada GDP in April. The point is not that this was such a great outturn, but rather that it was very close to Statistics Canada flash estimate of -11%. That hit boosted the credibility of Stats Canada’s forecast of a 3% rebound in May. This suggests that the Canadian economy can recover faster than expected despite the drop in oil prices and problems in the auto sector.
Meanwhile, the action in the stock market continues to defy common sense. New York Fed President Williams warned that a full recovery in the US will probably take years and observed that areas where the virus is resurging are seeing a slowdown in economic activity. And the US’ COVID-19 guru, director of the National Institute of Allergy and Infectious Diseases, Anthony Fauci, warned that the US could soon see as many as 100k new cases a day if the current trajectory of the outbreak is not changed. How those comments justified a 1.54% rise in the S&P 500 I’m not sure.
There were some positive signs for EUR that were totally ignored. The ECB’s Schnabel, who has previously warned of temporary deflation and envisioned a slow recovery against a backdrop of extreme uncertainty, was the fourth ECB Governing Council member to predict that the ECB may not need to use the full amount of its recently expanded Pandemic Emergency Purchase Program (PEPP). And good demand for Italian bonds produced the highest bid-to-cover for a 10yr note since May 2012. That signifies growing confidence in the strength of the EU’s response to the virus and the EU’s ability to keep the Eurozone together. These should be positive signs for EUR that could elicit some mean reversion now that the end-month flows are over.
Gold rose past $1,780 for the first time since 2012.
Shadow policy rates
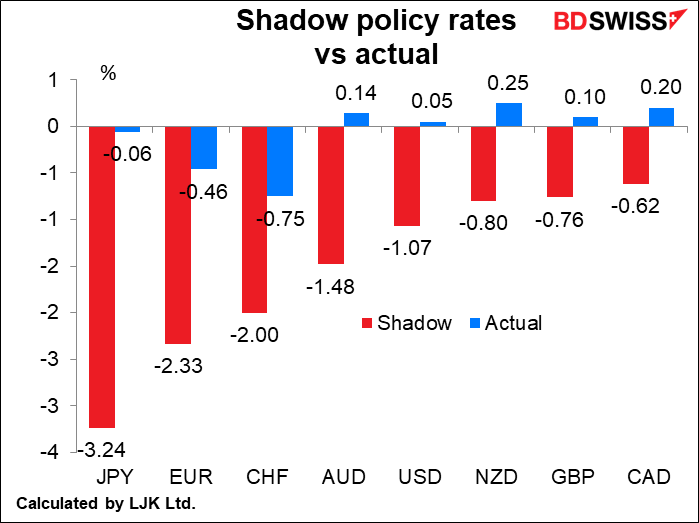
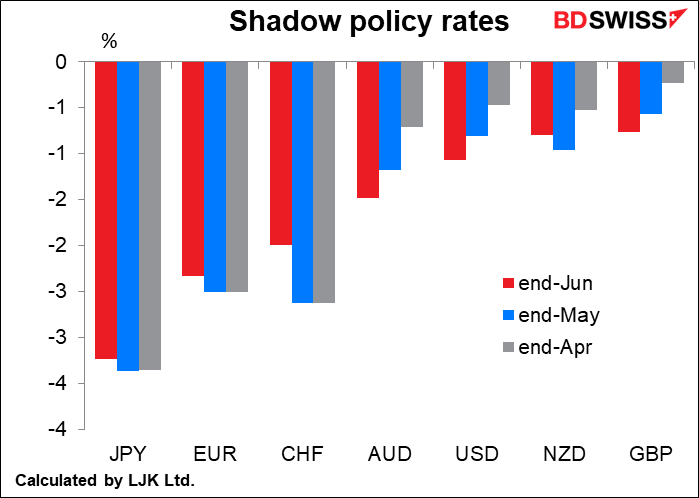
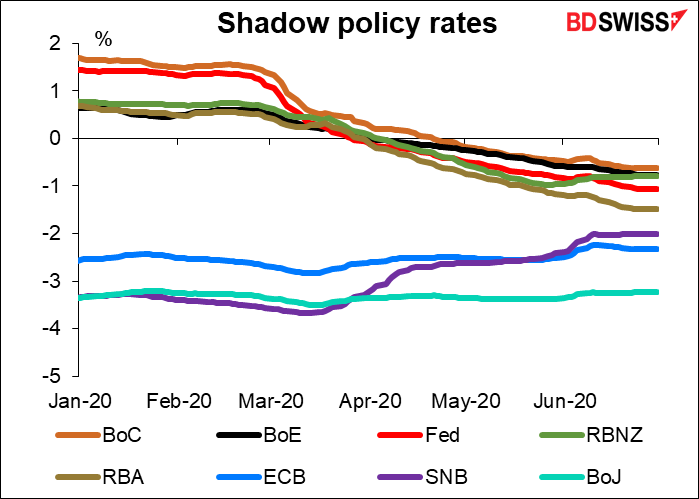
The monthly update of the “shadow policy rates,” the effective policy interest rate taking into account quantitative easing and other extraordinary measures, has been released. Three points stand out to me since I last looked at them:
1) The method of calculation was significantly revised in May, resulting in big changes. The lowest rates are nowhere near as low as they used to be. EG previously Japan in April was -7.71%, it’s since been revised to -3.35%. Same with Euro, which was revised to -2.51% in April from -7.67.
2) US shadow rates have been declining steadily. Together with the soaring virus cases, I expect the looser monetary policy to eventually weaken the dollar.
3) Swiss shadow rates have been rising. That may help explain why EUR/CHF has topped out and retraced somewhat.
The data come from Dr. Leo Krippner, a senior economic advisor at the Reserve Bank of New Zealand. You can access them here.
Today’s market
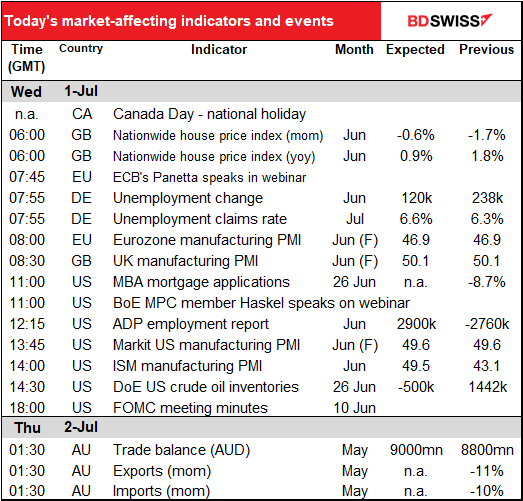
Today’s Germany’s unemployment data is for June. As usual, that later data is more valuable to the market than tomorrow’s EU-wide unemployment figure, which is for May. Besides, the European Central Bank doesn’t have a dual mandate – officially at least they’re not supposed to care about employment.
In any event, Germany is expected to lose fewer jobs in June than it did in May and certainly in March, but it’s still losing jobs and the unemployment rate is forecast to rise further. The government funds companies to keep people employed however so the rise is limited.

The final purchasing managers’ indices are rarely that different from the initial ones, and rarely market-affecting.
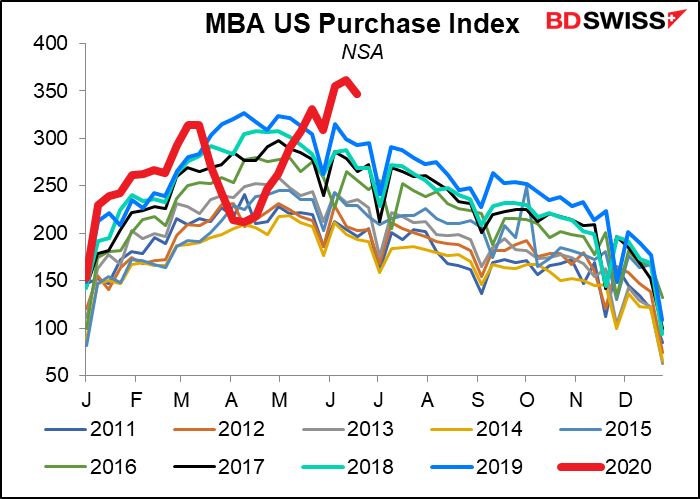
The weekly US MBA mortgage applications figure turned down last week, but remains well above the range for the last decade. There’s no forecast for this figure.
The monthly jobs estimate by Automated Data Processing Inc. (ADP) is expected to be in line with the NFP this week: the ADP forecast is 2900k and the NFP forecast is 3090k. Last month there was a shocking divergence between the two: the ADP figure was a record fall of -2760 while the NFP was a record rise of 2509k! This was a 54-standard-deviation figure, which I believe mathematics suggests one would see only every few billion years. I wouldn’t be surprised to see some revision somewhere.

The ISM manufacturing index is expected to come back almost to the 50 “boom or bust” line, while the new orders index is expected to poke its nose over the line – indicating a rise in new orders, not just less of a contraction. That would be Good News. Does it counter the virus news? And what would the impact on USD be? Nowadays good news for the US can encourage a general “risk-on” mood that causes the dollar to fall, not rise.

The forecast is almost exactly in line with the preliminary Markit manufacturing PMI for the month (49.6). It also accords with the fairly strong rebound o
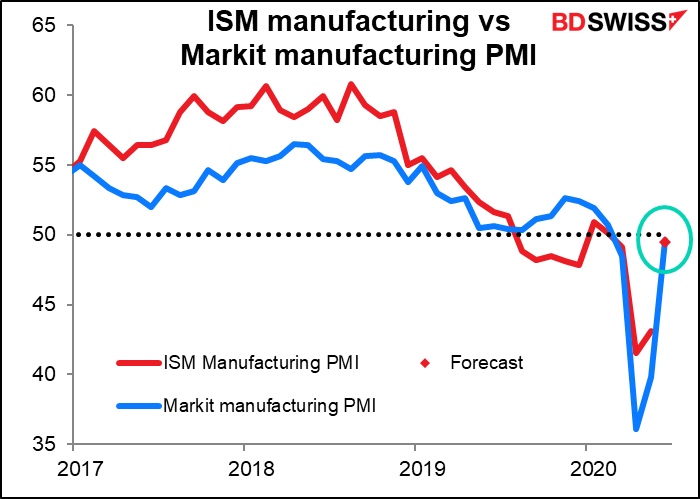
In fact, the regional Fed surveys would suggest an even higher result.
Based on the Philadelphia, Empire State, Richmond & Kansas City indices – the Dallas Fed index doesn’t have much explanatory power – the index “should” rise to 53.7. (But of course past performance is no guarantee of future performance.)

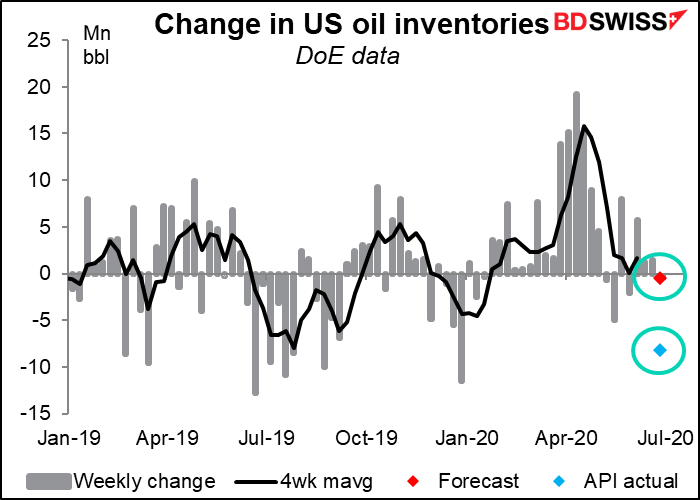
US oil inventories have risen 110.8mn barrels or 26% so far this year, but it finally looks like they might be topping out. The American Petroleum Institute (API) yesterday reported a far larger-than-expected drawdown of 8.2mn barrels in the latest week. It may be that finally the massive shut-down of oil production in the US is having some effect. Two-thirds (67% to be precise) of the oil and gas rigs in the US have shut down this year as prices fell below the cost of production. US shale oil pioneer Chesapeake Energy filed for bankruptcy protection Sunday and another 200 companies are in danger of failing, according to press reports. The market looks for a small 500k drawdown in the US Dept of Energy figures today but the API stats suggest it could be larger than that.
The minutes of the 10 June Federal Open Market Committee (FOMC) meeting may not be that informative, seeing as Fed Chair Powell not only gave a press conference afterward but has also been drilled twice by the House Financial Services Committee and once by the Senate Banking Committee. Nonetheless, there’s likely to be some interest in what they say about their review of monetary policy and in particular the likelihood of the Fed moving to either negative interest rates or yield curve control.
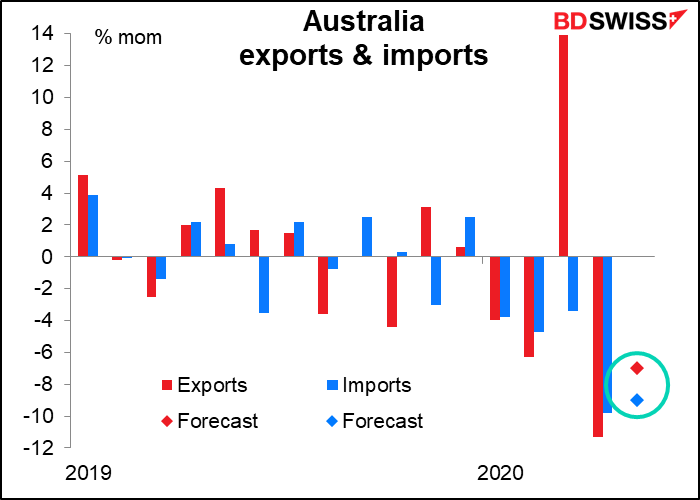
Overnight, Australia releases its trade data. The nation’s trade surplus is expected to rise, although not back to March’s record level.
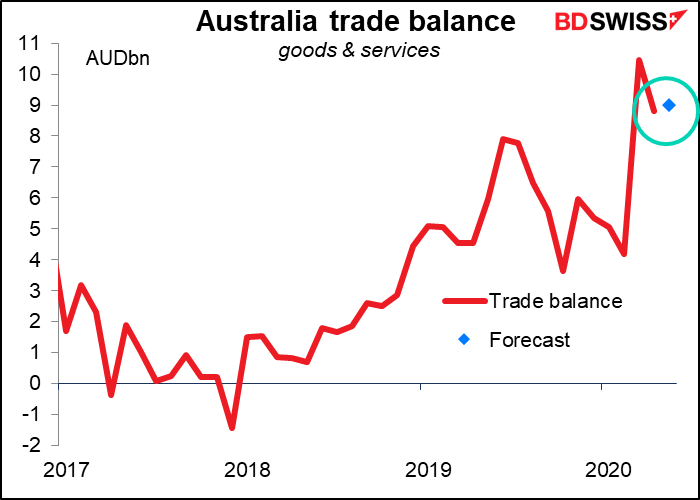
It’s not necessarily because the iron ore market is booming, though. Like many countries, Australia has seen a decline in both its imports and exports – it’s just that imports are falling faster than exports.
