


Fibonacci Retracements are popular ratios used to identify potential reversal levels. These ratios are based on the Fibonacci sequence created by the famous Italian mathematician Leonardo Pisano Fibonacci. This sequence of numbers involves adding the previous two numbers in the sequence. The sequence therefore goes 0, 1, 1, 2, 3, 5, 8, 13, 21, 34, 55, 89, 144…
The Golden Ratio
Dividing one of those numbers by the previous number gives an average result of 1.618, which is now known as the golden ratio. This ratio has been found to have a surprising correlations in nature, including human and animal anatomical proportions. The Fibonacci spiral is effective at measuring the outgrowth of something as little as a shell to something as big as our milky way.
Fibonacci Retracements
In trading, the Fibonacci retracement uses the number preceding it to create a percentage, with the golden ratio. Effectively, the retracement levels of 61.8%. 38.2% and 23.6% are a result of dividing numbers two and three places away in the sequence from the selected number. These lines produce a grid, which is primarily used to determine trend reversals. Chartists apply Fibonacci ratios to define retracement levels and forecast the extent of a correction or pullback in the event of a price rally. Fibonacci Retracements can also be applied after prices fall, in order to forecast the length of a counter-trend bounce.
How can they be used?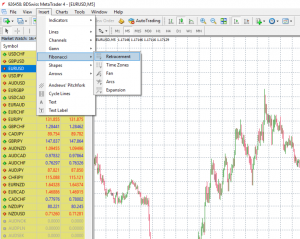
The use of Fibonacci is pretty simple. One method is based on the retracements and involves taking a trend and applying the retracement pattern over it. On the MT4 you can find the Fibonacci Retracement lines under Indicators and simply drag and drop the lines on an upward or downward trend.
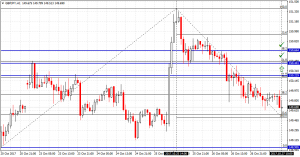
The graph you will end up with will represent the place where short term reversals are expected, giving you a chance to identify an entry level where the price could potentially bounce back to the original trend. This is most effective with a longer term trend and naturally it works best with larger pip trends. It is important to remember though, that no indicator is absolute and it is best to combine Fibonacci Retracement lines with other supporting indicators that provide further confirmation of a potential trend.
Another method is to use the targets to identify where to exit a trade. Since the Fibonacci measures reversals, selling at the 61.8% or 38.2% levels could allow you to close your position before the market bounces backwards in the opposite direction.
Fibonacci retracements are often used to identify the end of a correction or a counter-trend bounce. The Fibonacci sequence is often deified by traders because of the golden ratio and its almost mystical occurence everywhere in nature. When it comes to trading however, it is important to understand that Fibonacci Retracements are just an indicator to help you speculate on potential price direction. Just like any other indicator, Fibonacci Retracements should be utilized in combination with other supporting indicators to provide further confirmation of a possible reversal.


