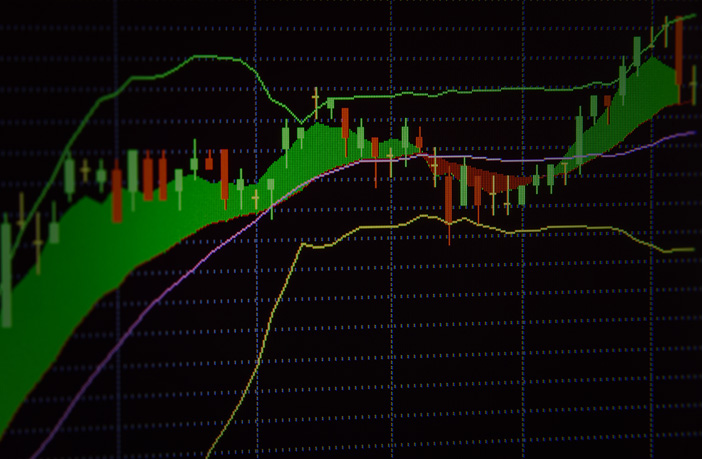
The Bollinger Bands indicator was developed by the famous technical trader John Bollinger. The indicator is plotted two standard deviations away from a simple moving average. The price of the stock is bracketed by an upper and lower band along with a 21-day simple moving average. The bands automatically widen when volatility increases and narrow when volatility decreases.
Many traders believe the closer the prices move to the upper band, the more overbought the market, while the closer the prices move to the lower band, the more oversold the market. Bollinger Bands are therefore used to identify reversal points and predicting changes in price direction but they should in no case be considered absolute. When it comes to technical analysis, it is prudent to use a combination of indicators to verify a certain signal.
Reversals
Bollinger Bands are used to predict possible future turning points. Bollinger Bands, with the correct settings, contain more than 90% of price action; which fluctuates between the two bands. When the bands contract, and come close together, this is referred to as a squeeze. A squeeze signals low market volatility and is considered to be a potential signal for future increased volatility.
On the contrary, the wider apart the bands move, the more probable low future volatility becomes. However, these conditions are far too broad to be considered concrete trading signals and are therefore highly uncertain. Bollinger Band breakouts are also falsely considered strong signals. While it’s true that a breakout is an important event, breakouts on their own provide no clue as to the direction and extent of future price movement.
Not Absolute
Bollinger Bands are a useful indicator to help you understand market conditions and important price changes that could be of interest. That being said Bollinger Bands should not be used as a standalone trading system. They are simply one indicator designed to provide traders with information regarding price volatility.
John Bollinger suggests using them with two or three other non-correlated indicators that provide more concrete market signals. It is important to understand that no indicator is absolute so it is useful to use indicators based on different types of data. Some of the most prominent indicators that can be used with Bollinger Bands are the moving average divergence/convergence (MACD) and the relative strength index (RSI).
*Source: Investopedia


