PREVIOUS TRADING DAY EVENTS – 26 May 2023
Announcements:
This inflation-related data could prompt the Federal Reserve to raise interest rates again next month. According to previously reported labour data and strong PMI data, the labour market is resilient enough and business activity is high, adding to the probability of one more hike in June.
“Companies and consumers are in agreement that there are plenty of green shoots to like at the start of springtime and right now the economy is miles and miles away from the cliffs of recession,” said Christopher Rupkey, chief economist at FWDBONDS in New York. “Fed officials won’t be able to pause their rate hikes, it looks like demand is picking up, not slowing down as it is supposed to do when the Fed hikes rates.”
The Fed’s Rate Hike decision will be affected by whether an agreement is reached to raise the government borrowing cap. April’s employment data and the NFP report expected next Friday, 2nd of June, will also have an impact.
“If the debt ceiling is resolved without too much damage to sentiment, and banking troubles don’t resurface, then the broad sweep of data so far could make for an interesting debate at next month’s meeting, though we still believe the Fed will leave rates unchanged,” said Michael Feroli, chief U.S. economist at JPMorgan in New York.
Source:
The U.S. Stock Market closed higher on Friday even though no final deal was reached last week, but only talks of progress.
All eyes are on these talks since in case the U.S. default on its debt, even for just a few days, this could drive up interest rates and undermine confidence in the U.S. dollar.
______________________________________________________________________
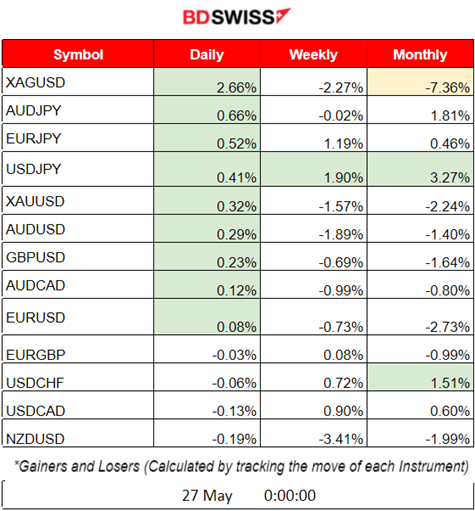
Summary Daily Moves – Winners vs Losers (26 May 2023)
- Silver (XAGUSD) reached the top of the winners’ list yesterday with 2.66% gains while for the month it is the top loser so far with -7.36% price change overall.
- The previous week USDJPY was the top winner with 1.90% price change.
- This month so far USDJPY leads with 3.27% change, followed by USDCHF having just 1.51% change.
______________________________________________________________________
News Reports Monitor – Previous Trading Day (26 May 2023)
Server Time / Timezone EEST (UTC+03:00)
- Midnight – Night Session (Asian)
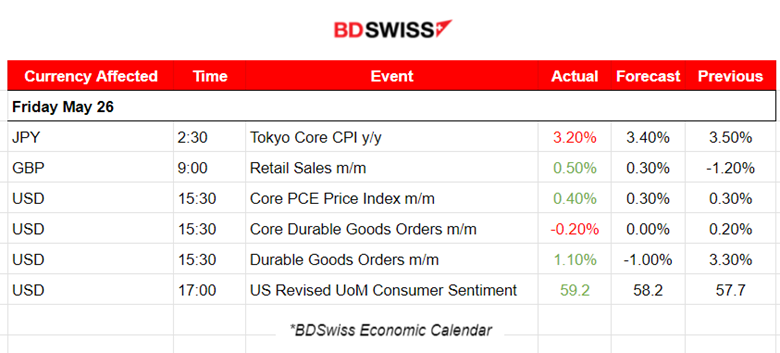
At 2:30, the annual Tokyo Core CPI figure was released. It was low enough, at 3.20%, and lower than the expected 3.40% figure. Tokyo’s Core inflation is slowing from the previous month’s increase but remains well above the central bank’s 2% target. No major impact on the market with this release.
- Morning – Day Session (European)
The U.K. Retail Sales figures were released at 9:00. Retail sales volumes are estimated to have risen by 0.5% in April 2023, following a fall of 1.2% in March 2023. GBP has appreciated slightly due to the release against other currencies.
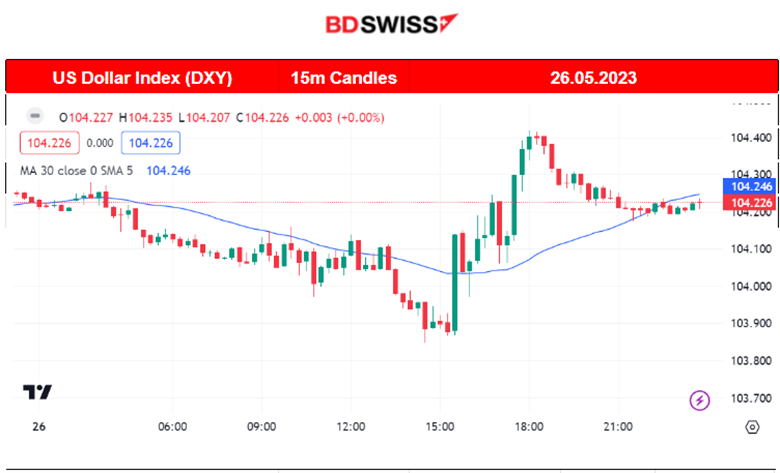
At 15:30, important figures were released again for the U.S., namely, the monthly Core PCE Price Index and Durable Goods data. The PCE Prices figure, a key index of U.S. prices was reported higher in April and consumer spending rebounded, a sign of persistent inflationary pressures. Durable goods orders figures were reported lower with a negative -0.20%, change for the Core Durable goods. The USD experienced high appreciation against other currencies. The DXY reversed and moved higher during the trading day after these releases.
General Verdict:
______________________________________________________________________
FOREX MARKETS MONITOR
EURUSD (26.05.2023) Chart Summary
Server Time / Timezone EEST (UTC+03:00)
Price Movement
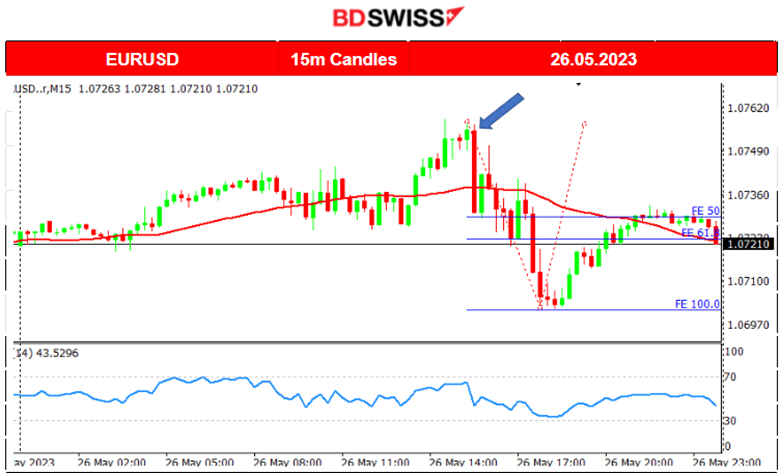
EURUSD started moving steadily upwards and close to the 30-period MA. At 15:30 the PCE Prices and Durable Goods figure releases for the U.S. had an impact on the USD and caused a shock for the USD pairs. The EURUSD dropped as USD was hit with depreciation at that time, with the price reversing and crossing the MA while moving downwards until it found strong intraday support at 1.07020. Retracement followed back to the mean.
Trading Opportunities
The pair experienced a reversal after the shock at 15:30. It rapidly fell crossing the MA and found support. That was the end of the shock and the start of the retracement. Using the Fibonacci Expansion tool we can see where the 61.8 Fibo level is that the pair, at least, retraces after such a shock.
EURGBP (26.05.2023) Chart Summary
Server Time / Timezone EEST (UTC+03:00)
Price Movement
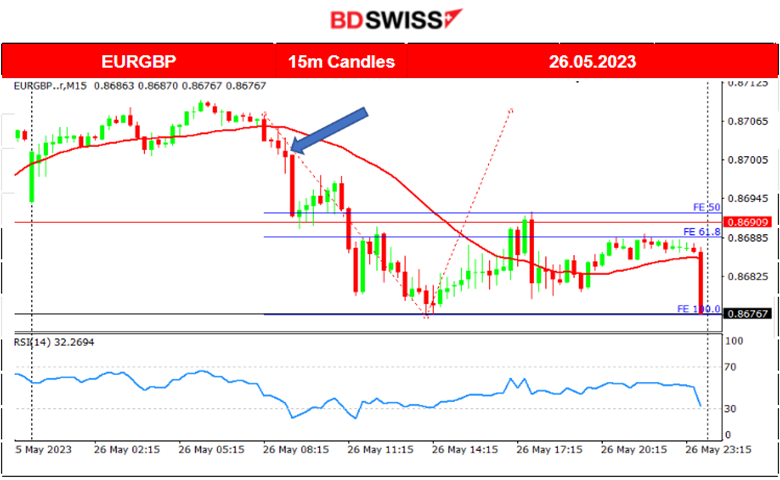
EURGBP started to move lower with the release of the Retail Sales m/m change figure for the U.K. at 9:00 (blue arrow). The change was way higher than the previous figure and more than expected, causing the GBP to appreciate. The pair moved lower and lower rapidly with a rather unstable and volatile path but eventually found resistance near 0.86770. Retracement followed back to 61.8% of that downward movement and even that support level was broken later with retracement being completed at the 50% level, as depicted by the Fibonacci Expansion tool.
____________________________________________________________________
EQUITY MARKETS MONITOR
NAS100 (NDX) 4-Day Chart Summary
Server Time / Timezone EEST (UTC+03:00)
Price Movement
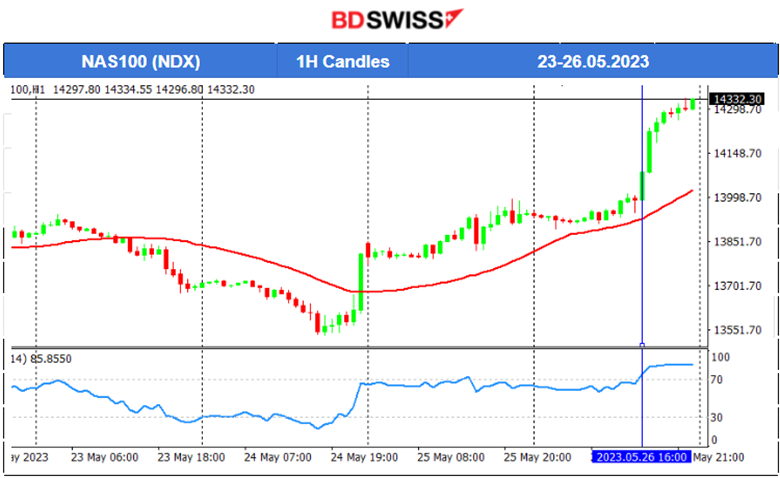
The index started on the 24th of May to show a reversal in price as it moved upwards crossing the 30-period MA and continuing with its upward path. The other U.S. indices, US 30 and S&P 500, formed similar paths indicating resilience in dropping but moving more sideways. However, on the 26th of May, all indices jumped ahead of the Memorial Day holiday for the U.S. on the 29th. Next week, we expect that the U.S. indices will be affected greatly by the Labor Data releases on the 2nd of June.
______________________________________________________________________
COMMODITIES MARKETS MONITOR
USOIL (WTI) 4-Day Chart Summary
Server Time / Timezone EEST (UTC+03:00)
Price Movement
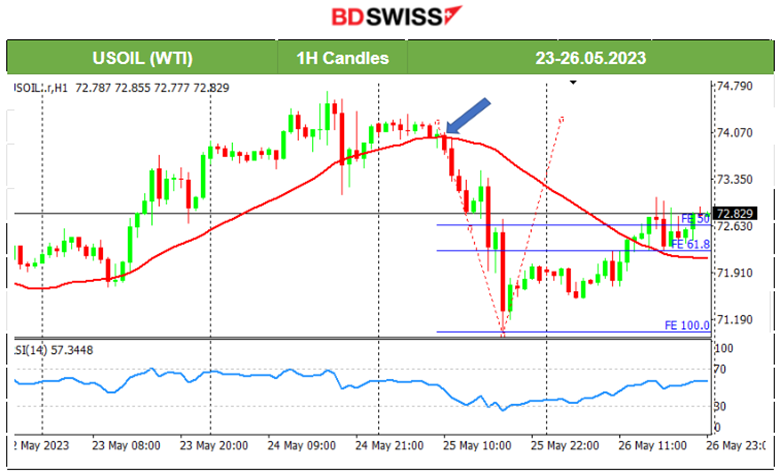
Crude experienced a price reversal as it dropped rapidly on the 25th of May, crossing the MA and moving further downwards with a nearly 3 USD drop. After this high deviation from the MA, a retracement followed when important resistance levels broke near 72.1 USD/b.The retracement continued even higher than the 50% fibo level.
XAUUSD (Gold) 4-Day Chart Summary
Server Time / Timezone EEST (UTC+03:00)
Price Movement
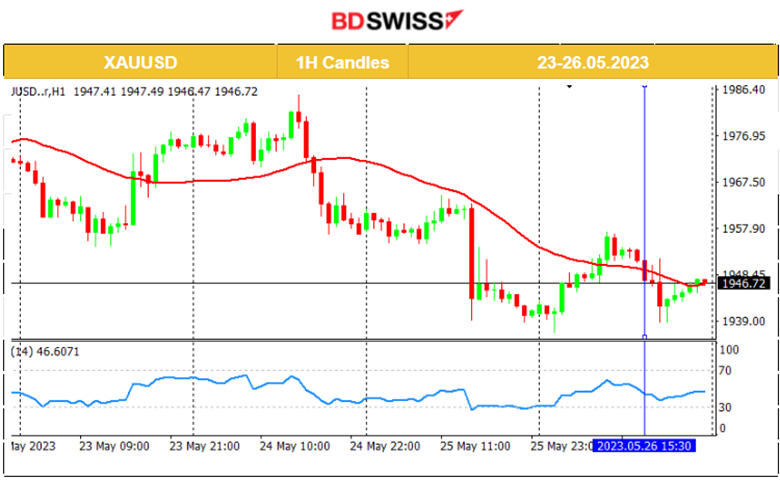
On the 25th of May, Gold experienced a drop when the U.S. Preliminary GDP and Unemployment Claims data were released. USD had appreciated greatly at that time. It experienced a nearly 21 USD drop at that time and found support at 1939 USD/oz. Retracement followed and Gold settled on a less volatile sideways path. On the 26th of May, it dropped when the PCE Prices and Durable Goods data were released at 15:30, testing once more the support near 1939 USD/oz. It eventually retraced back to the 30-period MA.
______________________________________________________________
News Reports Monitor – Today Trading Day (29 May 2023)
Server Time / Timezone EEST (UTC+03:00)
- Midnight – Night Session (Asian)
No significant news announcements, no special figure releases.
- Morning – Day Session (European)
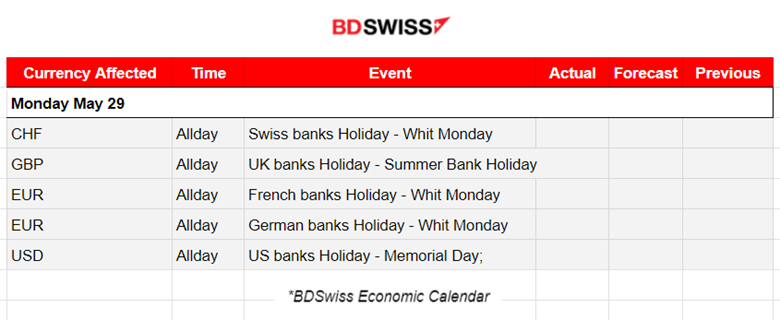
No important figure releases as most regions experience a holiday. Early closing is taking place for the U.S. indices and the U.S. Stock Market is closed for the day.
General Verdict:
______________________________________________________________


