Previous Trading Day’s Events (18 Dec 2023)
“The fiscal woes of the last month have clearly left their mark on the German economy, with the country’s most prominent leading indicator showing just how difficult it will be for the economy to bounce back,” said Carsten Brzeski, global head of macro at ING.
Source: https://www.reuters.com/markets/europe/german-business-sentiment-falls-december-ifo-2023-12-18/
______________________________________________________________________
Winners vs Losers
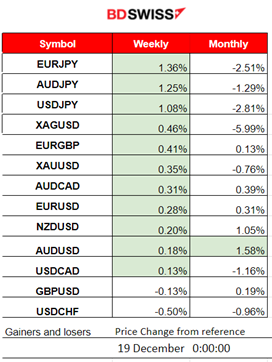
JPY pairs (JPY as quote) have moved to the upside significantly after the BOJ policy rate announcement and the JPY depreciation that followed. EURJPY has moved to the top reaching 1.36% gains for the week. This month AUDUSD has the highest gains, 1.58% so far.
 ______________________________________________________________________
News Reports Monitor – Previous Trading Day (18 Dec 2023)
Server Time / Timezone EEST (UTC+02:00)

- Midnight – Night Session (Asian)
No important news announcements, no special scheduled releases.
- Morning–Day Session (European and N. American Session)
86.4 points was the reported figure for the German Ifo Business Climate report. The headline business climate index for Germany due Monday from the country’s Ifo Economics Institute was expected to improve to 87.8 points from 87.3 last month but eventually no. Grim picture.
General Verdict:
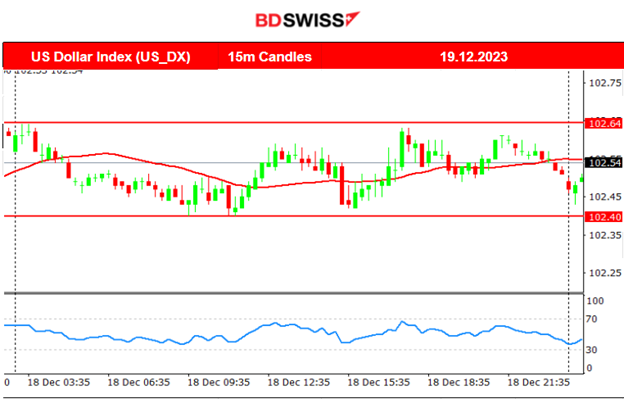
Indices moved higher after breaking consolidation
 ____________________________________________________________________
FOREX MARKETS MONITOR
EURUSD (18.12.2023) Chart Summary
Server Time / Timezone EEST (UTC+02:00)
Price Movement
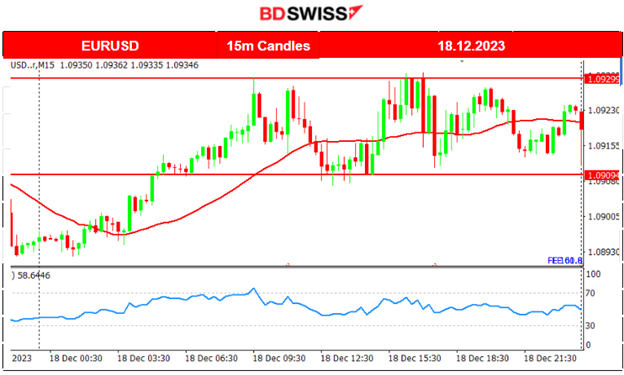
The EURUSD moved higher early, experiencing unusual volatility during the Asian session yesterday and then after the start of the European session it experienced low volatility until the end of the trading day. During that session, the path was sideways around the 30-period MA with no big deviations from the mean since there was absence of significant news and scheduled figure releases. The pair closed the day higher overall.
 ___________________________________________________________________
CRYPTO MARKETS MONITOR
BTCUSD (Bitcoin) 4-Day Chart Summary
Server Time / Timezone EEST (UTC+02:00)
Price Movement
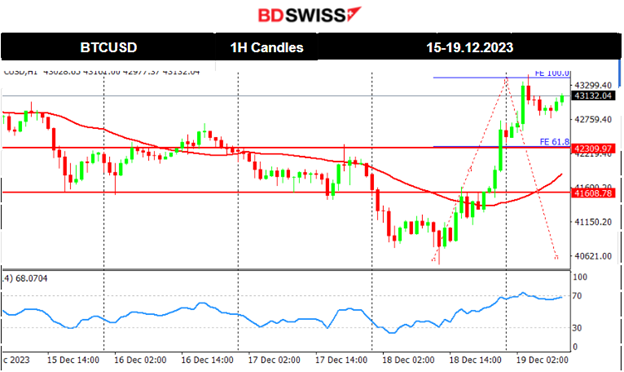
Bitcoin fell significantly as 41500 USD was a critical support. We see that eventually due to low volatility, the price formed a triangle that was broken and bitcoin experienced this huge drop, reaching near 40700 USD. On the 18th Dec, its price reversed remarkably to the upside. Bitcoin crossed the 30-period MA on its way up and moved beyond the 42300 USD resistance reaching eventually the next resistance at 43300 USD. Retracement took place but is not yet completed since it did not reach the 61.8 Fibo level, which it might be the next possible price target.
Crypto sorted by Highest Market Cap:
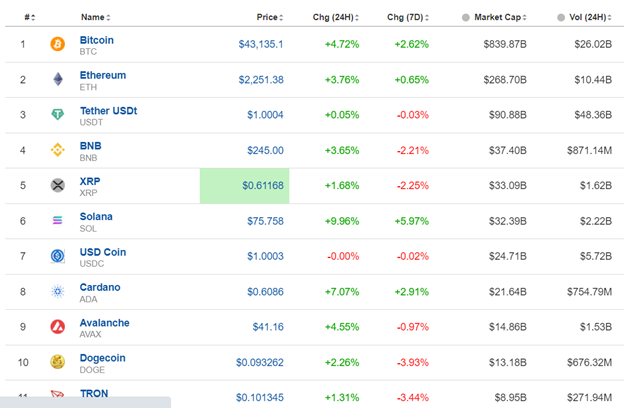
Most cryptos saw gains in the last 24 hours. Solana gained the most in this list having nearly 10% gains.
Source: https://www.investing.com/crypto/currencies
______________________________________________________________________
EQUITY MARKETS MONITOR
NAS100 (NDX) 4Hour Timeframe Chart Summary
Server Time / Timezone EEST (UTC+02:00)
Price Movement
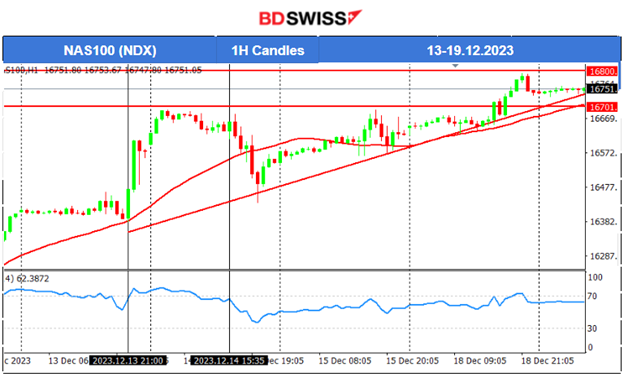
Risk-on sentiment as market participants are pushing U.S. stocks higher and higher. NAS100 and other indices are clearly on an uptrend. This month has been good for stocks especially since the Fed is discussing rate cuts, thus future lower borrowing costs for businesses. During the FOMC news, their statements caused huge volatility in the market causing the indices to jump. After the retracement that took place on the 14th Dec, the market still is bullish and is reaching the highs again. Volatility levels dropped, forming a triangle. Yesterday the triangle was broken and the index broke the resistance near 16700 USD, moving upwards further and reaching 16800 USD before a retracement took place back to 16730 USD soon after.
 ______________________________________________________________________
COMMODITIES MARKETS MONITOR
USOIL (WTI) 4-Day Chart Summary
Server Time / Timezone EEST (UTC+02:00)
Price Movement
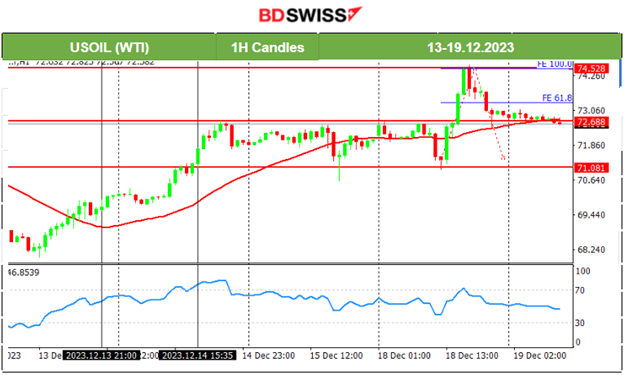
Crude moved upwards last week after central bank news and statements. The USD also experienced further weakening. Its price eventually reached 72.5 USD/b which served as a critical resistance level. This level was tested many times without a breakout. The path eventually remained sideways, experiencing high volatility and consolidation. Yesterday, the price moved upwards breaking consolidation and the resistance at 72.70 USD/b reaching the next resistance near 74.5 USD/b before reversing back to the mean.
XAUUSD (Gold) 4-Day Chart Summary
Server Time / Timezone EEST (UTC+02:00)
Price Movement
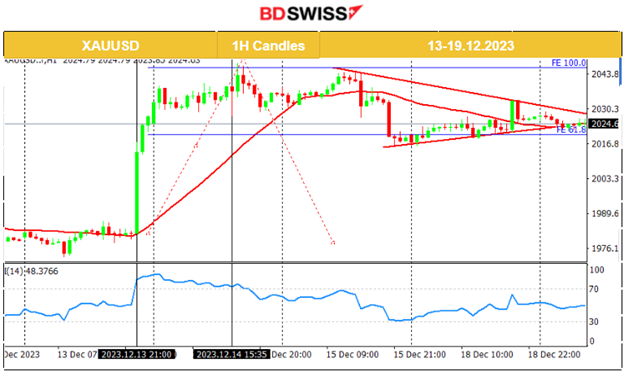
With the FOMC and Fed Rate release the dollar had depreciated greatly enhancing the upward path. Gold jumped until it reached the resistance at 2040 USD/oz and remained settled, around that level. The RSI signalled a bearish divergence and eventually price fell as indicated to the 61.8 Fibo level as depicted on the chart. Gold continued by testing the 2034 USD/oz without success and now is settled near 2026 USD/oz.
 ______________________________________________________________
News Reports Monitor – Today Trading Day (19 Dec 2023)
Server Time / Timezone EEST (UTC+02:00)
- Midnight – Night Session (Asian)
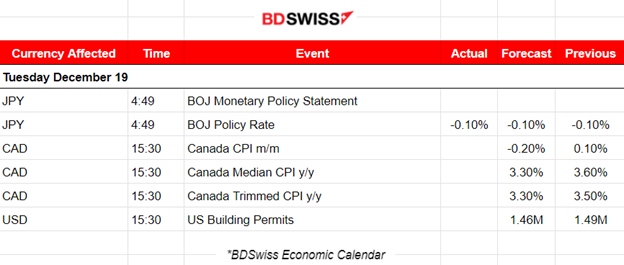
The Bank of Japan (BoJ) decided to keep its policy rate steady at -0.10%. An ultra-loose monetary policy unchanged. The decision was in line with market expectations but the JPY, however, experienced strong depreciation at the time of the release affecting JPY pairs greatly. The USDJPY jumped nearly 100 pips at the time of the release.
- Morning–Day Session (European and N. American Session)
The inflation-related data for Canada, CPI changes, are going to be released at 15:30 causing a potential negative impact on CAD. The market is expecting lower figures as interest rates remain high for now. During the press conference at 8:30, the JPY pairs were again affected greatly causing a sudden down-up shock effect on pairs.
General Verdict:
______________________________________________________________


