

PREVIOUS TRADING DAY EVENTS – 29 March 2023
Announcements:
They state that:
The U.K.’s banking system has sufficient capital and liquidity and it is well prepared to support the economy under stress. It remains resilient even when the U.S. reported bank failures. It is well-capitalised and ready to support the economy in a period of higher interest rates even if economic conditions are worse than expected. However, U.K. household finances are still being stretched by increased living costs and mortgage payments.
The FPC is maintaining the U.K. Countercyclical Capital Buffer (CCyB) rate at 2%. There is an urgent need to increase resilience in market-based finance. The FPC recommends that TPR takes action as soon as possible to mitigate financial stability risks by specifying the minimum levels of resilience for the Liability Driven Investment (LDI) funds. LDI mandates in which pension scheme trustees may invest. The FPC judges that Money Market Funds (MMFs) should be able to withstand severe but plausible levels of investor outflows without amplifying stress or increasing risks of financial stability.
The Bank’s system-wide exploratory scenario will investigate the behaviours of banks and non-bank financial institutions, following severe but plausible stress to financial markets. This will be an exploratory exercise focused on market resilience and its importance for financial stability.
Source: https://www.bankofengland.co.uk/financial-policy-summary-and-record/2023/march-2023
SVB and Signature banks became the second and third largest bank failures in U.S. history. After the sale of Credit Suisse to UBS, and after SVB’s assets were sold to First Citizens Bancshares, the markets started to stabilise.
Source: https://www.reuters.com/business/finance/fed-was-discussions-with-silicon-valley-bank-use-discount-window-before-collapse-2023-03-29/
Economists are still trying to predict how stocks will move in the future while it is still uncertain if the Federal Reserve (FED) is going to increase rates. Banks are stabilising, inflation is still high and the labour market is strong. How will the FED move considering all these? Consumers expect inflation to remain high according to the CB Consumer Confidence survey released on March 28th.
Source: https://www.bloomberg.com/news/articles/2023-03-28/stock-market-today-dow-s-p-live-updates?srnd=markets-vp#xj4y7vzkg
______________________________________________________________________
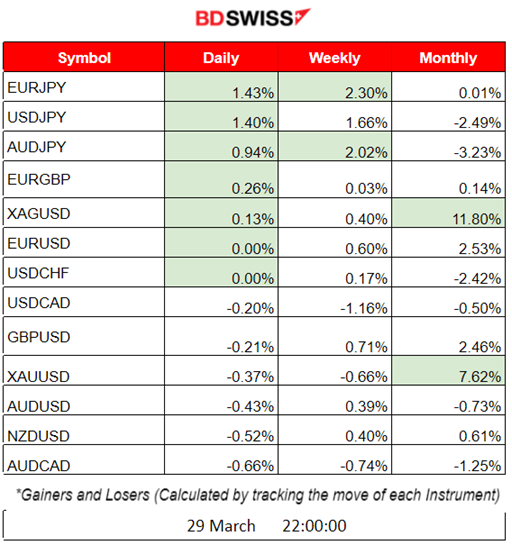
Summary Daily Moves – Winners vs Losers (29 March 2023)
______________________________________________________________________
News Reports Monitor – Previous Trading Day (29 March 2023)
Server Time / Timezone EEST (UTC+03:00)
- Midnight – Night Session (Asian)
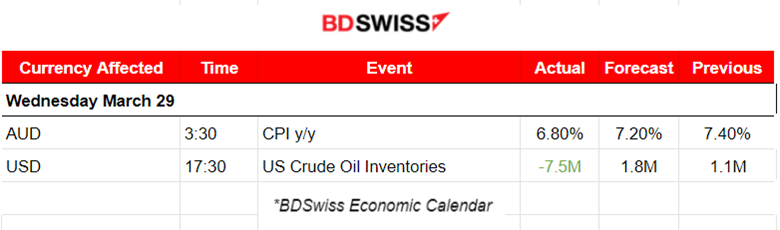
The Consumer Price Index (CPI) figure for Australia came out this morning at 3:30 (Asian Trading Session) less than expected, at 6.80%, causing the AUD to depreciate. AUDUSD and AUDNZD fell by about 20 and 30 pips respectively at that time while retracements followed after this intraday shock.
- Morning – Day Session (European)
The U.S. Crude Oil inventories change figure was released at 17:30. Crude Inventory Data show a negative change -7.5M barrels! That’s huge and it explains the recent price increase. With the recent cut in supply and the turmoil that governs the market, the price is expected to rise further.
General Verdict:
– Major releases cause sharp intraday shocks followed by retracements.
– Long-lasting moves are the results of fundamentals, as in the case of rising Oil prices.
– The USD is affected greatly by the fundamentals and causes unusual volatility, as observed in the FX markets – big intraday deviations from the Moving Averages.
______________________________________________________________________
FOREX MARKETS MONITOR
EURUSD 4-Day Chart Summary
Server Time / Timezone EEST (UTC+03:00)
Price Movement
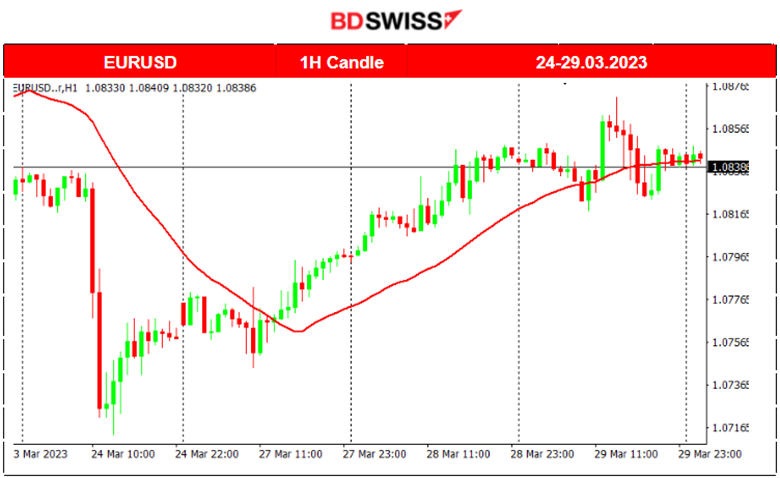
The price of EURUSD reversed significantly starting from the 24th of March, crossing the 30-period MA on the 27th and continuing to move upwards, above the MA, until the 29th. These moves are mainly driven by the USD which has recently been greatly affected by the statements and speeches provided by Central Banks and Government officials.
EURUSD (29.03.2023) Chart Summary
Server Time / Timezone EEST (UTC+03:00)
Price Movement
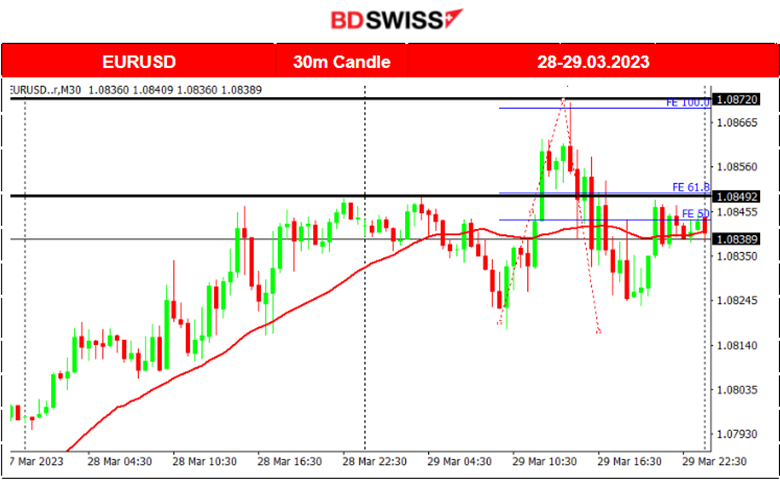
The pair experienced intraday volatility which resulted in the price moving sideways around the 30-period MA, with some deviations from the mean of 20-30 pips. It started to fall during the morning hours until 10:00. After the European Markets’ opening, the pair experienced a rapid price reversal, moving upwards and breaking the significant resistance level of 1.08492. It moved close to 1.08720 before it reversed back to the mean and continued its sideways movement around the MA.
Trading Opportunities
After breaking the resistance, it was estimated that the price will eventually reach the next resistance near 1.087. It did. Moreover, due to no significant news to be released, we could safely assume that retracements are more probable to happen and that the resistance 1.087 is the end of the rapid move upwards. The Fibonacci Expansion tool helps in finding the retracement back to at least 61.8% of the movement which is actually the previous resistance that was broken.
Our analysis is on TradingView: https://www.tradingview.com/chart/EURUSD/pentbSxb-EURUSD-Breaks-Resistance-29-03-2023/
______________________________________________________________________
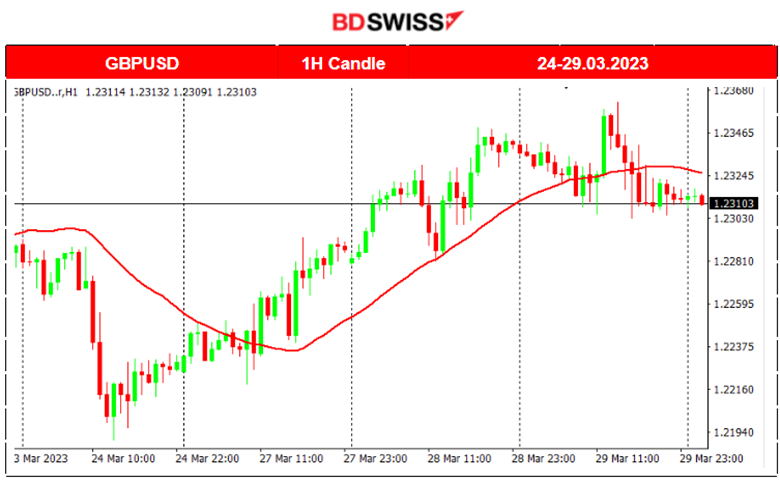
GBPUSD 4-Day Chart Summary
Server Time / Timezone EEST (UTC+03:00)
Price Movement
The price of GBPUSD followed the same path as the EURUSD since the pairs are mainly driven by the USD. With no major news or figures to be released for the GBP that have a higher impact in the markets than USD, we are experiencing USD-driven pairs.
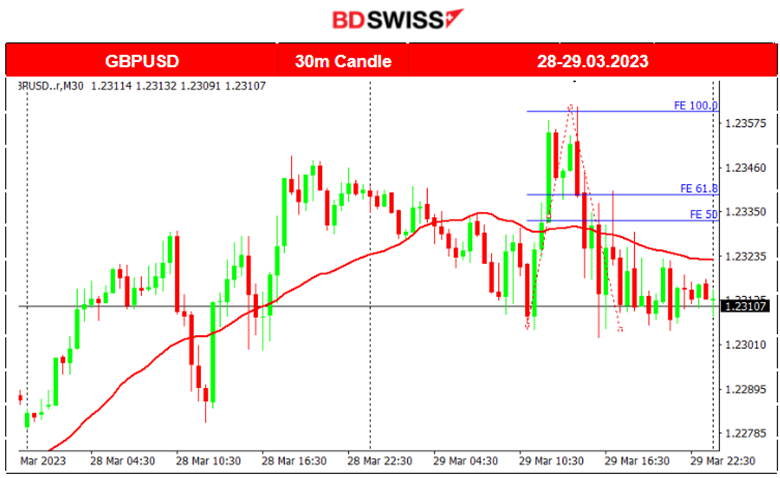
GBPUSD (29.03.2023) Chart Summary
Server Time / Timezone EEST (UTC+03:00)
Price Movement
GBPUSD also experienced volatility on the 29th of March, following a similar path to EURUSD. The price reversal started near 10:00, followed by another one when the sharp increase in price stopped. The pair reversed fully after that and low volatility followed with the pair moving again below the 30-period MA.
Trading Opportunities
The price was testing the resistance at 1.23600 when it finally stopped, indicating the end of the move. While using the Fibonacci retracement levels, we identified the 61.8% level at which the price would at least retrace. Eventually, the pair experienced a full retracement.
Our analysis is on TradingView:
https://www.tradingview.com/chart/GBPUSD/8XjdGpCO-GBPUSD-Ready-Retracement-29-03-2023/
______________________________________________________________________
EQUITY MARKETS MONITOR
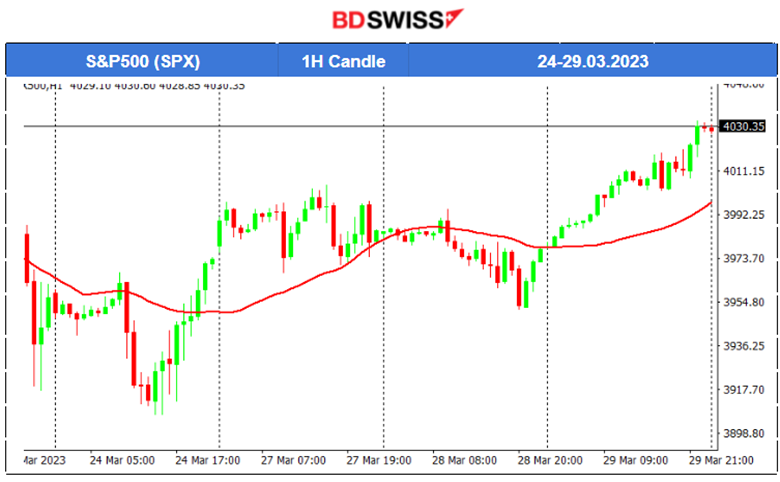
NAS100 (NASDAQ – NDX) 4-Day Chart Summary
Server Time / Timezone EEST (UTC+03:00)
Price Movement
U.S. Stocks move higher as investors prefer more risky assets. Since the 24th of March, the index moves upwards but it experiences high volatility too. The price reversed on the 28th of March, crossing the 30-period MA upwards and continuing its path to reach over the 4000 USD level.
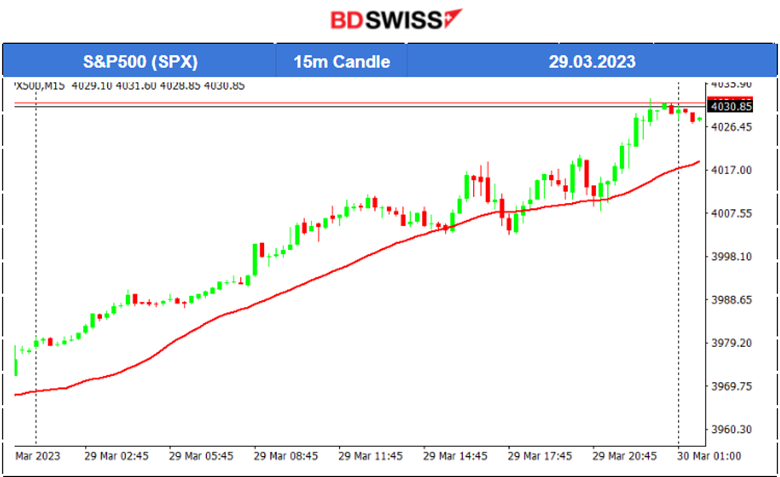
NAS100 (NASDAQ – NDX) (29.03.2023) Chart Summary
Server Time / Timezone EEST (UTC+03:00)
Price Movement
The index follows a clear upward trend as the risk-on mood is on reviving stocks. This is probably due to corporate credit markets that are starting to heal from the banking crisis. It’s important to note that this rise could be a temporary medium-term shock that results because of over-optimism about the banking sector and economic conditions, in general. The market has not crashed, surprisingly, neither has it gone significantly higher.
______________________________________________________________________
COMMODITIES MARKETS MONITOR
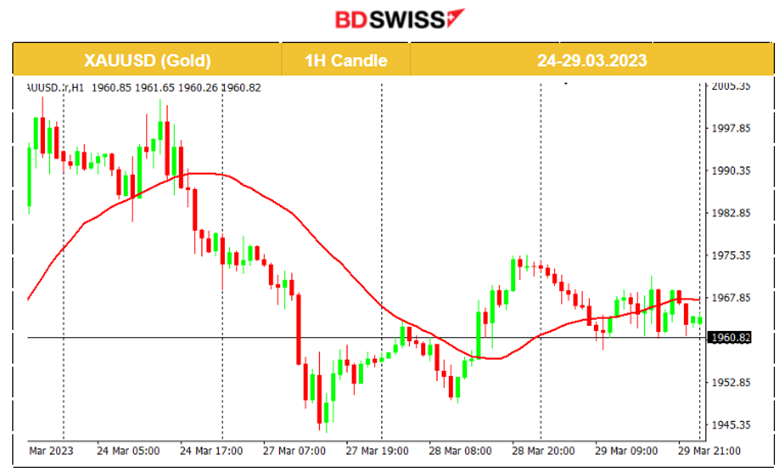
GOLD (XAUUSD) 4-Day Chart Summary
Server Time / Timezone EEST (UTC+03:00)
Price Movement
Gold reversed on the 24th of March and crossed below the 30-period MA, signalling the end of its upward movement. Eventually, it continued with a downward movement below the MA and then reversed on the 28th to settle, experiencing lower volatility until the end. With more positive statements from the U.S. regarding the banking sector, investors moved to risk-on mode, dropping Gold and acquiring more risky assets.
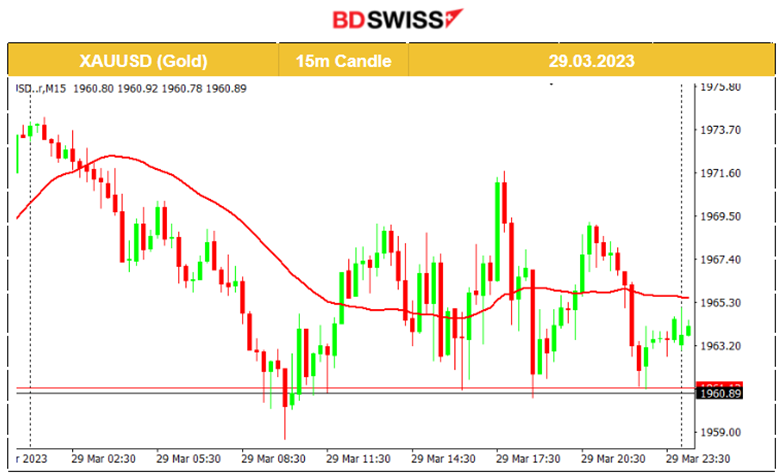
GOLD (XAUUSD) (29.03.2023) Chart Summary
Server Time / Timezone EEST (UTC+03:00)
Price Movement
Gold price experiences some volatility as it moves sideways and around the 30-period MA. With a maximum of 5 USD deviations from the mean, the 1960 USD level acts as a support.
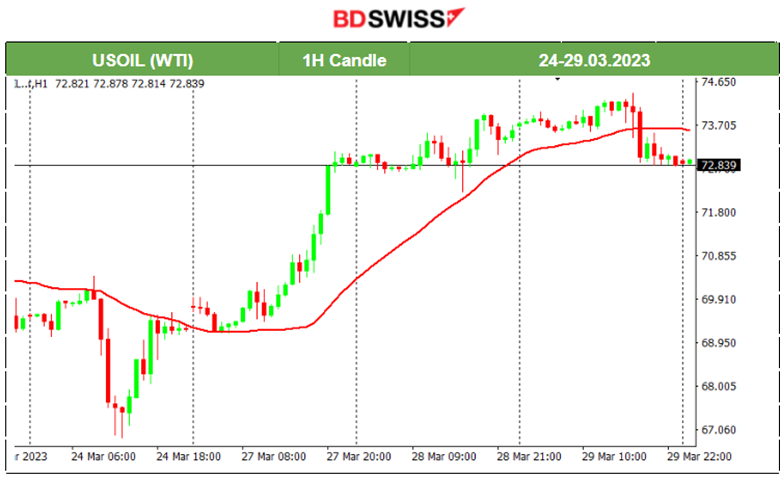
USOIL (WTI) 4-Day Chart Summary
Server Time / Timezone EEST (UTC+03:00)
Price Movement
Since the 24th of March, the price of U.S. Crude has been rising and moving above the 30-period MA until the 29th of March. The U.S. Crude Oil inventories figure was released at 17:30 showing that, since the previous week, the change in inventories of commercial firms was negative, namely -7.5M barrels. This confirmed less supply in the market, with steady demand pushing the price upwards. The price eventually settled at 72.9 USD/barrel.
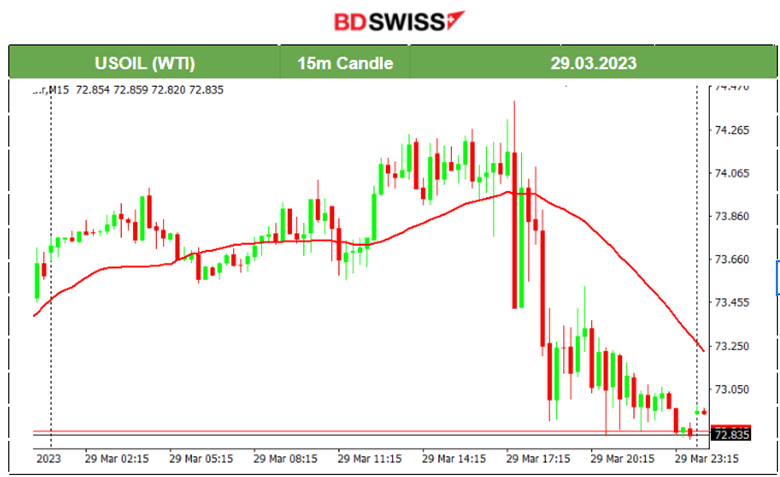
USOIL (WTI) (29.03.2023) Chart Summary
Server Time / Timezone EEST (UTC+03:00)
Price Movement
Crude was experiencing an upward and steady movement above the 30-period MA until 17:30 when the U.S. Crude Oil inventories figure was released. At that time, Crude’s price fell sharply, reversing and continuing the downward path until the end of the day.
Trading Opportunities
Observing the changes in inventories is not enough to predict the future price movement of U.S. Crude Oil. The weekly changes in inventories for 2023 (almost 3 months) were mostly positive, with the price going down overall, reaching 64.4 USD on the 20th of March. Now it is reversing sharply. This figure release did not create much room for retracement and since the price fell only by 1 USD, it was late for a push upwards even if a small retracement took place at the end.
______________________________________________________________
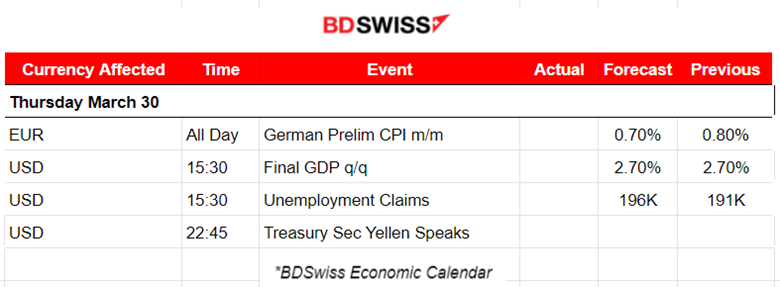
News Reports Monitor – Today Trading Day (30 March 2023)
Server Time / Timezone EEST (UTC+03:00)
- Midnight – Night Session (Asian)
No significant figure releases. No intraday shocks are expected during that session.
- Morning – Day Session (European)
The U.S. GDP figure is quite important and will possibly have a strong impact on the USD pairs at that time. Depending on the figure, it will have a big or small sharp movement on either side, up or down. However, what matters the most for the trader is the retracement afterwards.
An indication of how the labour market is doing will be given by the Unemployment Claims figure at 15:30. This is important, especially now that the market is shaking due to too much uncertainty.
- Night – Evening Session (North American)
Treasury Secretary Yellen speaks at the Annual National Association for Business Economics Economic Policy Conference, in Washington DC. It is late and will probably not have a special impact at that time.
General Verdict:
- The USD will be hit again with significant figures scheduled to be released. A sharp move is expected at that time. A bigger movement size is expected during the GDP figure release.
______________________________________________________________


