

Previous Trading Day’s Events (07 Feb 2024)
______________________________________________________________________
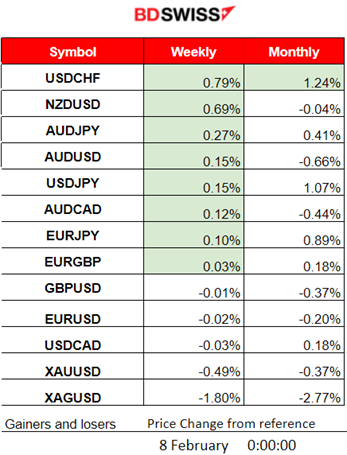
Winners vs Losers
USDCHF managed to reach the top this week with 0.79% gains. It is also leading this month with 1.24% gains so far.
______________________________________________________________________
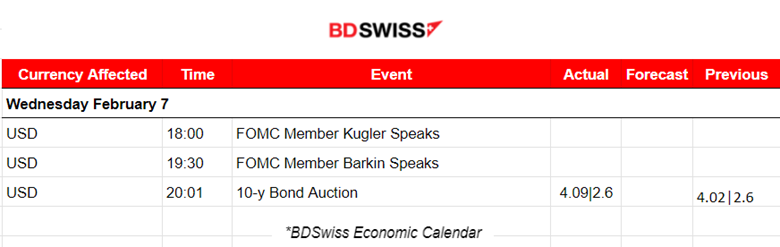
News Reports Monitor – Previous Trading Day (07 Feb 2024)
Server Time / Timezone EEST (UTC+02:00)
- Midnight – Night Session (Asian)
No important news announcements, no special scheduled releases.
- Morning–Day Session (European and N. American Session)
No important news announcements, no special scheduled releases.
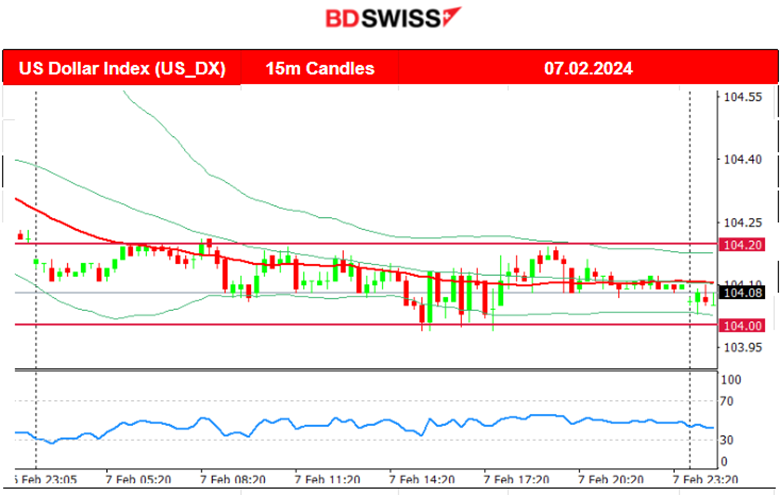
General Verdict:
- Low volatility, absence of important figure releases. The dollar barely was affected. The dollar index moved sideways with low volatility and closed the trading day almost flat.
- Gold saw more volatility during the start of the N. American session but eventually closed flat overall.
- Crude oil climbed over 74 USD/b.
- U.S. stocks moved higher. All benchmark indices experienced movement to the upside.
____________________________________________________________________
FOREX MARKETS MONITOR
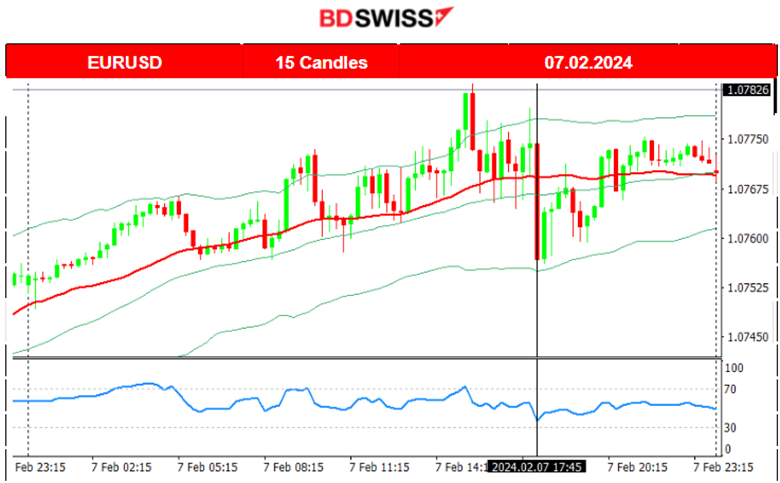
EURUSD (07.02.2024) 15m Chart Summary
Server Time / Timezone EEST (UTC+02:00)
Price Movement
The pair moved steadily higher and while being over the 30-period MAduring the most of the trading day. Near the start of the N.American session though, it reversed after hitting resistance, crossing the MA on its way down and finding support near 1.07560. After the unsuccessful breakout to the downside, it moved again upwards returning back to the MA.
___________________________________________________________________
CRYPTO MARKETS MONITOR
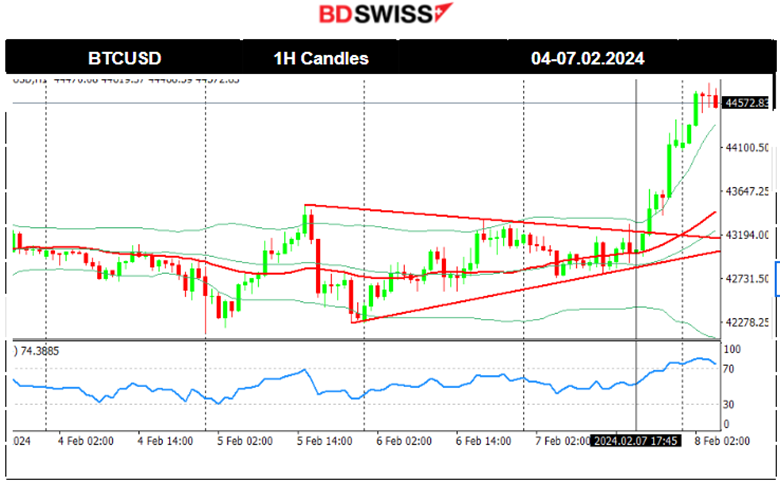
BTCUSD (Bitcoin) Chart Summary 1H Timeframe
Server Time / Timezone EEST (UTC+02:00)
Price Movement
On the 5th Feb, Bitcoin quickly climbed to find the resistance at near 43,500 USD before reversing again quite rapidly and crossing the 30-period MA on its way back, closing the day lower at the support near 42,250 USD. On the 6th Feb, it moved upwards steadily finding resistance at near 43,360 USD before reversing to the mean. A triangle was formed as volatility levels seemed to lower. On the 7th Feb, the price broke the triangle to the upside and eventually reached the resistance near 44,750 USD on the 8th Feb. Let’s see if a retracement will follow and if the price will retrace to 44,100 USD (61.8 Fibo).
Crypto sorted by Highest Market Cap:
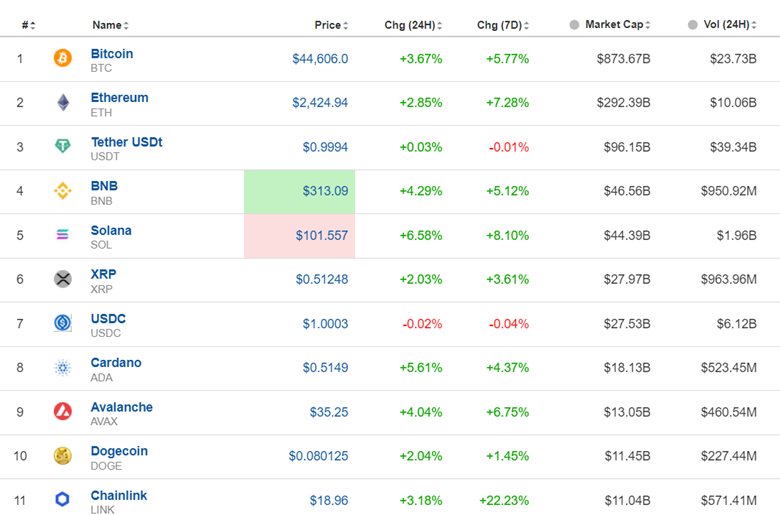
Volatility is back and the crypt market shows performance. Just like bitcoin, the other crypto found their way up. Chainlink, in this list, leads with 22.23% gains the last 7 days.
Source: https://www.investing.com/crypto/currencies
______________________________________________________________________
EQUITY MARKETS MONITOR
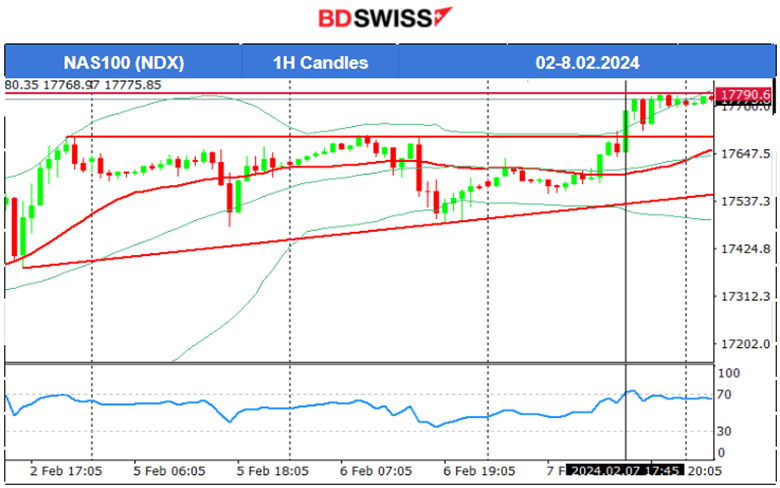
NAS100 (NDX) 4-Day Chart Summary
Server Time / Timezone EEST (UTC+02:00)
Price Movement
On the 6th Feb, the index did not manage to break the resistance at near 17,700 USD and a reversal again followed back to the support at near 17,500 USD. Another reversal sent the index back to the mean. A clear consolidation phase kept the index on the sideways, however experiencing high volatility on the way. On the 7th Feb, the index moved higher breaking the triangle as depicted on the chart and settling near 17790.
______________________________________________________________________
COMMODITIES MARKETS MONITOR
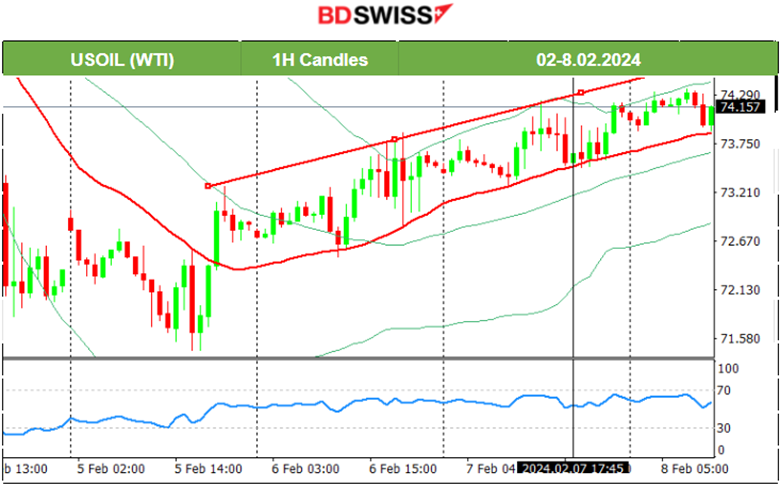
USOIL (WTI) 4-Day Chart Summary
Server Time / Timezone EEST (UTC+02:00)
Price Movement
Crude’s price reversed from the downtrend following the RSI’s signals of bullish divergence, as mentioned in the previous analysis. After it reached 74.5 USD/b on the 5th Feb, it reversed to the upside, crossing the 30-period MA on the way up and finding resistance at near 73.2 USD/b before retracing. On the 6th Feb, the price moved steadily upwards while being above the 30-period MA. The same happened on the 7th Feb. This indicates a short-term upward trend and the RSI does not signal any halt soon.
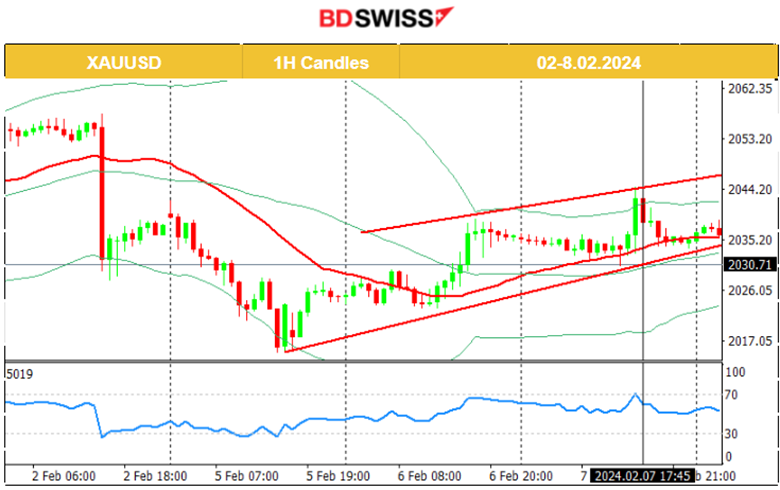
XAUUSD (Gold) 4-Day Chart Summary
Server Time / Timezone EEST (UTC+02:00)
Price Movement
Gold, on the 5th Feb, broke the 2030 USD/oz support moving lower, reaching the support near 2015 USD/oz. Retracement followed and the price returned back to the 61.8 Fibo, settling at near 2025 USD/oz. The 6th of Feb was a good day for Gold as it moved to the upside and remained higher for the trading day, closing at near 2035 USD/oz. On the 7th Feb, Gold remained on the same levels, the MA though is signalling an upward trend.
______________________________________________________________
News Reports Monitor – Today Trading Day (07 Feb 2024)
Server Time / Timezone EEST (UTC+02:00)
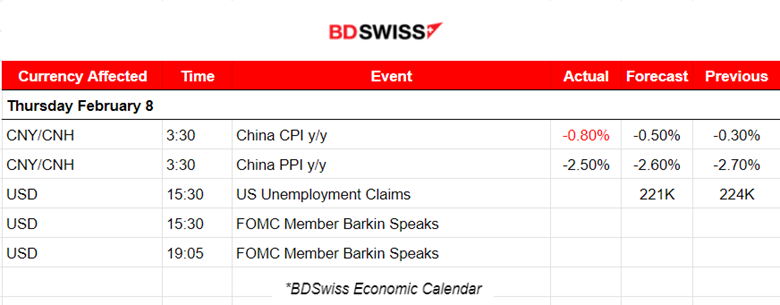
- Midnight – Night Session (Asian)
China’s inflation is coming dangerously lower, Consumer Prices drop at the fastest pace since the global financial crisis. China’s producer prices also declined for a 16th month in January. No major impact was recorded at the time of the release at 3:30.
- Morning–Day Session (European and N. American Session)
Unemployment claims are expected to be reported lower, coinciding with the recent NFP data showing strength for the U.S. labour market. Staying close to the 200K level is something normal to expect after these recent developments and new data are revealed.
General Verdict:
______________________________________________________________


