Rates as of 05:00 GMT
Market Recap
A stronger dollar and a stronger US stock market. With US growth prospects improving, the widening growth differential between the US and other economies is leading to a supportive environment for both the dollar and US stocks. The stock market has continued to rally despite a steady rise in the market’s pricing of the peak fed funds rate, back to the 3.65% level that prevailed before last week’s surprisingly weak US consumer price index (CPI).
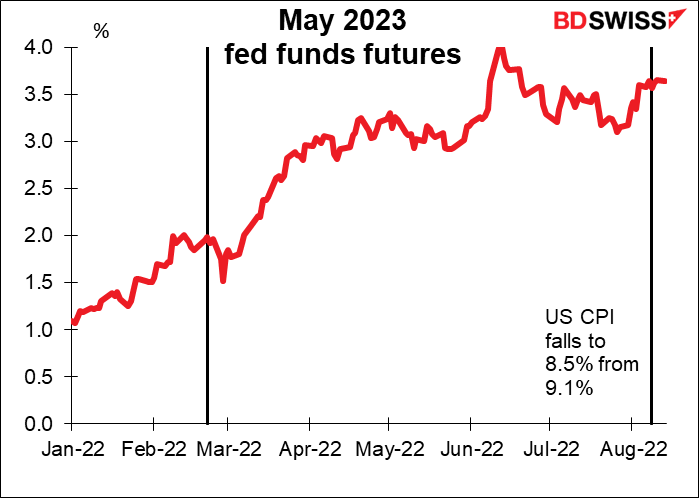
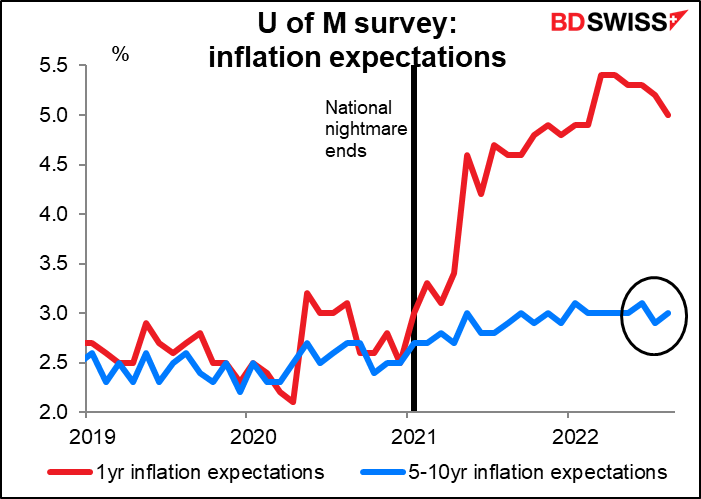
On Friday, the 1yr ahead inflation expectations in the U of M survey fell but the 5yr-10yr inflation estimate rose. This caused an increase in the probability of a larger rate hike in September, as market participants remember that Fed policymakers cited the rise in this figure back in June a key factor that led to them hiking by 75 bps rather than 50 bps as planned at that meeting.
There were also a number of hawkish comments from Richmond Fed President Barkin (non-voter). He said the Fed is trying to bring inflation down on a “sustained basis” and wants to “get to our target for a number of months.” However, until there is a “period of sustained inflation under control,” Barkin said, “I think we are going to just have to continue to move rates into restrictive territory.” He said he’s undecided on what to do in September and will watch the August employment and CPI reports to decide. It appears that the market has adopted a similar stance, with investors also undecided between 50 bps and 75 bps in September, whereas a week ago they strongly favored a 75 bps hike.
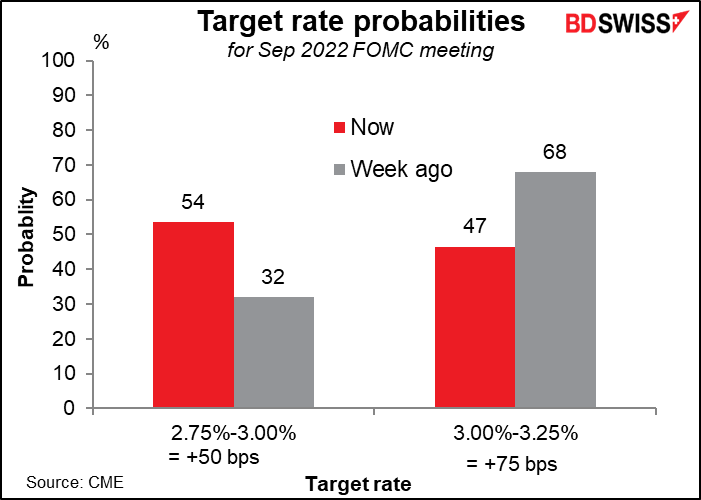
The rise in inflation expectations and hawkish talk from Mr. Barkin helped to support the dollar.
It’s worth noting that most of the rally in the US stock market took place after the U of M survey was released and Mr. Barkin had made his comments, meaning that equity investors are no longer that spooked by the idea of higher interest rates. Perhaps they’re assuming that rates may go up for longer but at a slower pace, which would give the economy time to adjust.
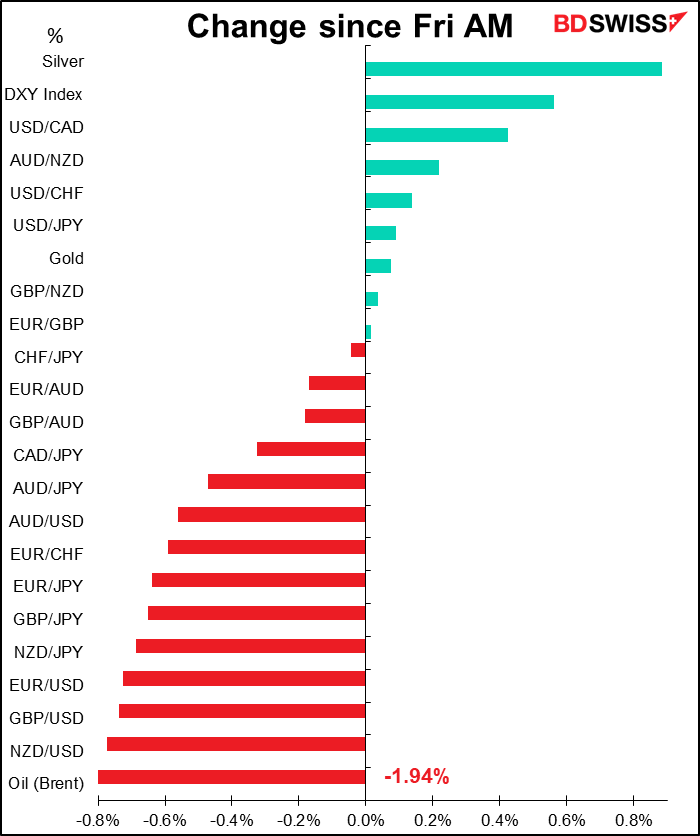
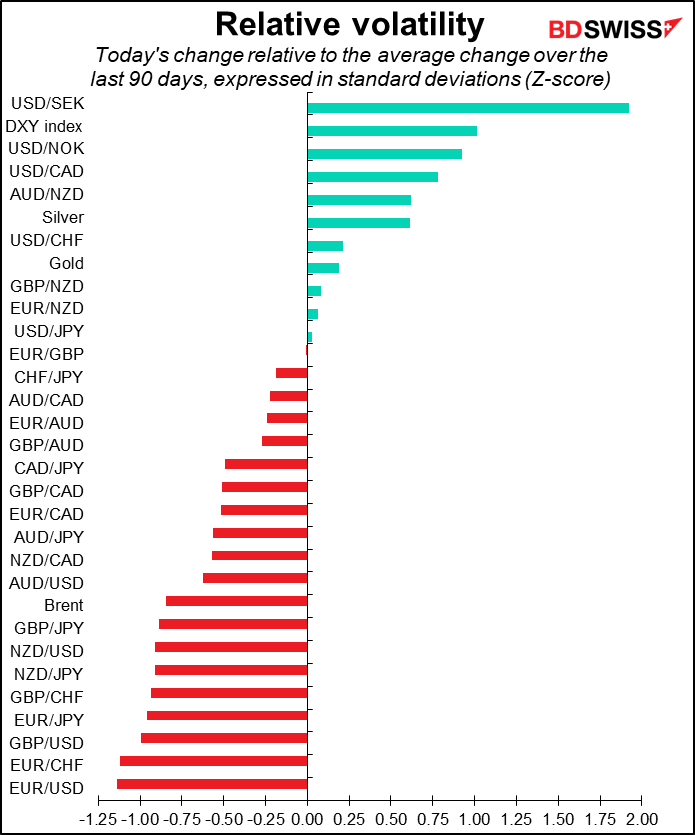
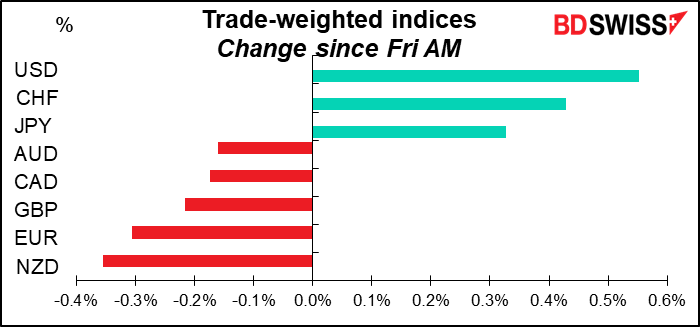
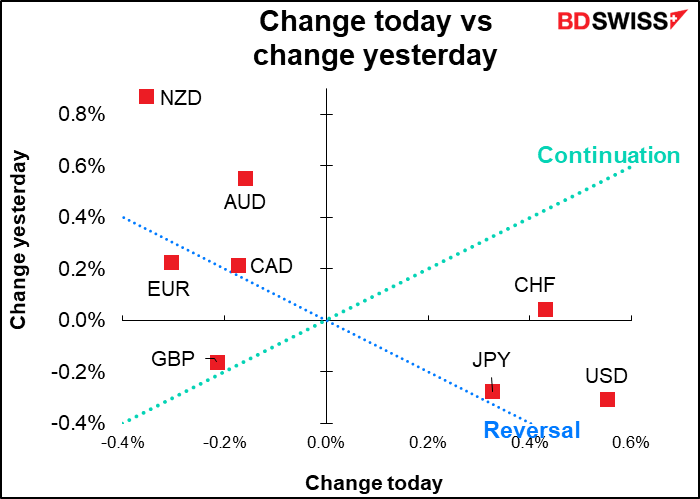
I have to admit I’m somewhat stumped by today’s FX market moves. Why USD, CHF, and JPY, the three safe-haven currencies, are the best performers when the S&P 500 was up 1.7% on the day for the fourth consecutive weekly gain (now up 16.7% from its June 16th low)…I can explain USD but not the other two. EUR/CHF slipped below 0.97, a line that had provided some support.
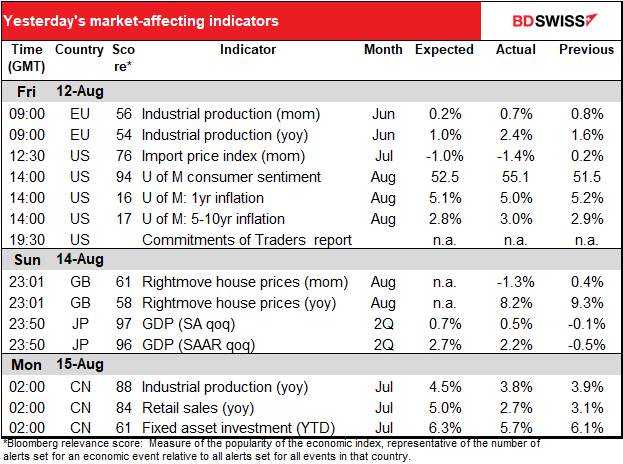
NZD ended last week on a high note – it was the best-performing G10 currency last week – but has come down sharply this morning after some key Chinese data missed expectations (see table above). It’s surprising to me that this would affect NZD more than AUD, because Australia is more exposed to the Chinese economy than New Zealand is and its exports – industrial materials – are more sensitive to economic conditions than New Zealand’s exports, which are mostly food. People don’t have to build a new house but they do have to eat.
In Britain, an Opinium Research poll of 450 Conservative Party voters put Liz Truss in the lead, 61% to Rish Sunak’s 39%. You can argue that polls aren’t accurate but it’s hard to imagine that a poll can be 22 points out of line (although there were a substantial number of people who were still undecided – the poll only covered those who’ve made up their minds).
What’s really amazing to me is that the pollster said they had observed “Johnson nostalgia” among party members: 63% said they’d prefer Johnson remain in charge rather than Truss take over and 68% preferring Johnson over Sunak.
I’ve listened to some of Truss’ speeches and I have to say, I was not particularly impressed. She’s not a particularly great orator. You can watch her famous “Cheese Speech” here.
Commitments of Traders (CoT) report
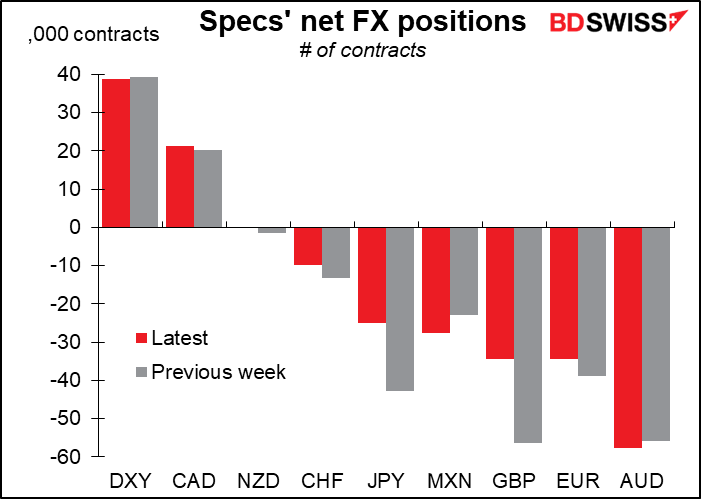
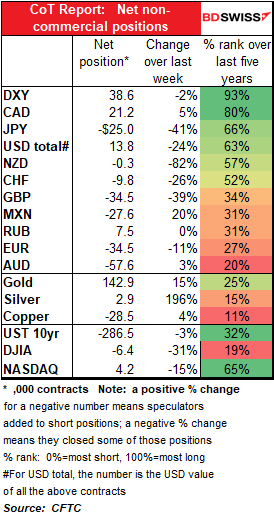
Speculators decreased their long USD holdings in the latest week as investors revised down their expectations for Fed tightening. The move was prescient. The data is as of last Tuesday and on Wednesday the US consumer price index (CPI) came out weaker than expected, which shook the market.
The change was mostly split between JPY and GBP, where in both cases speculators sharply reduced their short positions. They also trimmed their short CHF and EUR positions. Bucking the trend were tiny increases in short MXN and AUD.
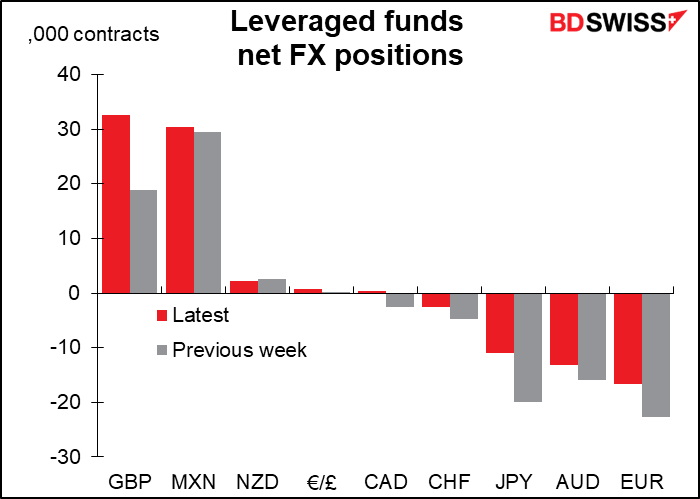
Hedge funds sharply increased their long GBP positions. Odd! I can’t see what they find attractive about the currency, especially three business days after the Bank of England forecast a five-quarter recession. But perhaps it was the Bank’s determination to raise rates nonetheless that attracted them.
They also trimmed their JPY and EUR shorts.
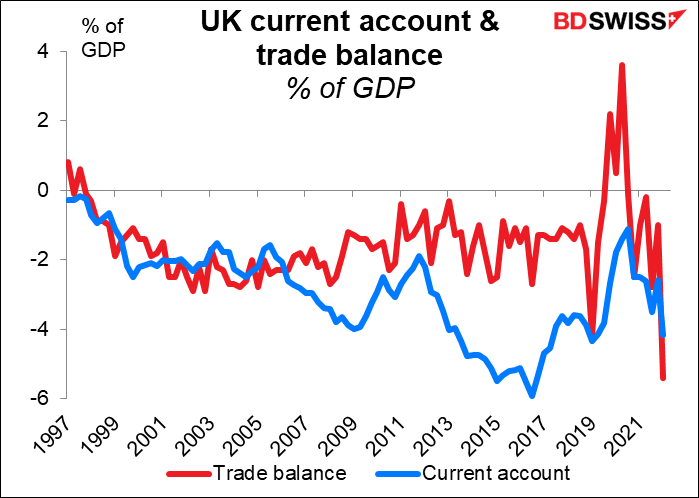
But with the country’s trade deficit blowing out, I doubt whether this strength can last.
Retail traders trimmed their long EUR and CAD positions but added to their short JPY and GBP positions.

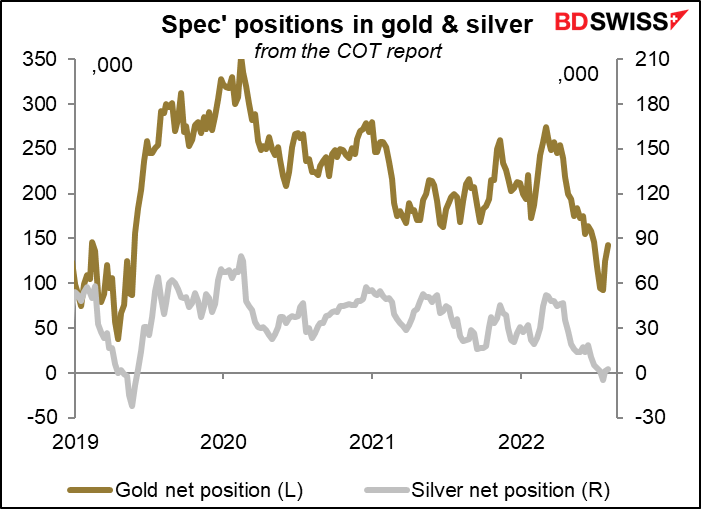
Precious metals pulled back from the brink. Gold longs rose as did silver, which just two weeks ago was a net short.
More on TFG (The Former Guy)
What’s happening in the US is astonishing. Finally, events are catching up with He Who Must Not Be Named.
Now that it’s been discovered that Trump was hiding nuclear secrets in his basement, the question arises, why? Why did someone with around $400mn in bank loans coming due in the not-too-distant future have the highest-level US secrets in his possession and refuse to give them back?
In case you’re wondering, here’s what they’re saying on Russian TV: “Obviously if there were any important documents, they’ve been studying them in Moscow for a while.”
https://twitter.com/JuliaDavisNews/status/1558289365004128264?s=20&t=yRlEK8dlZL8C9ymrWGJr5g
And did this explain as well why his son-in-law was able to raise $2bn from Saudi Arabia for his private equity fund even though the panel that performs due diligence for the Saudi fund concluded that the firm’s operations were “unsatisfactory in all aspects”?
But…but…Hunter Biden’s laptop! Hillary’s emails! Lock her up!
Today’s market
Note: The table above is updated before publication with the latest consensus forecasts. However, the text & charts are prepared ahead of time. Therefore there can be discrepancies between the forecasts given in the table above and in the text & charts.
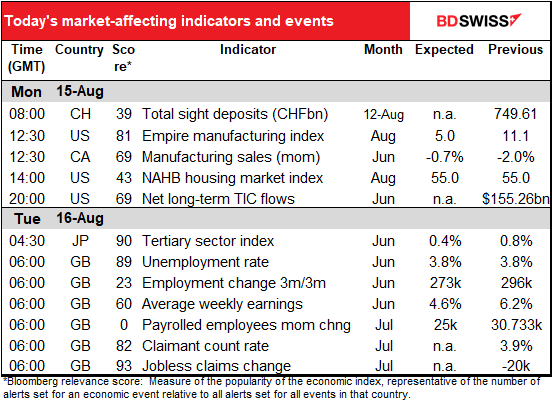
As usual, the week begins with the Swiss sight deposits. It looks like the Swiss National Bank is starting to get concerned about the strengthening CHF because they appear to have intervened rather heavily in the week to Aug. 5th – the most since May 6th. Nonetheless it doesn’t seem to have done much to prevent further appreciation. Perhaps it’s just a smoothing operation.
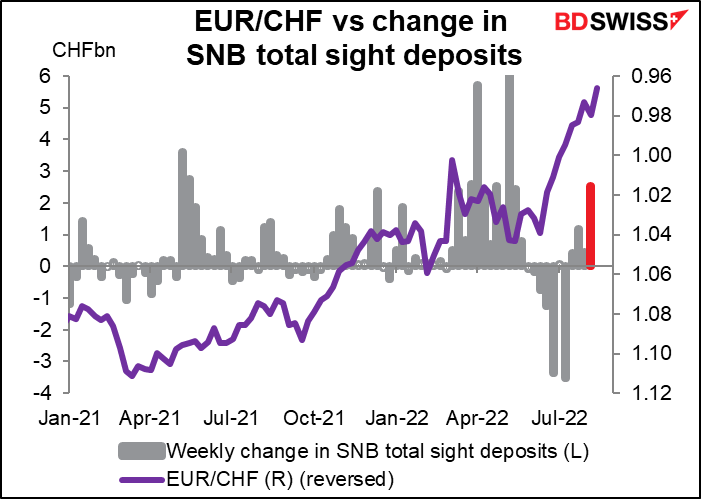
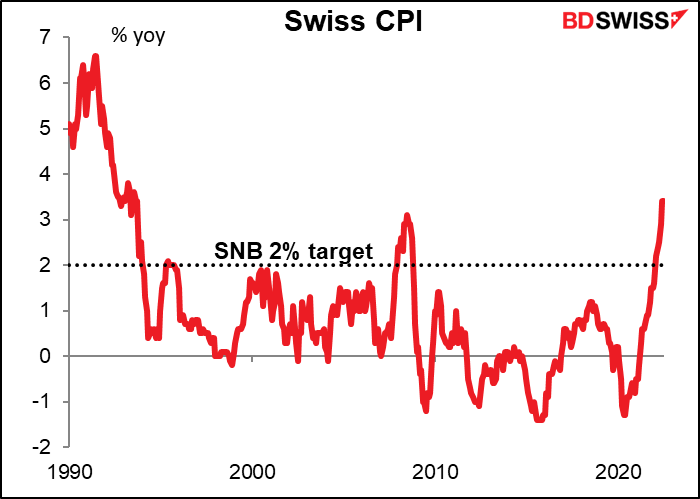
As inflation hit 3.4% in July – the highest since 1993 – maybe they’re hoping currency appreciation will serve better than raising interest rates to dampen inflation.
That’s it for Europe. When the US day starts, we get the Empire State manufacturing survey. (The Empire State is New York state, as in the Empire State Building, which was the tallest building in the world until 1970 and is perhaps most famous as the building that King Kong climbed in the original 1933 movie).

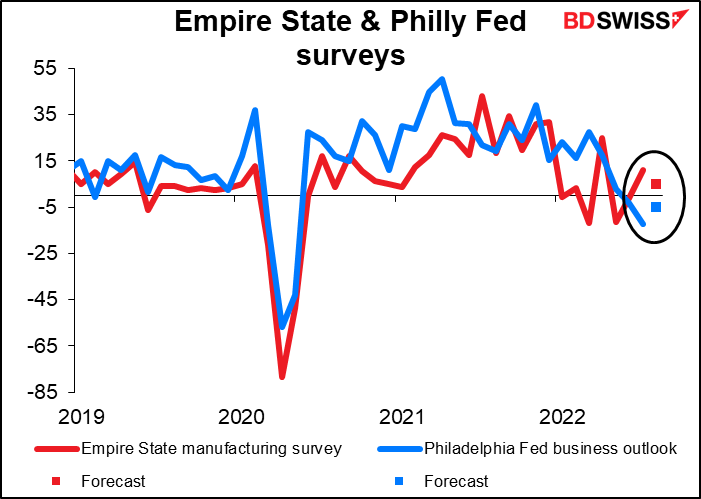
The Empire State manufacturing index always comes out two days before the Philadelphia Fed business sentiment survey and the forecasts for the two are usually connected. Economists largely expect mean reversion: that is, they forecast that the two indices will move closer to each other. So in this case the Empire State index, the higher of the two, is forecast to fall while the Philly Fed index, the lower one, is forecast to rise. It’s as good a guess as any since as you can see the two do tend to move together.
The key point is whether the index remains positive and therefore in expansionary territory. Everyone is worried that the US economy may be slowing or even fall into recession. I think the markets can tolerate a move lower as is forecast, but if the index slips into negative territory that would be a bad signal for USD.
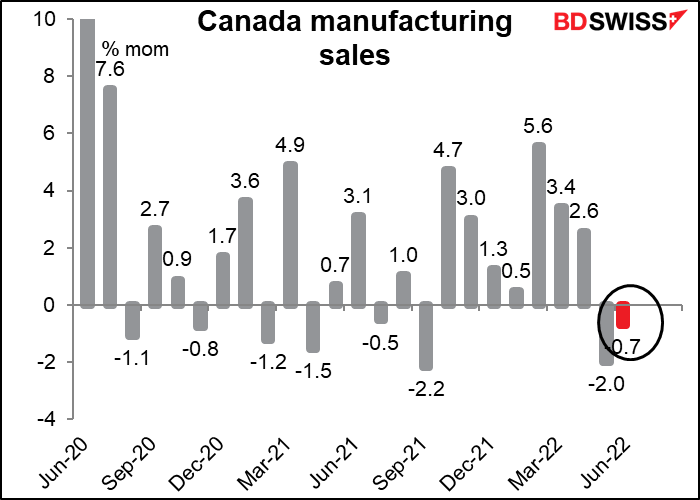
I have to admit, I don’t have much to say about Canada manufacturing sales, which in any event don’t seem to be a blockbuster indicator anyway. They’re expected to fall, based on data on factory goods exports.
The US National Association of Home Builders (NAHB) market index is expected to be unchanged following last month’s sharp drop (to 55 from 67). Given the fact that mortgage rates have nearly doubled over the last year, the decline isn’t surprising.
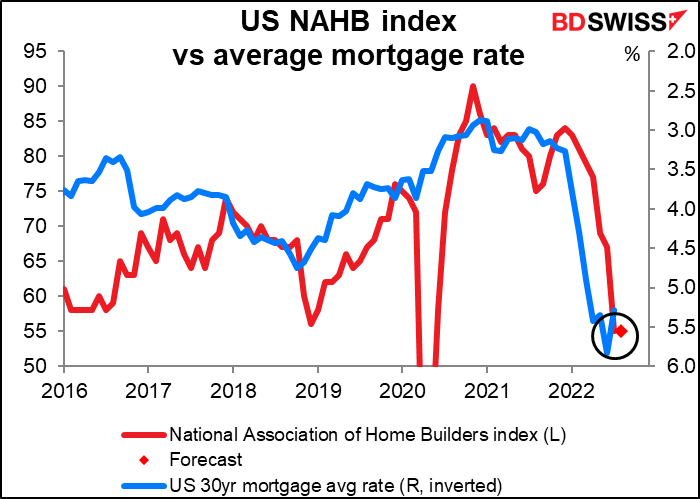
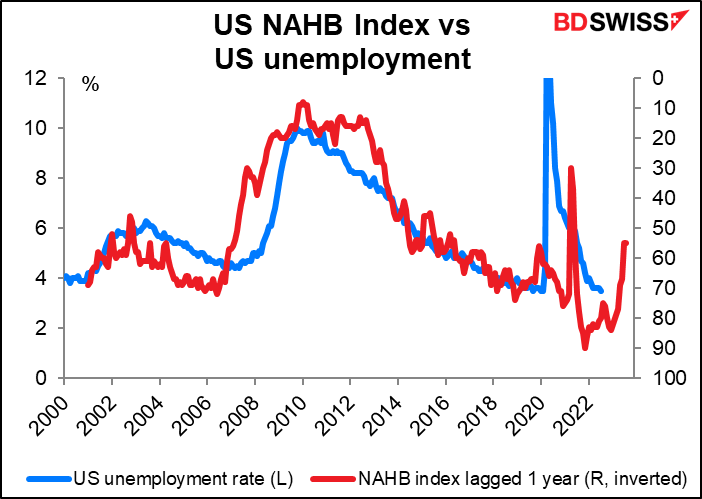
While this index isn’t particularly market-moving, it is closely watched by economists. The housing market drives a lot of the US economy, both directly (through construction) and indirectly (buying a new refrigerator and carpets when moving into a new house, for example). The NAHB index has therefore been a fairly reliable indicator of the US business cycle a year ahead – not such great news right now as it would suggest the unemployment rate rising up to around 6% from the current 3.5% over the next year.
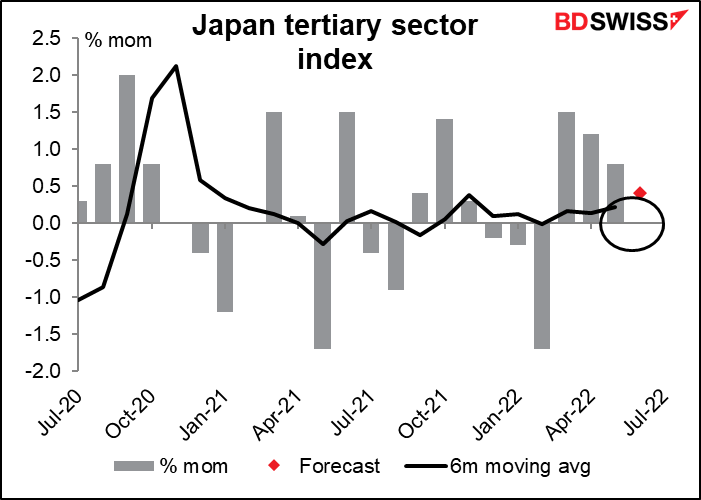
Overnight Japan releases its tertiary sector index, the tertiary sector being the service sector (primary sector = agriculture and mining, secondary sector = manufacturing). It’s expected to show the fourth month-on-month increase in a row. This would agree with the service-sector purchasing managers’ index, which has been in expansionary territory since April.
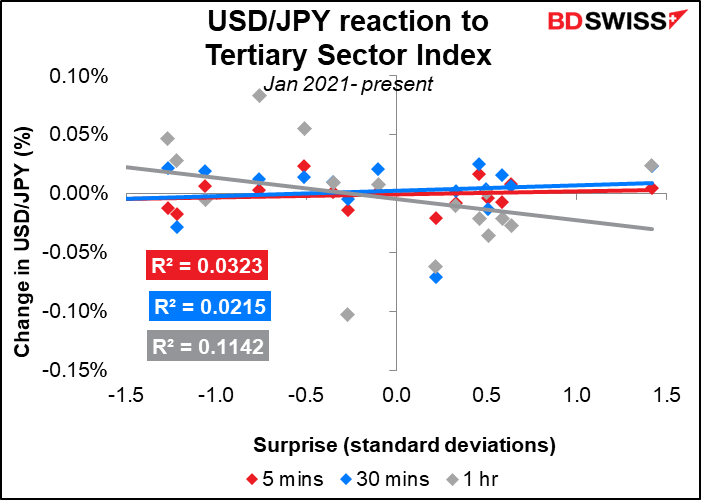
The index doesn’t seem to have much immediate impact on USD/JPY but does have some small impact after an hour consistent with what one might expect: a better-than-expected index tends to go along with a fall in USD/JPY (a stronger JPY).
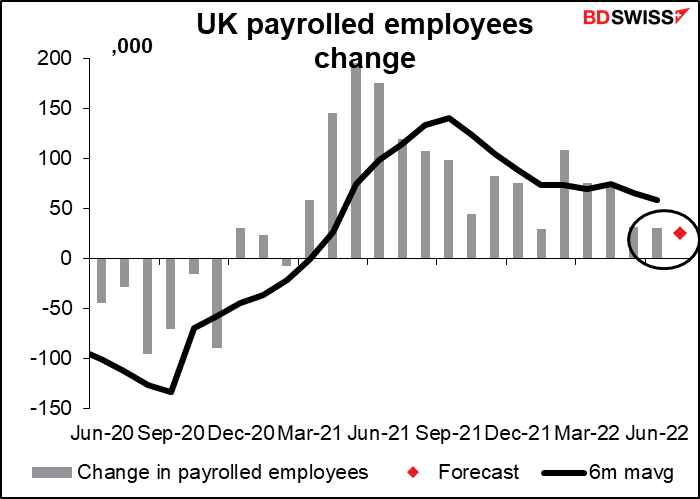
Then early Tuesday morning, Britain releases its employment data. The most important of these figures is the change in payrolled employees, a relatively new series that’s the equivalent of the US nonfarm payrolls. It’s not only available a month earlier than the other data (it’s for July, whereas the unemployment rate is for June) but also more accurate. It’s forecast to show another increase in employment, albeit slightly smaller than in the previous month – not a bad figure.
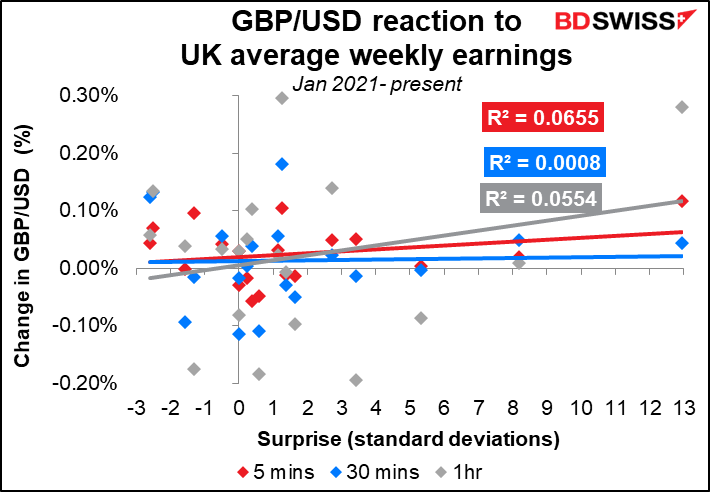
The second-most important figures will no doubt be the average earnings data. That’s what really concerns the Bank of England: that higher wages will force companies to raise their prices, which in turn will result in workers demanding higher wages – the typical wage/price spiral of inflation. In this case, earnings including bonuses are expected to be down sharply, presumably reflecting a drop in bonuses, but earnings excluding bonuses – a more reliable indicator of wage pressures – are forecast to rise slightly. This ought to worry the Bank of England and therefore could be positive for GBP.
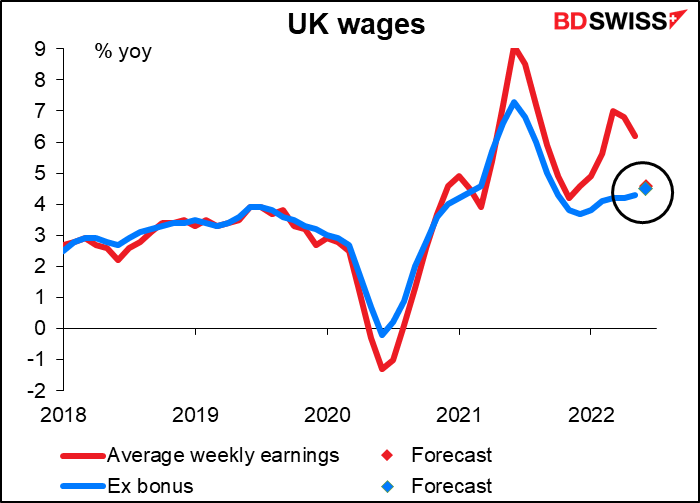
Meanwhile, the unemployment rate is expected to be unchanged at 3.8%, not far off the 50-year low of 3.7% set in March. (The record low was 3.4% set in December 1973). And the number of employed persons is forecast to rise further. All in all, the data should confirm the Bank of England’s discovery that “Firms generally report that they expect to increase their selling prices markedly, reflecting the sharp rises in their costs,” labor being a major one. This combination is likely to be positive for GBP.

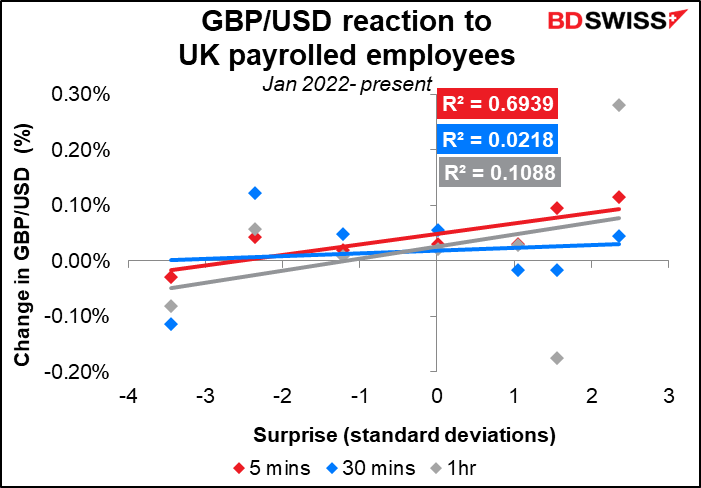
There isn’t much of a history of surprises for the payrolled employees, which only started to be announced this year, but it definitely seems that GBP/USD takes its lead from this number. The correlation is much better than with any of the other data released at the same time, at least for the first five minutes.
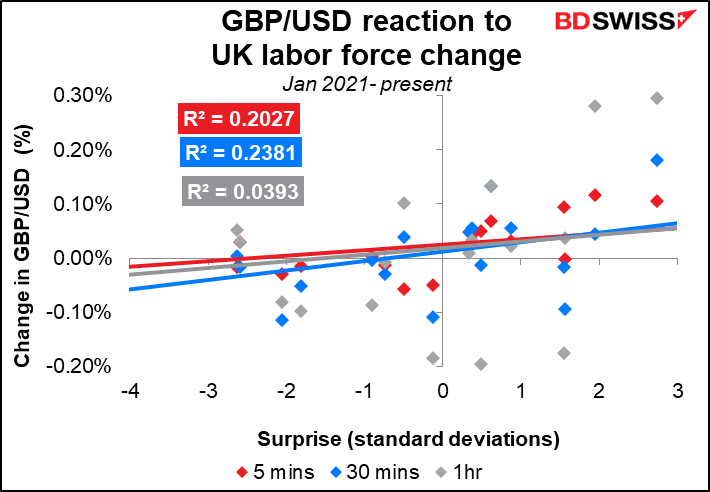
After that, the labor force change seems to be the most closely correlated with subsequent movements in the currency.
Average earnings, not so much, much to my surprise.
