Rates as of 06:00 GMT
Market Recap
So much going on!
Two big items:
-
- The US government Friday said it expects Russia to invade Ukraine this week, maybe as early as Wednesday.
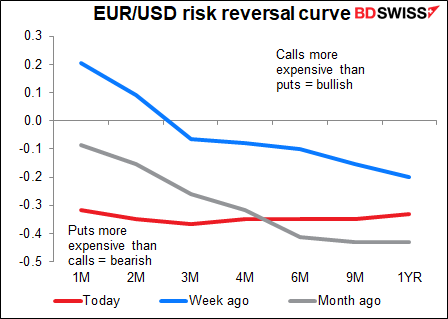
The FX market is showing little concern over this, however. While the one-month EUR/USD risk reversal has moved into negative territory, showing that now people want downside protection, there’s little difference between their one-month view and one-year view. If they were worried about the war then the one- and two-month RRs would be significantly lower than the long-term ones.
Perhaps the market is equally concerned about European Central Bank President Lagarde’s comments on Friday that “if we acted too hastily now, the recovery of our economies could be considerably weaker and jobs would be jeopardised.”
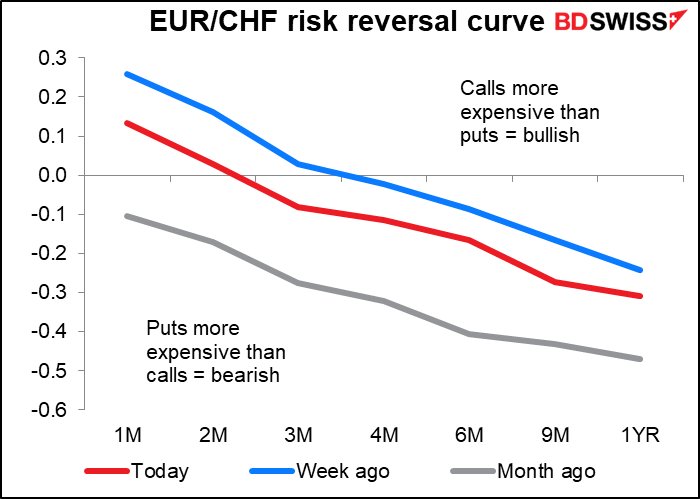
In fact people believe there’s a risk of EUR/CHF appreciating in the next few months. This wasn’t what they thought a month ago. This is the opposite of what they’d be doing if they were really worried about war in Europe.
Maybe this is because last time around, when Russia took over Crimea in 2014, EUR/USD initially moved down as the protests started in Ukraine but the actual invasion didn’t phase the currency at all. EUR/CHF moved down a bit ahead of the invasion but didn’t show much response to it.
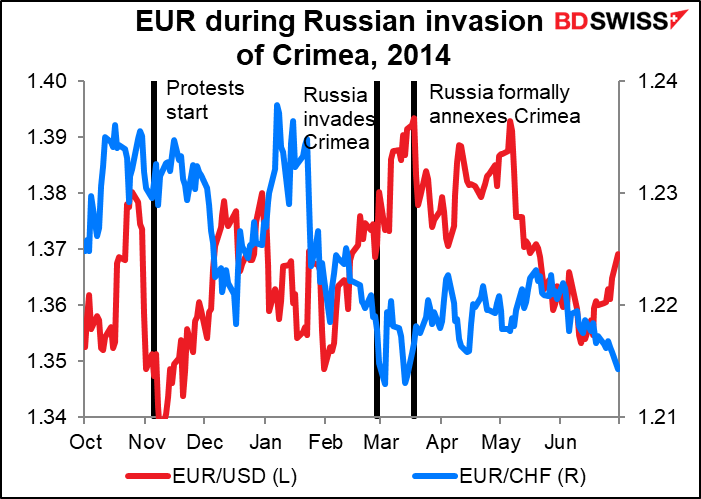
The risk reversals showed no reaction at all then.
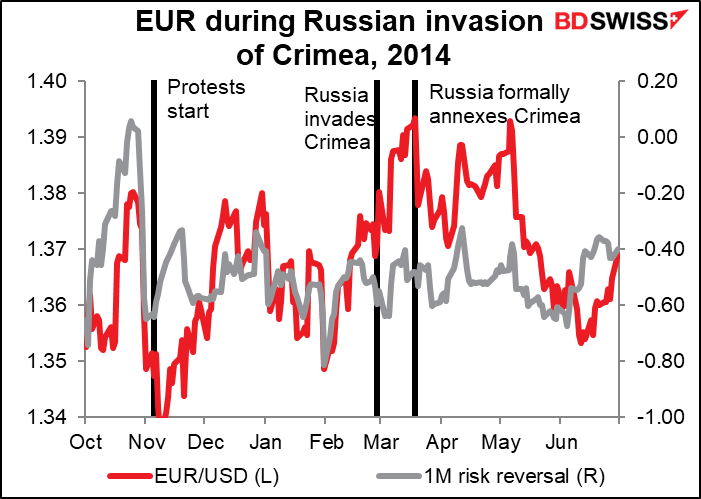
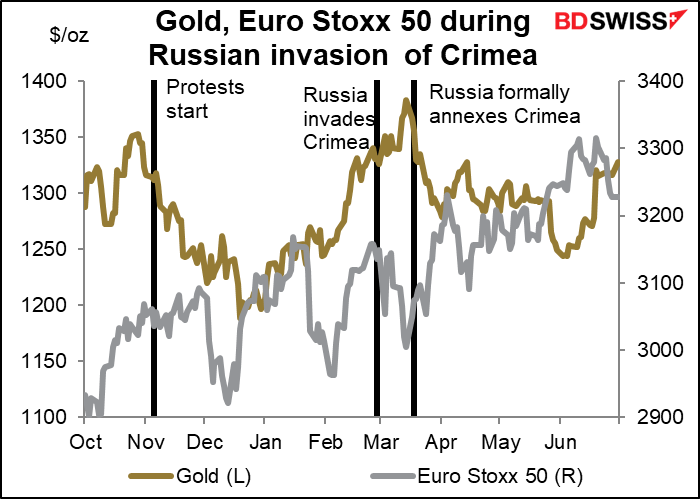
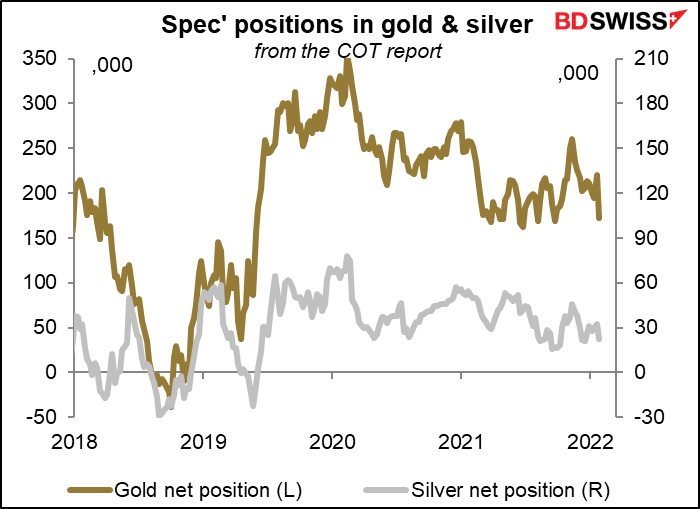
Gold by the way did well leading up to the invasion but fell a bit afterwards, perhaps in a “buy the rumor, sell the fact” reaction. European stocks barely noticed the event.
I’m not sure how comparable the two events are. The Russian invasion of Crimea was limited in scope and didn’t involve anyone outside the country. This time NATO may well get involved, which could give rise to a much bigger conflagration. We did see a big move in gold and silver on Friday.
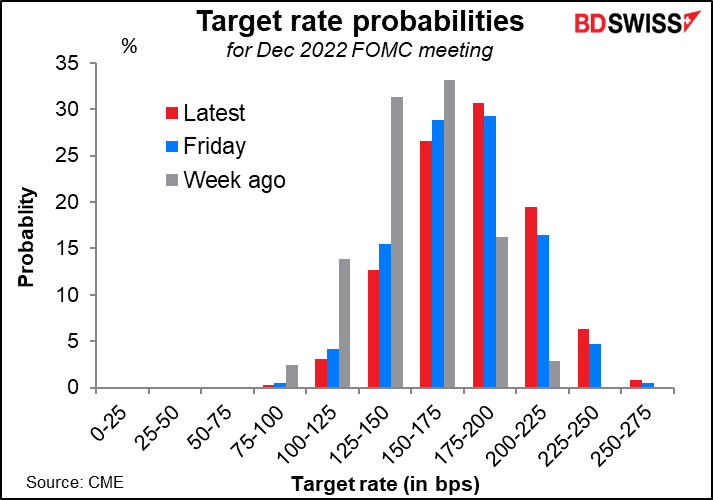
The fear of fighting sent US interest rates down on Friday and caused rate hike expectations to recede somewhat.
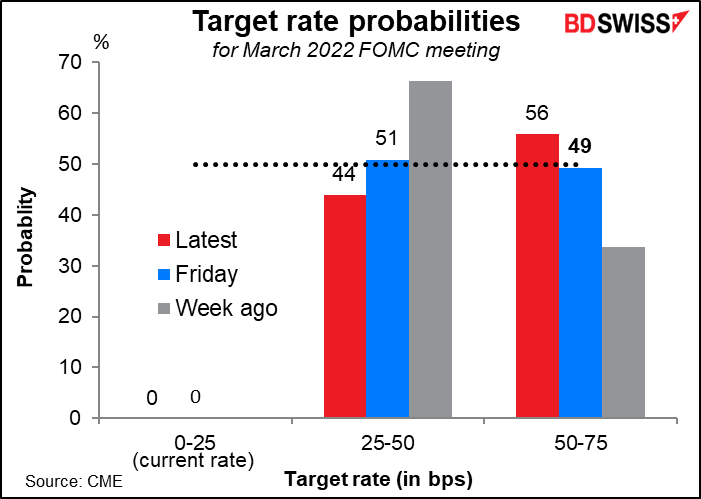
The market has been vacillated between expecting a 25 bps hike in March and a 50 bps hike. At one point on Thursday, after the US CPI came out higher than expected, the odds of a 50 bps hike were around 93%. By the close of business in the US on Friday it was pretty much even (49% to 51%) But by Sunday, when thoughts of war were dominating, they had shrunk to 41% as the market thought a 25 bps hike was more likely. Now however the market is back to thinking the odds that the Fed goes 50 bps are slightly higher than 25 bp – perhaps pricing in the possibility of a between-meeting hike (see below).
Similarly the market now sees seven rate hikes this year as most likely. Friday it saw the odds of six about the same as seven. So somewhat more convinced of more tightening. Much more than a week ago, when the odds favored five or six rate hikes.
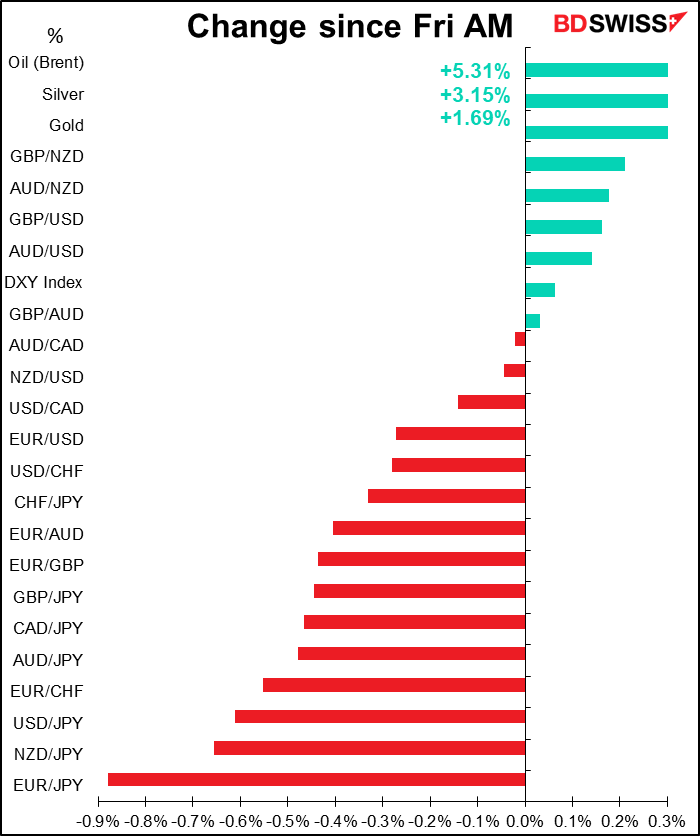
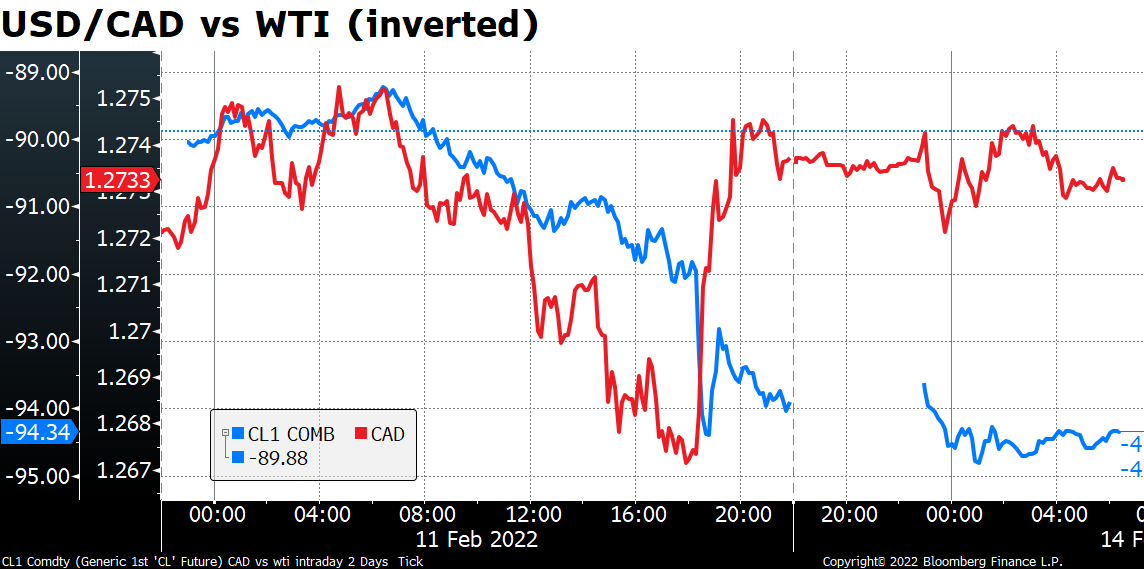
Stock markets generally fell on the news as risk aversion took hold. That sent the commodity currencies down. It was noticeable how CAD went along with the general mood even though oil soared some 5.3%. I would expect CAD to bounce back faster than the other commodity currencies owing to the impact of any disruption to energy supplies.
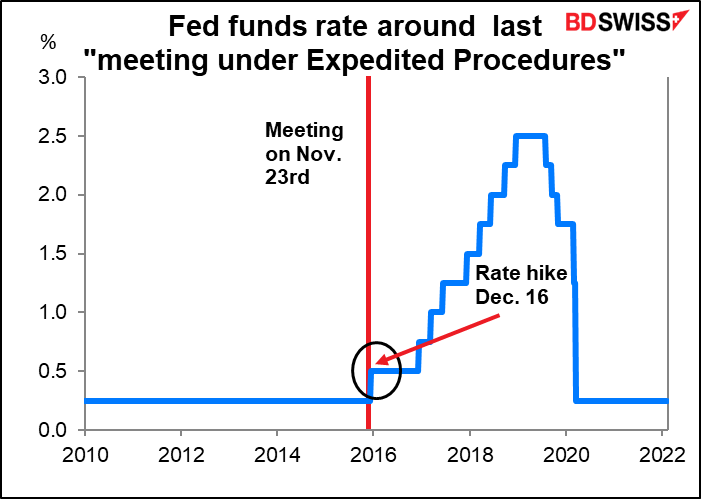
- The Fed has called an unscheduled closed meeting for today. The meeting, to be held “under expedited procedures,” is to consider “Review and determination by the Board of Governors of the advance and discount rates to be charged by the Federal Reserve Banks.”
The last time such a meeting was held under those procedures to discuss those matters was on Nov. 23, 2015. Two weeks later, on Dec. 16th, they hiked rates for the first time since 2008.
We don’t know what the implications of this move are, but St. Louis Fed President Bullard, an FOMC voter, recently called for an inter-meeting meeting to discuss a rate hike.
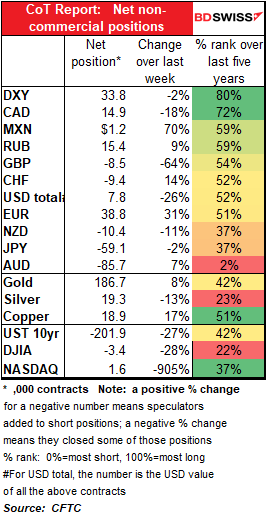
Commitments of Traders report
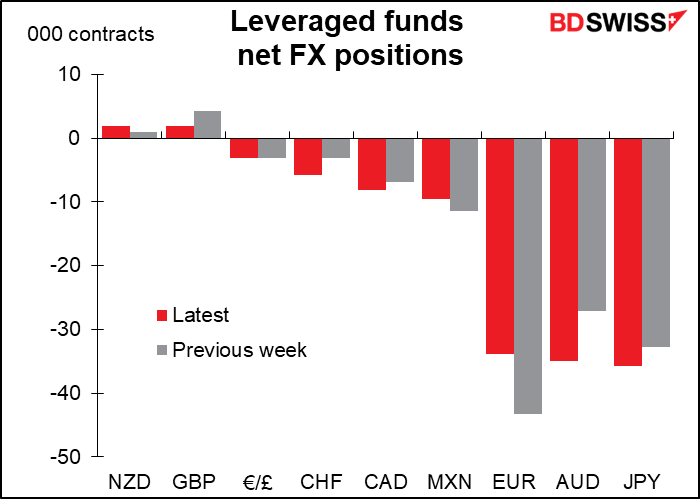
Speculators reduced their long USD position in the latest week to the lowest level since August, a big mistake ahead of the higher-than-expected CPI number Thursday that sent the dollar rocketing. Most of it came from an increase in EUR longs and a reduction in GBP shorts, in both cases no doubt a response to the relatively hawkish results of those two currencies’ central bank meetings the previous week. On the other hand they trimmed their CAD longs and increased their AUD shorts, which remain the favored short within the G10.
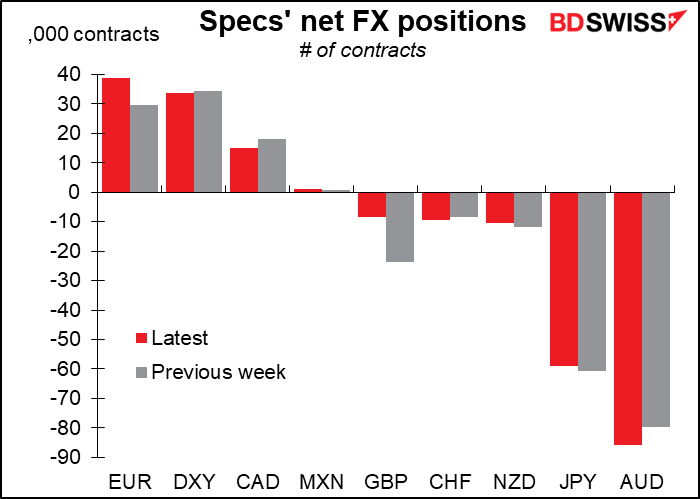
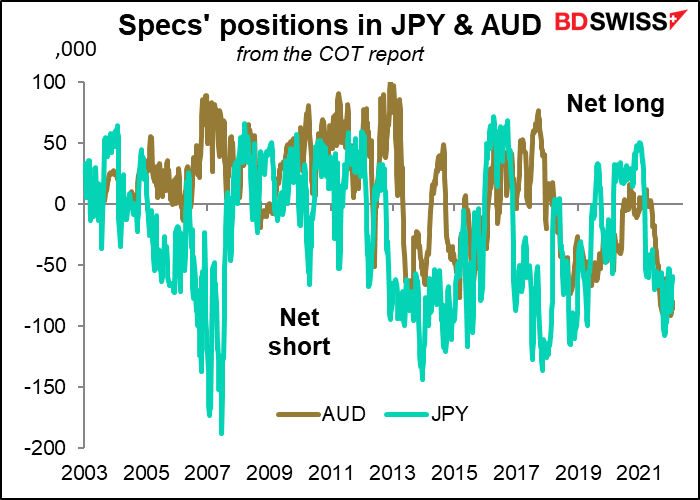
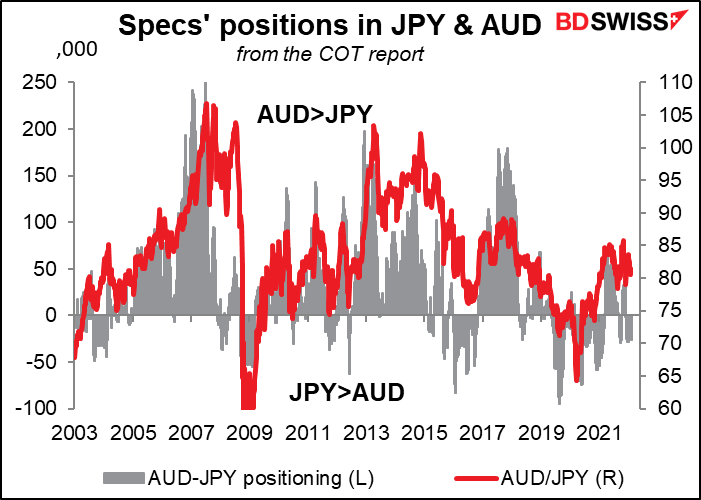
Historically, AUD/JPY has tended to fall when AUD shorts were bigger than JPY shorts (“bigger than” referring to the absolute value).
Hedge funds increased their GBP longs while trimming their EUR shorts, again a likely reaction to the central bank meetings. They increased their AUD and CHF shorts however.
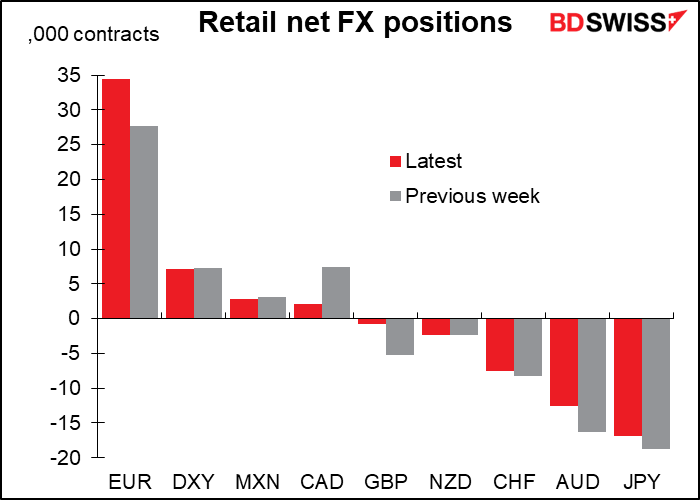
Retail too increased EUR longs and trimmed GBP shorts. They also trimmed AUD shorts while cutting CAD longs.
Speculators increased their long positions in gold but trimmed their silver longs.
Today’s market
Note: The table above is updated before publication with the latest consensus forecasts. However, the text & charts are prepared ahead of time. Therefore there can be discrepancies between the forecasts given in the table above and in the text & charts.
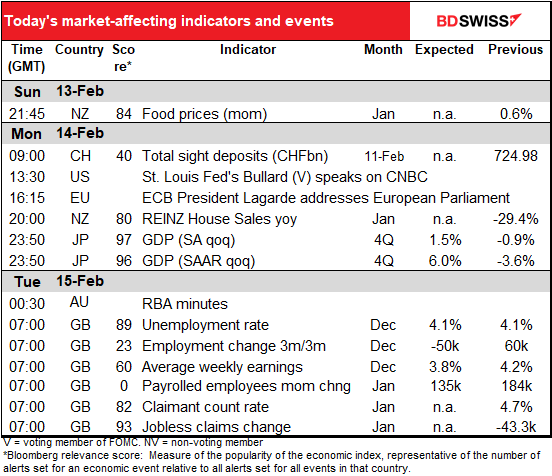
We have a busy week ahead of us but today isn’t one of the busy days.
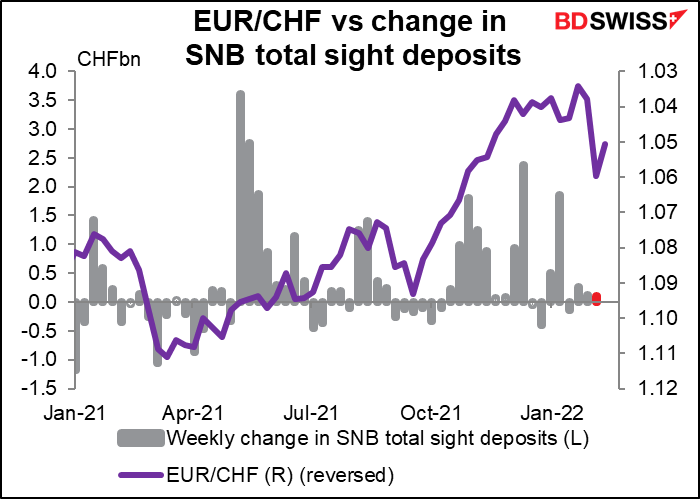
Swiss sight deposits have been quite boring recently. Over the last four weeks the average weekly increase has been CHF 86mn. That’s nothing. EUR/CHF came down from 1.060 to 1.051 over the latest week, but I doubt if that precipitated a flurry of intervention.
ECB President Lagarde will address the European Parliament, first on the 20th anniversary of euro banknotes and coins and then she’ll give an introductory statement on the ECB’s annual report for 2020. Hmm…a little out of date?
Then that’s about all the excitement we have to look forward to during the European and US days.
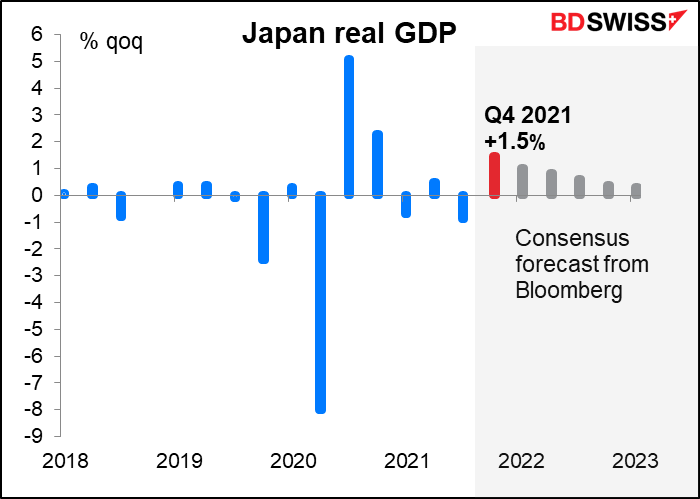
Once Asia wakes up, Japan releases its Q4 GDP data. The market expects a healthy rebound after the pandemic-induced decline in Q3. Services consumption improved markedly, as shown by improvement in the mobility data once the state of emergency declaration was lifted. Also auto exports picked up in November, which should allow net exports to contribute to growth.
However last week’s collapse in the Eco Watcher’s Survey for January suggests that things haven’t been so great since then as higher food & energy prices and the re-imposition of some emergency measures in January weighed on activity. That outlook is reflected in forecasts for future quarters, which show growth tailing off over the rest of the year and into 2023. Japan is expected to recover to pre-pandemic levels of output in Q1 this year however.
The minutes of the February Reserve Bank of Australia (RBA) meeting probably won’t add that much to our understanding of their nearly incomprehensible decision. We’ve already had plenty of explanation: there was the usual post-meeting statement, a speech by RBA Gov. Lowe, the February Statement on Monetary Policy, and Gov. Lowe testified to Parliament. Maybe the minutes will clear up a few points about their decision to end their bond purchases and there could be some hints about what they plan to do as those purchases mature, but that’s about it. In any case they’ve promised they’ll decide what to do about maturing bonds in May.
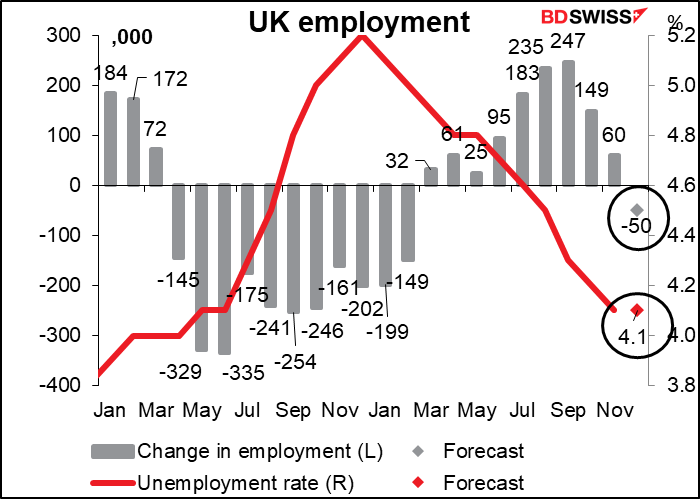
Then we can go back to sleep until Britain wakes up and releases its employment data.
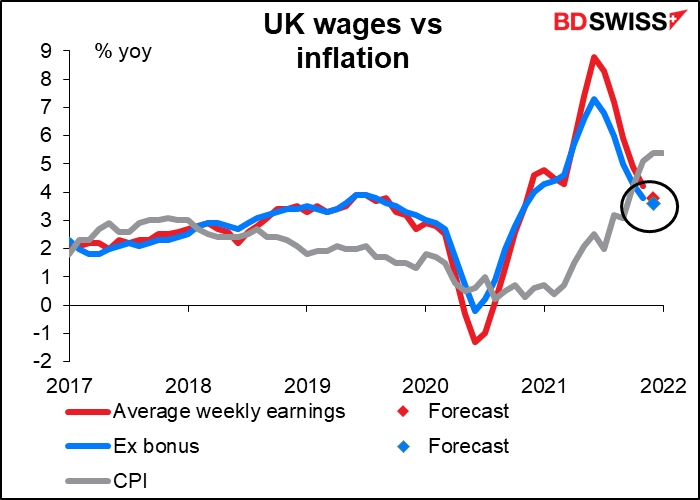
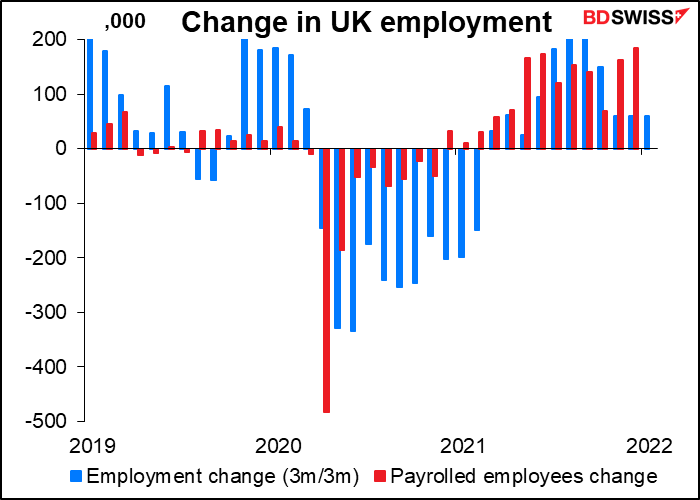
You’ll notice in the data listed in the table above a series you might not be familiar with: payrolled employees month-on-month change. This is “experimental monthly estimates of payrolled employees and their pay from HM Revenue and Customs’ (HMRC’s) Pay As You Earn (PAYE) Real Time Information (RTI) data,” according to the Office of National Statistics (ONS) website. Employers are required to deduct income tax and National Insurance Contributions from their employees’ wages and pay this to HMRC every month.
If you’re interested in the details of the figures, such as how they’re assembled, regularized, and how they compare with other series, the ONS has an extensive article on the subject. Take it from me, who did look at it, you’re not that interested. All you need to know is the first sentence: “As Pay As You Earn (PAYE RTI) data cover the whole employee population (for those paid through PAYE), rather than a sample, they can be used to produce more precise and detailed statistics on pay and employment than the current survey-based statistics.”
In other words, this is the British equivalent of the US nonfarm payrolls and therefore should gradually become the most closely watched part of the monthly UK employment data. It has the advantage of not only being more accurate but also being available earlier than the other data. Note that today’s figure is for January, whereas the unemployment rate and the employment change figures are for December.
The claimant count rate and jobless claims numbers, which are also a month ahead of the unemployment and employment change figures, used to be the most closely watched parts of this announcement. However no one forecasts them anymore as the ONS stopped including them in its main statistical bulletin on the labor market from March 2017, because, it said, the series “may now be providing a misleading representation of the U.K. labor market.”
Despite how wonderful this new series is, it wins the award as The Indicator with the Lowest Bloomberg Relevance Score Ever (zero). That’s probably because it’s so new. Bloomberg only started reporting it last month. The Office of National Statistics (ONS) only started releasing the data on an experimental basis in December 2019.
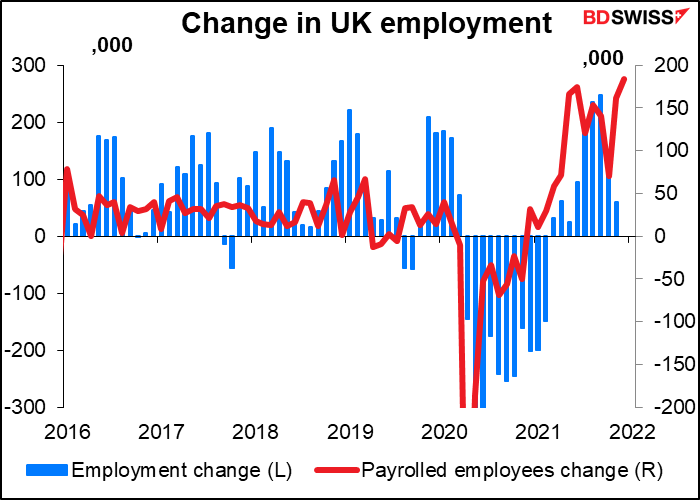
How do the two series compare? Although they’ve moved in the same direction 73 out of 88 times or 83%, as you can see there’s a lot of difference in the size of the change. That may be because as far as I can tell, the employment change is the change in the average number of employees for the latest three months compared with the average in the preceding three-month period whereas the payrolled employees change is the change vs the previous month. So for example the December figure for the employment change would be the average number of employees in October, November, and December compared to the average number of employees in July, August, and September. A three-month change is bound to be bigger than a one-month change and since it’s a three-month moving average it’s also bound to change more slowly.
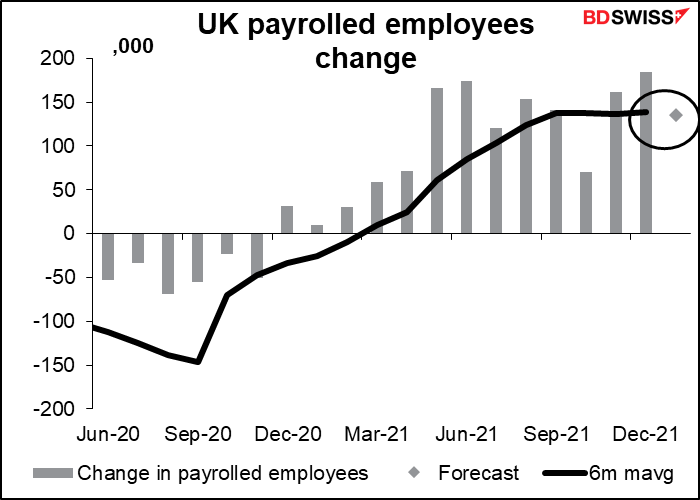
What’s expected for January? The market is looking for an increase largely in line with the six-month moving average. (135k vs 138.3k). That may well be how people are forecasting it.
This compares with an expected drop in total employment of 50k for December. It will be interesting to see which the market puts more emphasis on. Also, the unemployment rate is expected to be unchanged at 4.1%.
Growth in average wages is expected to slow, in any case to remain under the rate of inflation. That should delight the gnomes of the Bank of England, who live in fear and dread that someone, somewhere might see their standard of living rise. BoE Gov. Bailey said after the recent BoE meeting, “In the sense of saying, we do need to see a moderation of wage rises, now that’s painful. But we need to see that in order to get through this problem (inflation) more quickly.” Note that he said this the day after the Bank forecast the biggest drop in UK living standards in the 31 years we have data for. Alas Gov. Bailey, who makes GBP 575,538 a year, didn’t say what he was going to to do in his personal life to help defeat inflation.