Previous Trading Day’s Events (02.08.2024)
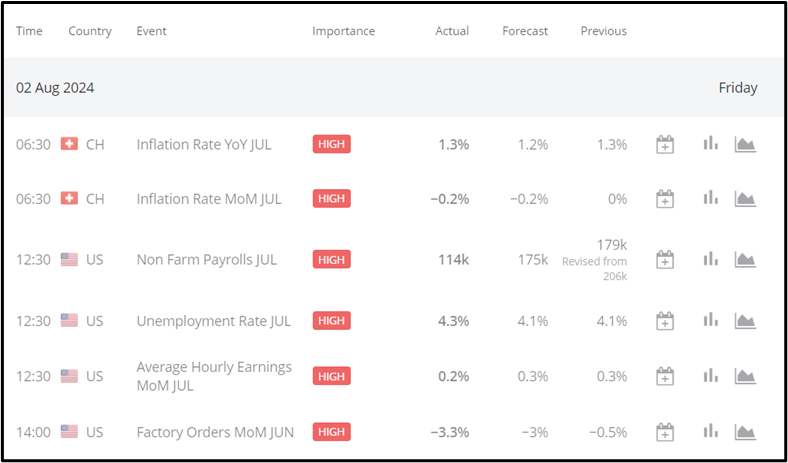
Switzerland Inflation Rate MoM: Consumer prices fell 0.2% in July 2024, meeting market expectations, after being flat the previous month.
US Average Hourly Earnings MoM: Increased by 0.2% to $35.07 in July 2024, up 8 cents, but below the expected 0.3% gain.
US Non-Farm Payrolls: Added 114K jobs in July 2024, missing forecasts of 175K and down from 179K in June.
US Unemployment Rate: Rose to 4.3% in July 2024, up from 4.1%, surpassing expectations and marking the highest rate since October 2021.
Exxon Mobil Corp: Reported EPS of $2.14, beating the forecast of $2.03, and revenue of $93.06 billion, exceeding the expected $90.46 billion.
Winners Vs. Losers

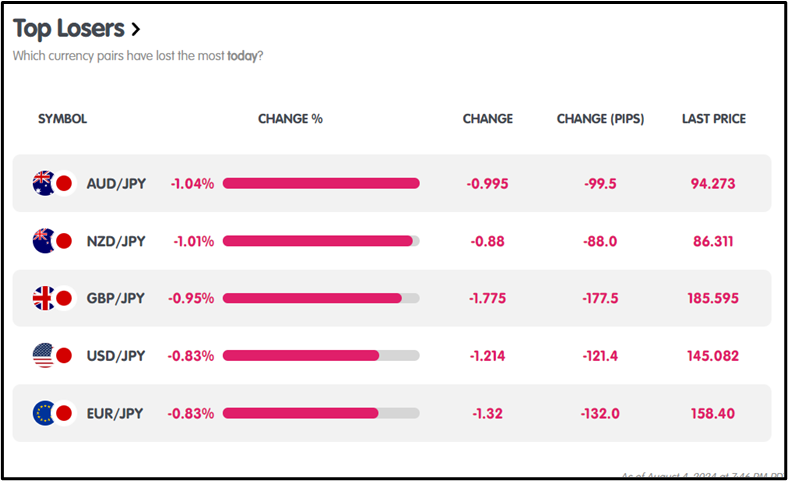 On August 2, 2024, the top performer was EUR/AUD, gaining +0.21% with a rise of +35.8 pips. Conversely, the biggest loser was AUD/JPY, dropping -1.04% with a decline of -99.5 pips.
News Reports Monitor – Previous Trading Day (02.08.2024)
Server Time / Timezone EEST (UTC+03:00)
 Tokyo Session: No news
London Session
New York Session:
General Verdict:
FOREX MARKETS MONITOR
EURUSD (02.08.2024) 15m Chart Summary
Server Time / Timezone EEST (UTC+03:00)
Price Movements
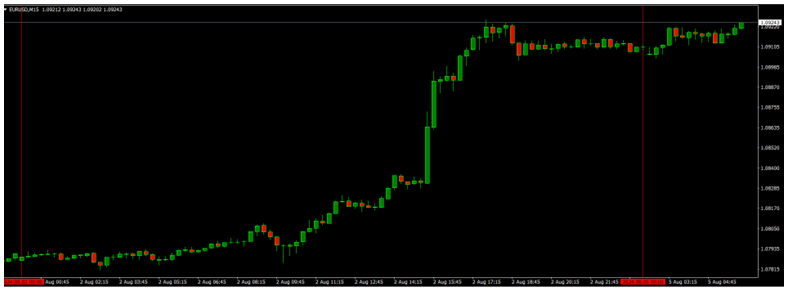
EUR/USD displayed a bullish trend, opening at 1.07871 and closing at 1.09103. It reached a high of 1.09263 and a low of 1.07802.
 CRYPTO MARKETS MONITOR
BTCUSD (02.08.2024) 15m Chart Summary
Server Time / Timezone EEST (UTC+03:00)
Price Movements
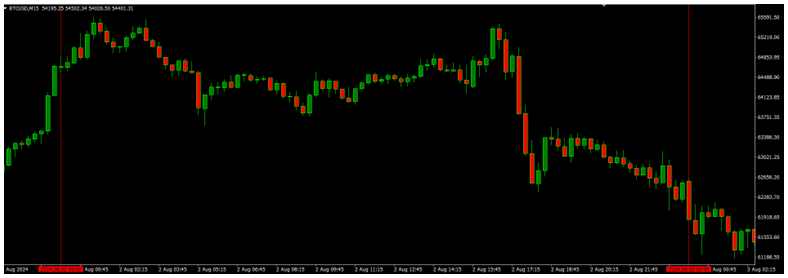
BTC/USD showed a bearish trend. It opened at $64,732.73, closed at $62,558.29, peaked at $65,566.76, and hit a low of $62,051.91.
 Stocks MARKETS MONITOR
Exxon Mobil Corp ( NYSE: XOM ) (02.08.2024) 15m Chart Summary
Server Time / Timezone EEST (UTC+03:00)
Price Movements
Exxon Mobil displayed a bullish trend, opening at $116.36, closing at $117.06, reaching a high of $118.83, and a low of $115.36.
 Equity MARKETS MONITOR
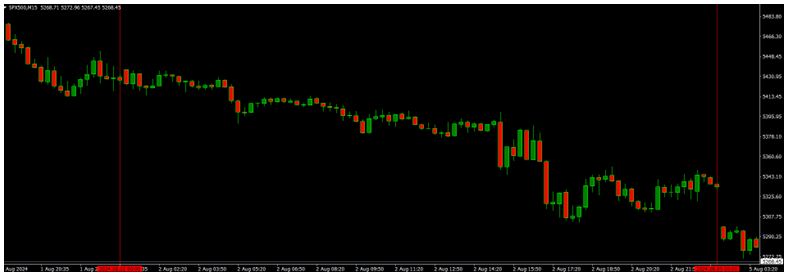
S&P 500 (02.08.2024) 15m Chart Summary
Server Time / Timezone EEST (UTC+03:00)
Price Movements
The S&P 500 was bearish, opening at $5,437.44, and closing at $5,334.26, with a high of $5,437.44 and a low of $5,302.24.
 COMMODITIES MARKETS MONITOR
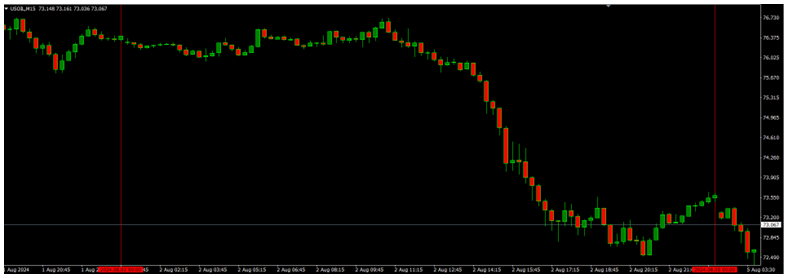
USOIL (02.08.2024) 15m Chart Summary
Server Time / Timezone EEST (UTC+03:00)
Price Movements
USOIL exhibited a bearish trend, opening at $76.34, and closing at $73.60, with a high of $76.79 and a low of $72.53.
 News Reports Monitor – Today Trading Day (05.08.2024)

- Tokyo Session: No relevant data.
- London Session: No relevant data.
- New York Session: United States ISM Services PMI forecasted at 51.4, release at 14:00 GMT.
General Verdict:
Source:
https://www.investing.com/equities/exxon-mobil-earnings
Metatrader 4 (MT4)


