PREVIOUS TRADING DAY EVENTS – 28 March 2023
Announcements:
Source: https://www.bloomberg.com/news/articles/2023-03-28/boe-governor-says-global-markets-are-testing-banks-for-weakness#xj4y7vzkg
Source:https://www.boj.or.jp/en/research/research_data/cpi/index.htm
The Conference Board Consumer Confidence Index® increased slightly in March to 104.2 (1985=100), higher than 103.4 in February. It improved but remains below the average level reported in 2022 (104.5). Consumer expectations of inflation over the next 12 months remain elevated—at 6.3 per cent.
Source: https://www.conference-board.org/topics/consumer-confidence
______________________________________________________________________
Summary Daily Moves – Winners vs Losers (28 March 2023)

______________________________________________________________________
News Reports Monitor – Previous Trading Day (28 March 2023)
Server Time / Timezone EEST (UTC+03:00)

- Midnight – Night Session (Asian)
No important figures/release > No major impact.
- Morning – Day Session (European)
At 11:45, another speech about the collapse of Silicon Valley Bank from the BOE Governor along with Deputy Governor David Ramsden took place before the Treasury Select Committee, in London. During his statement, he pointed out that he doesn’t think that the recent US bank failures are having a significant impact on the UK economy. This optimism and good news have affected the GBP with higher volatility and an upward movement until the end of the day.
General Verdict:
– No major intraday shocks were expected due to the fact that there was not any significant figure to be released.
– The markets experienced high volatility and many pairs having the USD as quote currency have been moving upwards.
______________________________________________________________________
FOREX MARKETS MONITOR
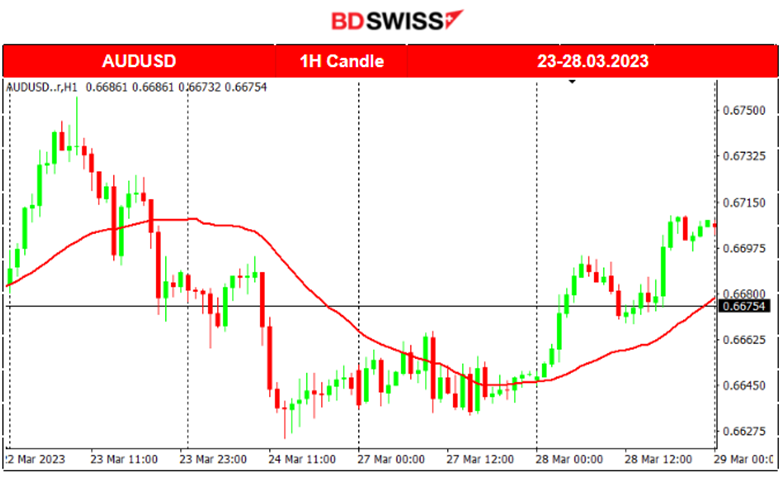
AUDUSD 4-Day Chart Summary
Server Time / Timezone EEST (UTC+03:00)
Price Movement
The pair is moving sideways around the 30-period MA. A reversal took place on the 28th following USD depreciation that lasted for the whole day.
AUDUSD (28.03.2023) Chart Summary
Server Time / Timezone EEST (UTC+03:00)
Price Movement
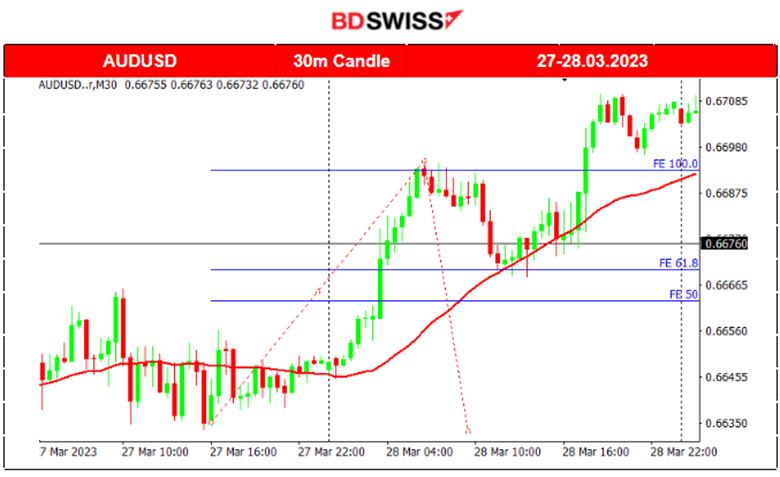
The pair experienced a couple of upward shocks during the day while moving on the uptrend. The first was a rapid movement that started from the Asian Trading Session. The Retail Sales m/m for Australia that were released had a positive change. However, they are not enough to explain the upward and sudden move of AUDUSD.
Trading Opportunities
The price had crossed the 30-period MA (from the 27th to the 28th), while moving upward, confirming a reversal. Retracement was probable. The market retraced as indicated by the chart and the correct placement of the Fibo tool shows how the pair moved back to the 61.8 level.
Our related Technical analysis on TradingView:
https://www.tradingview.com/chart/AUDUSD/wIE7EBSH-AUDUSD-Might-Reverse-28-03-2023/
______________________________________________________________________
EURCAD 4-Day Chart Summary
Server Time / Timezone EEST (UTC+03:00)
Price Movement
The EURCAD pair reversed on the 24th of March crossing below the 30-period MA and carried on following a downward trend until the 28th when a shock caused the pair to move upward crossing the MA temporarily. Later in the day, a full retracement took place bringing the pair back to its downward path.

EURCAD (28.03.2023) Chart Summary
Server Time / Timezone EEST (UTC+03:00)
Price Movement
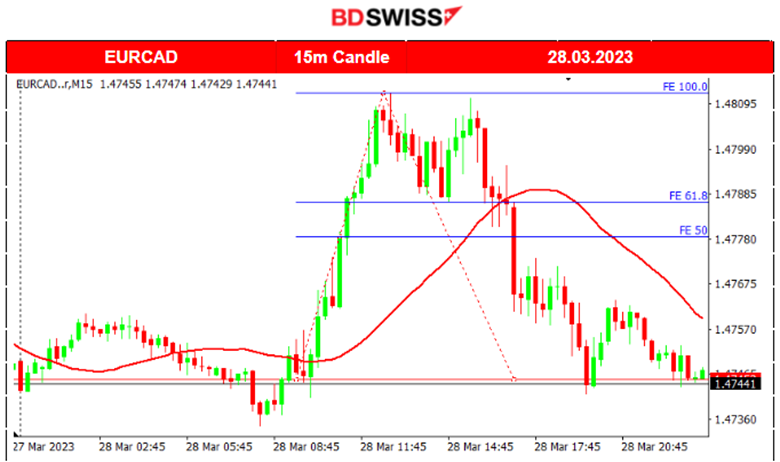
During the European Markets’ opening at around 10:00, the pair experienced a shock upwards, just over 60 pips. That was an obvious intraday shock with fundamental factors to play their part. The pair retraced back fully (100% retracement).
Trading Opportunities
It was a good upward shock followed by a reversal giving a good opportunity for catching the retracement. Even though we used the Fibo levels to find the 61.8% of the move, the pair eventually retraced back to 0% (fully).
Our related Technical analysis on TradingView:
https://www.tradingview.com/chart/EURCAD/pdClFcqx-EURCAD-Retracement-28-03-2023/
______________________________________________________________________
EQUITY MARKETS MONITOR
NAS100 (NASDAQ – NDX) 4-Day Chart Summary
Server Time / Timezone EEST (UTC+03:00)
Price Movement
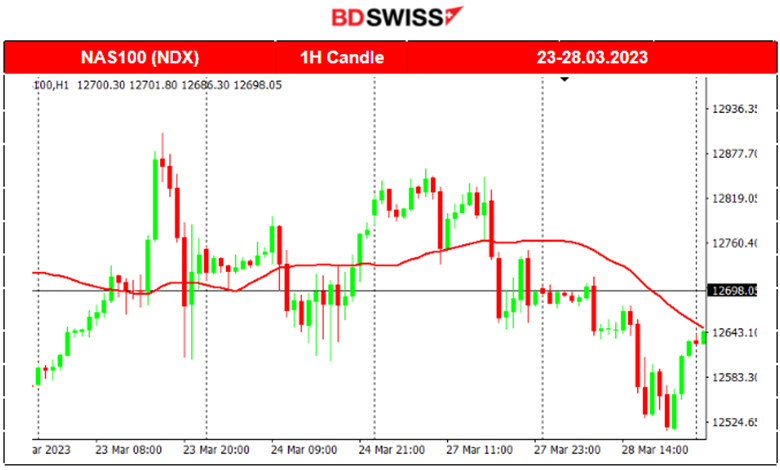
After moving side-ways following an extremely volatile path around the 30-period MA the index eventually falls and moves below the MA. That is for the Nasdaq stocks, while the US30 and S&P500 follow a different path. US30 is actually following an uptrend breaking significant resistances.
NAS100 (NASDAQ – NDX) (28.03.2023) Chart Summary
Server Time / Timezone EEST (UTC+03:00)
Price Movement
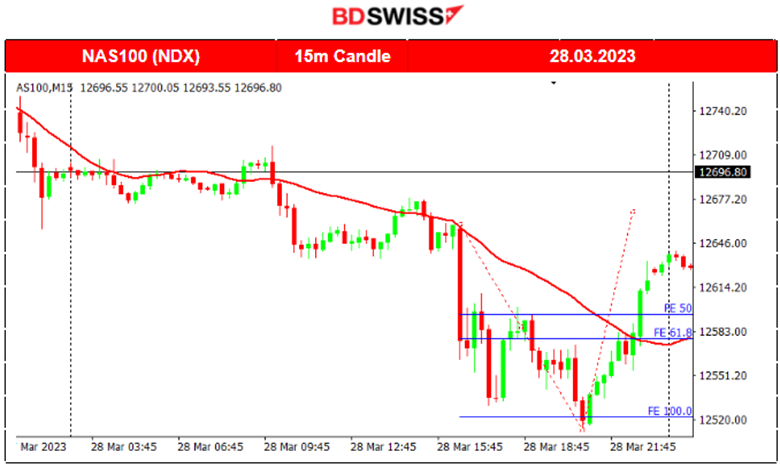
The price of the index was falling steadily yesterday but it experienced a sharp drop during the NYSE opening. Later during the day the index reversed due to high volatility and crossed the 30-period MA going significantly upwards.
Trading Opportunities
Obviously, after the U.S. Stock market opening, we expect a sharp intraday shock as orders kick in which causes retracement opportunities. As per the chart, we use the Fibonacci expansion tool to find the retracement levels. The market reversed after the end of the downward shock which was at the 12530 USD level.
______________________________________________________________________
COMMODITIES MARKETS MONITOR
GOLD (XAUUSD) 4-Day Chart Summary
Server Time / Timezone EEST (UTC+03:00)
Price Movement
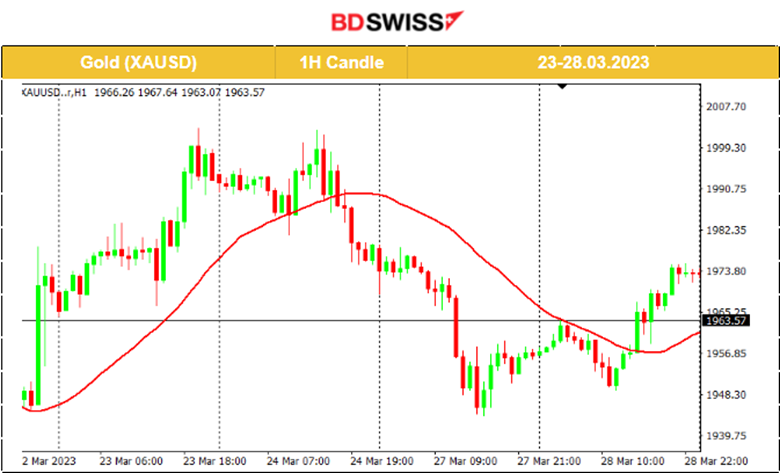
Gold has been moving upwards this month following a volatile path when eventually on the 24th its price fell from the 2000 USD level reversing from the uptrend. The price continued going downwards and eventually reversed on the 28th ending the day to its CFD price near 1974 USD.
GOLD (XAUUSD) (28.03.2023) Chart Summary
Server Time / Timezone EEST (UTC+03:00)
Price Movement
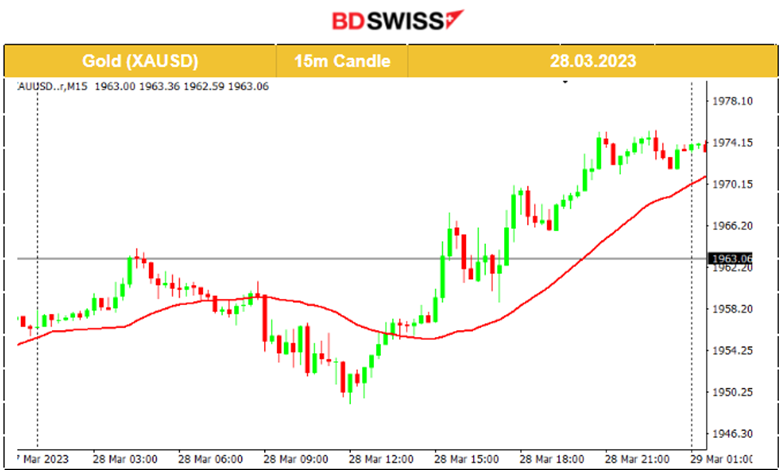
Gold price moved steadily around the 30-period MA during the Asia trading Session and then after the European Markets’ opening, it started moving upwards and steadily continuing its path over the MA in an intraday uptrend. This movement was mainly the result of the USD depreciation according to the DXY (US Dollar Index).
Trading Opportunities
The recent fundamental factors moving the price make it difficult for traders to find opportunities in the short term or intraday. Looking for rapid shocks that might create retracement opportunities should be the goal.
USOIL (WTI) 4-Day Chart Summary
Server Time / Timezone EEST (UTC+03:00)
Price Movement
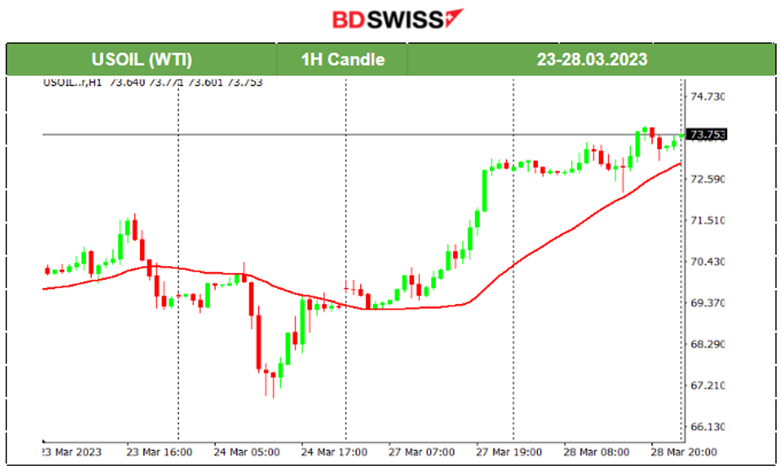
Crude price for the last 4 days has experienced two reversals. On the 23rd it crossed below the 30-period MA and on the 27th it crossed above it moving steadily upwards. Crude has been experiencing high volatility lately, due to the recent U.S. banking crisis. As large falls were followed by big jumps, it was anticipated that it would settle for some time at the 70 USD level. However, the price rises, probably due to the recent disagreements between Iraq and Kurdish officials halting 400,000 barrels a day from Ceyhan.
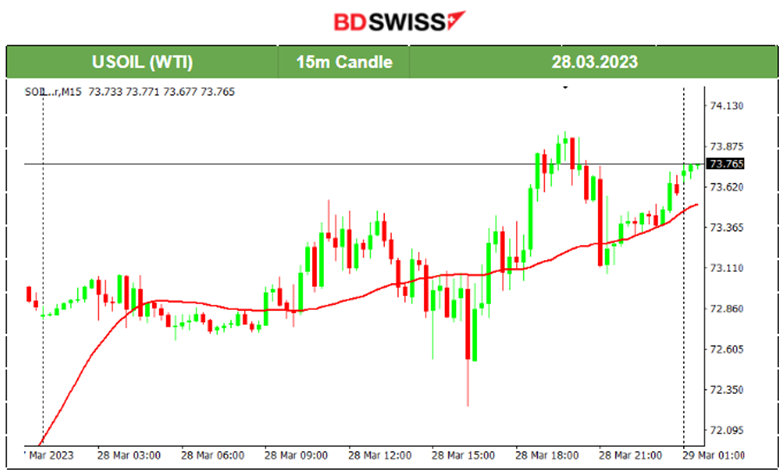
USOIL (WTI) (28.03.2023) Chart Summary
Server Time / Timezone EEST (UTC+03:00)
Price Movement
Yesterday Crude’s price was mainly moving around the 30-period MA characterised by intraday volatility with 0.60-0.80 USD deviation from the mean. It eventually closed the day at its CFD price of 73.70 USD.
Trading Opportunities
The recent fundamental factors moving the price make it difficult for traders to find opportunities in the short term or intraday. Nevertheless, they should focus on rapid shocks that might create retracement opportunities.
______________________________________________________________
News Reports Monitor – Today Trading Day (29 March 2023)
Server Time / Timezone EEST (UTC+03:00)

- Midnight – Night Session (Asian)
The Consumer Price Index (CPI) figure for Australia came out this morning at 3:30 (Asian Trading Session) less than expected at 6.80% causing the AUD to depreciate. AUDUSD and AUDNZD fell by about 20 and 30 pips respectively at that time while retracements followed after this intraday shock.
- Morning – Day Session (European)
No important scheduled figures are to be released so it is less possible to have intraday shocks. Volatility is expected since the markets shake due to the speeches of central bank officials and frequent announcements.
The U.S. Crude Oil inventories change figure is about to be released at 17:30 and it is expected to be positive and of the size of 1.8M. Since the start of 2023 changes recorded were almost all positive and over 1M. One negative 1.7M was recorded in March.
General Verdict:
______________________________________________________________


