Rates as of 04:00 GMT
Market Recap
After a generally down day Friday on Wall Street, markets are somewhat encouraged this morning by news that the Republicans have at least agreed among themselves on a proposal for fixing the “fiscal cliff” that millions of unemployed in the US are about to fall off of when their federal unemployment benefits expire at the end of this week. Never mind that their proposal stinks. It would extend the federal unemployment benefits while leaving most of the other objectives unresolved pending negotiations with the Democrats. As the New York Times put it, “With Democrats already on record in opposition to a piecemeal approach, a narrow fix is almost certainly dead on arrival. Republicans know that, suggesting their Sunday proposal may in part be a negotiating tactic laying the groundwork to blame the opposition party when the funds ultimately expire.”
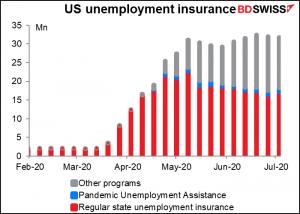
There are now around 32mn people in the US receiving some form of unemployment benefits. This compares to 2.1mn average in January and February. But much of this assistance will expire at the end of July, according to the provisions of the Coronavirus Aid, Relief, and Economic Security (CARES) Act (see Friday’s weekly comment, “Let’s Get Fiscal!”)
The Democrat-controlled House of Representatives passed their proposal back in May and has been waiting for the Republicans to come up with something since then. Unfortunately the Republican-controlled Senate can’t agree on a proposal with the Republican-controlled White House. They’re still negotiating and hope to have something concreted by this afternoon.
Once the Rs do get a proposal, it’s likely to take a long time to get it passed. The Republicans will then have to iron out their differences with the Democrat-led House. That could take weeks. And even after that’s done, senior Republicans predict that half their members will vote against it anyway, because they object to more stimulus in any form.
Funny, they didn’t object when the vote was about cutting taxes for the rich – but the thought that someone poor might get something for nothing makes them apoplectic. This is the Republican war on the working poor: if they can’t kill them with COVID-19 by taking away their health insurance and then forcing them to work among people without masks, then they’ll starve them to death.
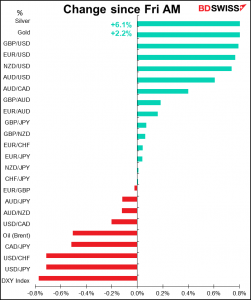
Getting back to the markets, you’ll notice from the graph above what the result in the FX market is: USD down vs everything. JPY was the main beneficiary, mostly gaining on Friday as stocks slumped but continuing the rally this morning as well.
EUR gained as the main alternative to USD. It was relatively stable on Friday morning despite better-than-expected EU purchasing managers’ indices, but then began gaining once the US came in. This probably reflects different positioning: European investors are already relatively long euros, while US investors are positioned lighter in the currency.
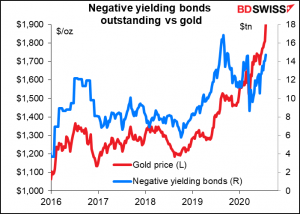
The precious metals were the star of the show once again. Silver rose an incredible 6% since Friday morning while gold this morning hit a new record high of $1,944.71, blasting through the previous intraday high of $1,921.18 set on 6 Sep 2011.It’s hard to say what’s behind this: fear of inflation due to the massive money-printing perhaps, but that’s odd given that the reaction to the virus crisis so far has been deflation.(See also former ECB VP Vitor Constâncio’s comments below on the monetary approach to inflation. Even he doesn’t believe it anymore.) If it’s a “risk-off” move then why are stocks doing so well? Perhaps it has more to do with negative interest rates – metals have storage costs but that’s all. But even there, gold has outpaced its previous relationship with the amount of negative-yielding bonds outstanding.
Regardless of why, it seems that this is the new market fad. I wouldn’t bet against it quite yet.
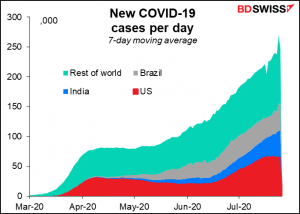
Meanwhile, cases of the virus keep climbing globally. It looks as if cases in the US have at least plateaued, but that could be just because the Trump regime has taken control of reporting the numbers.
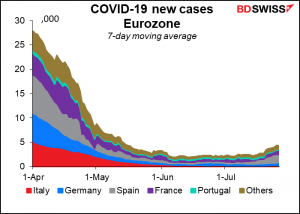
They’re also rising in the Eurozone, but nothing like the US. The Eurozone (population 342mn) is averaging 4,333 new cases a day; Florida (population 21.5mn) alone is averaging 10,544. (Texas and California also have more new cases than the entire Eurozone.) Trump was right: the US is winning!
High-frequency data shows US unemployment rising
The US Bureau of Labor Statistics, which compiles the employment data and the nonfarm payrolls, earlier this year started producing a more up-to-date estimate of employment. Called The Real-Time Population Survey (RPS), it’s “an online survey of adults that are representative of the US population along several key characteristics.” “The central goal of the RPS is to document labor market trends in real time and at a higher frequency than official statistics,” according to the BLS’s website. The figure comes out about every two weeks.
The RPS shows unemployment high and rising. It estimates that the unemployment rate is higher not only than the official unemployment rate, but also the “adusted” unemployment rate. The “adjusted” figure reclassifies all those deemed “absent from work because of the coronavirus’’ as unemployed, which is where they probably should be. Even taking that into account, it gives a higher result.
More worrisome than the level is the direction of change. From 15 Jun to 1 Jul it rose from 15.0% to 15.9%. This is yet another sign that the US economic recovery is going in reverse. FYI it agrees with the forecasts for Thursday’s jobless claims, which are expected to show a rise from the previous week (both initial and continuing).

Market positioning
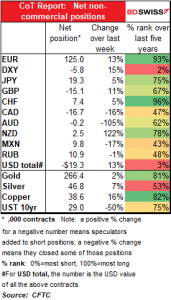
The Commitments of Traders (CoT) report shows the same trend we’ve been seeing for weeks: out of the dollar, into the euro and other currencies. It’s noticeable that positions in the dollar (both via currencies and the DXY) are near the shortest they’ve been for five years.
However, as you can see that’s largely because the market hasn’t been particularly short USD for many years now. If we go back to 2011 though, when the dollar was much weaker, positions were much shorter – the record was -$43bn in May 2011, more than twice today’s -$19.3bn. So positioning should be no hindrance to a weaker dollar.
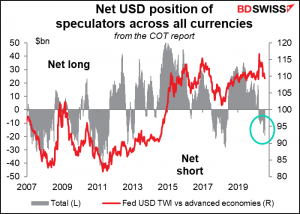
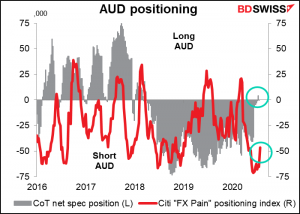
The increase in short USD positions this week came entirely through an increase in long EUR positions. There were other small movements in other currencies, but they largely offset each other. In particular, specs had been long AUD last week for the first time after 119 consecutive weeks of being short, but that only lasted for one week and they went back to being (modestly) short AUD. On the other hand, they reduced their short CAD positions.
I would also point out that despite the amazing surge in silver prices, specs are not particularly long the metal. There’s plenty of room for the specs to pile int.
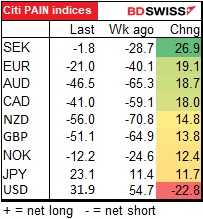
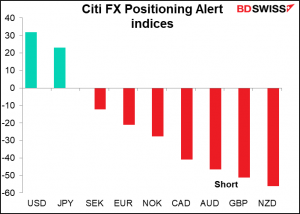
The Citi FX Positioning Alert Indicators (“FX PAIN”) show a similar story: FX fund managers reducing their positions in the dollar and elsewhere, either increasing their long currency positions (JPY) or reducing their short currency positions (everything else). They particularly reduced their short SEK positions, which was a good idea since that was the best-performing currency last week.
One of the noticeable differences between the CoT report and the PAIN indices is AUD. Specs have turned neutral on AUD much more rapidly than fund managers have. Fund managers are off theThis is probably because AUD is finding a new use among fund managers as a funding currency for long emerging-market (EM) currency carry trades. Because of their sensitivity to global growth and commodity prices, AUD and CAD are closely correlated with EM currencies. That makes them a good candidate to fund carry trades, since there’s less chance of them appreciating at the same time as the asset currency depreciates. The FX PAIN reading of -71.4 on 5 June wasn’t far off the record low of -80.8 set in October 2015 (data back to 2006).
It’s a big change for AUD, which traditionally was an asset currency in carry trades because of its relatively high interest rates, but with all G10 interest rates converging at zero nowadays, that advantage is gone.
Risk reversals: The options market too got increasingly negative on USD: bearish USD or less bullish, depending on which pair you’re looking at.
There was also a less “risk-off” mood, with the negative USD/JPY RR moving more negative and AUD/JPY and AUD/USD moving less negative.
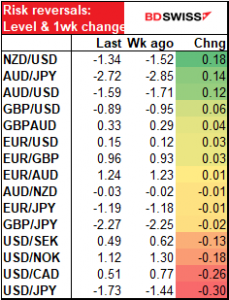
However, I wouldn’t say it’s a “risk-on mood by any means. The market is really negative on AUD. It’s most bullish on EUR/AUD and most bearish on AUD/JPY. Or give that the three most-negative RRs are XXX/JPY, perhaps it’s more accurate to say that the market is really bearish AUD and really bullish JPY. That’s still a “risk-off” view.
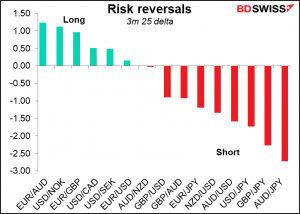
Looking at the RRs compared to their one-year range, the market is going for less volatility than in the past year. This may be a function of the declining volatility in the FX market recently.
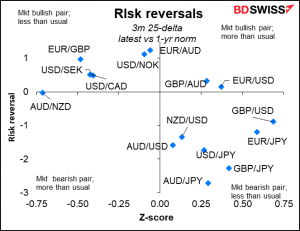
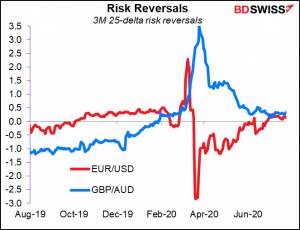
The most interesting ones are the two in the first quadrant (upper right-hand corner), EUR/USD and GBP/AUD. EUR/USD has recently turned positive after several months of being negative – the market is no longer scrambling for dollars and is starting to turn bullish EUR. On the other hand, the market was extremely bullish GBP/AUD but has gradually become less so. (This pair shows up in the “more bullish than usual” quadrant even though it was more bullish a few months ago because the RR has averaged only slightly above zero over the last year)
Explanation:
The Commitments of Traders (CoT) report, from the US Commodity Futures Trading Commission, gives us the positions of speculative accounts on the various futures markets in the US. The data is taken on Tuesday and is released on Friday evening in the US.
The Citi FX Positioning Alert Indicators (“FX PAIN”) “infer positioning of active currency traders from relationships between exchange rates and currency managers’ returns. A positive reading suggests that currency traders have been net long the currency and a negative reading suggests that currency traders have been net short the currency.”
The risk reversal (RR) is a gauge derived from the FX options market of whether the market thinks there’s a greater chance of a currency pair rising or falling. If the market thinks it’s more likely that the pair will rise, then the RR will be positive; if it’s more likely to fall, then negative. The more positive (negative) it is, the greater likelihood that the market places on the pair rising (falling).
Z-score: how many standard deviations a series is away from its average. This is important because some series are more volatile than others. By looking at the Z-score rather than just the deviation from the average, we put all the series on a common footing.
Today’s market
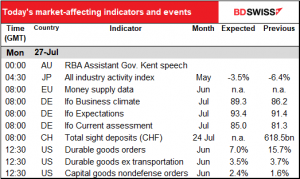
The European day starts with the EU money supply data. This used to be a biggie, but nowadays no one cares about money supply. Over the weekend I saw a tweet by former ECB VP Vitor Constâncio saying that “Economics is indeed struggling with inflation theory. Monetary aggregates and monetarism have been correctly abandoned…in times of globalisation there are too many drivers of inflation besides monetary policy and domestic slack in the economy.” “It is time to shed some myth that ‘Inflation is always and everywhere a monetary phenomenon’”, he said. So even the ECB has given up on half of its “two pillar approach” to monetary policy (the other pillar being economic analysis). However, the money supply data are still worth noting because of the bank lending figures that come out with them, not because M3 is forecast to grow by 9.3%, up from 8.9% (yes, some people are apparently still forecasting this figure, even though the former VP of the ECB says the whole concept behind following it has been ”correctly abandoned.”)
The day then starts really with the Ifo survey. It’s expected to show an improvement in all three indices.
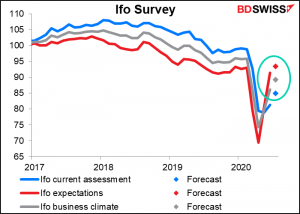
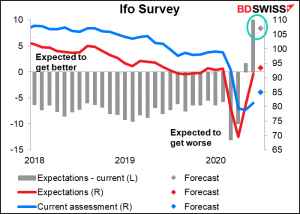
The expectations index is forecast to rise a bit less than the current situation forecast, meaning that the amount that people expect the world to improve by falls a bit. But that’s only natural — the fact that it remains relatively high may be EUR-positive.
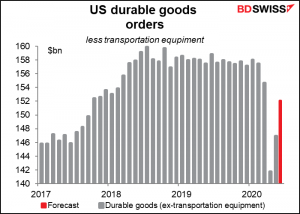
In the US, durable goods orders are forecast to bounce back to March’s level.
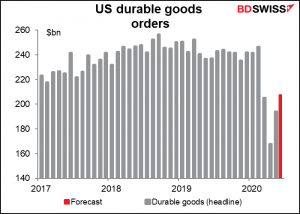
A lot of that seems to be auto or aircraft manufacturers gearing up again. Excluding transportation orders, they’re expected to be still below March’s level, although well above the April lows.
