Announcements:
Summary Daily Moves – Winners vs Losers

News Reports Monitor – Previous Trading Day News/Reports

- Midnight > Night session
No important figures / release > No major impact.
- Morning – Day session (European)
Friday is considered a slow-moving day for FX Pairs and not very important figures were released except the Final CPIs for the US having a relatively mild impact as the CPI Flash Estimate and German Prelim CPI are released about 15 days earlier. No intra-day big shocks were expected from these figures.
General Verdict:
– Expecting low Market volatility.
– Expecting trending markets only from fundamentals.
______________________________________________________________________
FOREX MARKETS MONITOR 
EURUSD 5-Day Chart Summary
Price Move:
The EURUSD experienced a significant shock downwards on the 15th March. It retraced back approximately 70% and continued its path upwards, moving on an upward trend above the 30 period MA.
Recent news show expectations of a further US Dollar decline. This pushes expectations for further appreciation of EURUSD, and USD pairs, in general.

EURUSD 17.03.2023 Chart Summary
Price Move:
The pair starts to move upwards until the European market opening when it then starts falling steadily below the 30 period MA. During the afternoon session it comes back crossing the MA again upwards. The absence of important news caused the pair to move around the MA without creating any intra-day long trends.
Consumers turned negative in March even as their expectations for inflation improved, according to the latest monthly survey. The release happened at 16:00 and after that the pair started rising since the USD started its short depreciation path.
Deviations from the MA were about 20-30 pips.
Trading Opportunities
The absence of shocks and major releases cause the pair to remain in range. Support and Resistance levels are stronger and the pair does not deviate significantly from the MA. Slow Market creates opportunities for catching short price reversals.
______________________________________________________________________

USDJPY 5-Day Chart Summary
Price Move:
The USDJPY has been experiencing volatility, moving around the 30 period MA which was following a steady downward path.
On the 15th of March it experienced a shock downwards related to the recent news related to the regional bank failures in the U.S. As we have observed previously, the JPY has also been gaining momentum on the positive against other major currencies this month.

USDJPY 17.03.2023 Chart Summary
Price Move:
The pair has been moving below the 30 period MA and shows clearly that it follows a downward trend. With the release of the Consumers sentiment which turned negative the USD had been depreciating and this in combination with the JPY appreciation we have a trend like this.
Trading Opportunities
The absence of major shocks and news releases make the trend sustainable. No other shock caused any distortion. The JPY path could be followed and forecasted.
______________________________________________________________________
EQUITY MARKETS MONITOR

NAS100 (Nasdaq) 4-Day Chart Summary
Price Move:
The index has been moving upwards the previous days, above the 30 period MA showing an upward trend. However, the index is recently reacting to the news and the crisis in the US banking sector. Regulators worldwide rushed to shore up market confidence over the weekend (18-19 March 2023). This stress in the banking system will likely cause an end to the bear market in US stocks. In any case, with all things happening, the moves are expected to be very volatile for indices with large rapid moves up/down.

NAS100 17.03.2023 Chart Summary
Price Move:
With the absence of significant news, it was expected that there would be a slow market and at the Exchange opening we would experience the shock. That happened.
Early morning session shows low volatility, the price moving in a small range as expected. The index price started accelerating at 16:30 upwards right after the market opening. Even though it lost momentum it did not retrace. This shows a strong upside.
Trading Opportunities
Even though the index price experienced a shock at the market opening there was no retracement. Tricky move for the trades who use Fibo retracement levels. A confirmation break of a support would be needed there to confirm retracement. Break of 12404 level would suffice.
______________________________________________________________
COMMODITIES MARKETS MONITOR

USOIL (WTI) 4-Day Chart Summary
Price Move:
Crude oil price has been decreasing heavily and as you can see from the chart, a great drop can be seen on the 15th March, following the news of the demise of Silicon Valley Bank and Signature Bank in the United States.
The price moves below the 30 period MA on a downward trend and by the end of the week it looks that it is stabilizing. However, oil prices continue to fall despite Central Bank Action to help troubled lenders in the U.S. and Europe.
The nature of Crude Oil is such that it does not give too much room for trends. It is rather volatile and trends do not hold for long unless fundamental factors remain on hold.

USOIL (WTI) 17.03.2023 Chart Summary
Price Move:
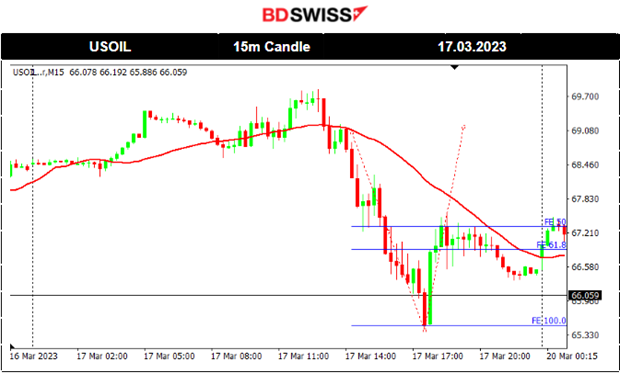
While the price of OIL was moving upward, a clear downward rapid and volatile move has taken place. Opportunity for retracement was clear. Using the Fibonacci expansion tool, traders could identify the 61.8% of the whole move and capture the retracement.
Looking back at the big picture of the chart, there was a significant support at 65.80 USD/barrel indicating that around that level the intraday shock found its end and the Fibo tool was appropriate to use.
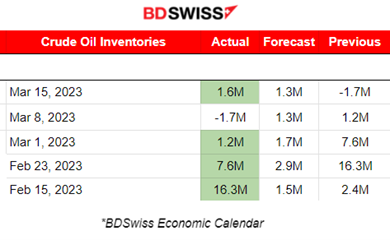
US Crude Oil inventories show positive changes overall, meaning that there is less demand and probably oversupply as Russia produces oil and does not proceed in cuts. Nevertheless the price of its CFD reached as low as 64.40 USD already today 20th March.

News Reports Monitor – Today Trading Day News/Reports

- Midnight > Night session
No important figures / release > No major impact.
- Morning – Day session (European)
Monday is considered a slow-moving day for FX Pairs and not very important figures to be released. Today, 20th March, the Trade Balance figure for the United States was released which is less than what was estimated adding some USD appreciation.
“The Russian invasion of Ukraine – which you have selected as a topic for this hearing – is first and foremost a human tragedy for the people of Ukraine,” Lagarde said.
ECB President Lagarde spoke about inflation at 16:00. It is expected to remain high for a long time. That is why the key interest rates are going to be used as their primary tool to fight it and their future moves will always depend on recent data.
Source: ecb.europa.eu
General Verdict:
– Expecting low Market volatility.
– Expecting trending markets only from fundamentals.


