PREVIOUS TRADING DAY EVENTS – 11 August 2023
According to previous CPI reports, consumer prices rose moderately in July. Most economists expect the Federal Reserve to keep interest rates unchanged at its next month’s policy meeting.
“The economy still faces some inflationary pressure from rapidly rising wages, but the cooldown of business input costs should help keep consumer prices on a downward trajectory in the fall,” said Bill Adams, chief economist at Comerica Bank in Dallas.
“The last two months of consumer goods price disinflation is on solid footing and more should be on the way,” said Will Compernolle, macro strategist at FHN Financial in New York. “This is the area of disinflation the Fed and market participants have been expecting for a while, mostly stemming from supply chain normalization.”
The University of Michigan’s consumer sentiment survey on Friday showed a fall in expectations to 3.3% in August from 3.4% in July. They have been stable for three consecutive months.
The Fed’s 2% target is far from being reached and further work is to be done. With the CPI and PPI data in hand, economists estimated that the core personal consumption expenditures price index increased 0.2% in July, matching June’s gain.
The PCE price index data will be published later this month.
“Despite continued disinflationary pressures continuing to build and inflation moving closer to the Fed’s 2% target, we are not out of the woods yet,” said Eugenio Aleman, chief economist at Raymond James.
Source: https://www.reuters.com/markets/us/us-producer-prices-increase-july-rebound-services-2023-08-11/
______________________________________________________________________
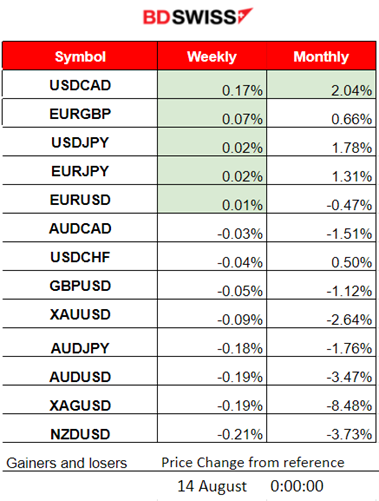
Winners vs Losers
______________________________________________________________________
News Reports Monitor – Previous Trading Day (11 August 2023)
Server Time / Timezone EEST (UTC+03:00)
- Midnight – Night Session (Asian)
No important news announcements or any special scheduled releases.
- Morning – Day Session (European and N.American Session)
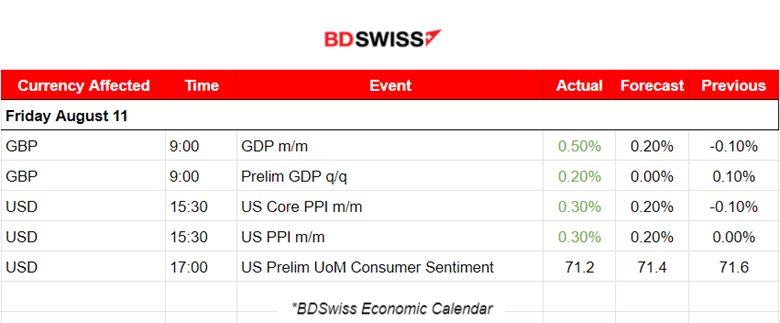
The monthly real Gross Domestic Product (GDP) is estimated to have grown by 0.5% in June 2023, following a fall of 0.1% in May 2023 and a growth of 0.2% in April 2023. Looking at the broader picture, the GDP has shown 0.2% growth in the three months till June 2023. The market reacted with a low-level intraday shock and some GBP appreciation that lasted only for a while this morning.
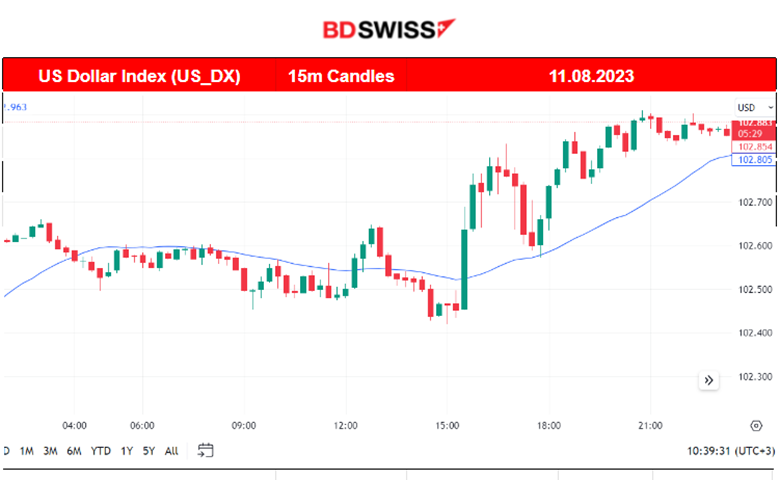
Friday’s PPI data at 15:30 showed that the PPI index for final demand increased 0.3 per cent in July, which is more than expected. The USD experienced appreciation at that time.
The U.S. Consumer Sentiment report showed a slight decrease in consumer confidence among Americans compared to July causing the USD to depreciate for a while at that time. By looking at the DXY chart below, it is quite apparent how and to what degree the releases affected the U.S. Dollar. In general, the dollar appreciated against other currencies last Friday the 11th.
General Verdict:
____________________________________________________________________
FOREX MARKETS MONITOR
EURUSD (11.08.2023) Chart Summary
Server Time / Timezone EEST (UTC+03:00)
Price Movement
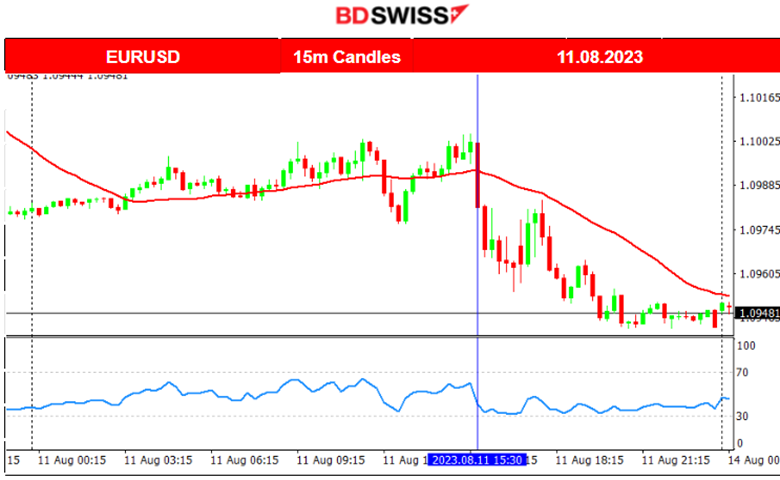
The EURUSD moved with low volatility on a sideways path during the Asian sessions and the early European session. Then at 15:30, it experienced a drop since the inflation-related data for the U.S. came out. The Dollar experienced appreciation as the PPI data were reported higher than expected. This caused the EURUSD to move below the 30-period MA. It remained on the downside until the end of the trading day.
___________________________________________________________________
EQUITY MARKETS MONITOR
NAS100 (NDX) 4-Day Chart Summary
Server Time / Timezone EEST (UTC+03:00)
Price Movement
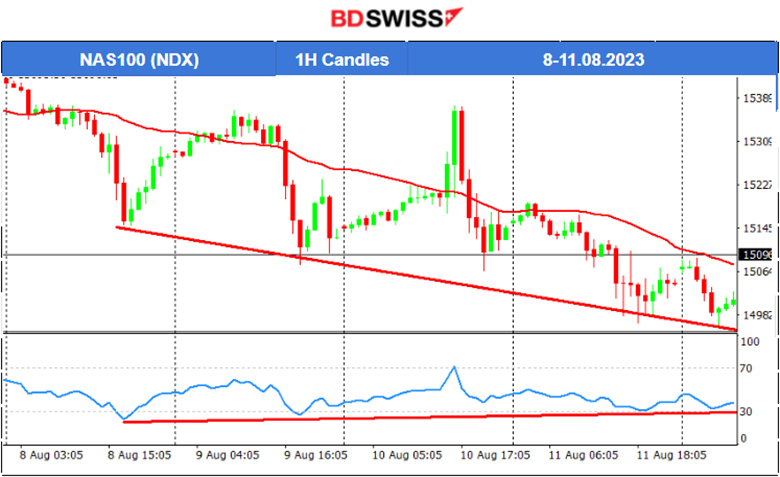
After the recent announcements from Fitch Rating and Moody’s, the U.S. stock market suffered a downtrend. The benchmark U.S. indices are moving to the downside but at a highly volatile pace. On every recent market/exchange opening, we see the NAS100 moving rapidly to the downside before retracing back to the mean. It is still remaining below the 30-period MA and breaks support levels on its volatile way to the downside. The downward trend is clear and there are no signs that it will end soon.
______________________________________________________________________
COMMODITIES MARKETS MONITOR
USOIL (WTI) 4-Day Chart Summary
Server Time / Timezone EEST (UTC+03:00)
Price Movement
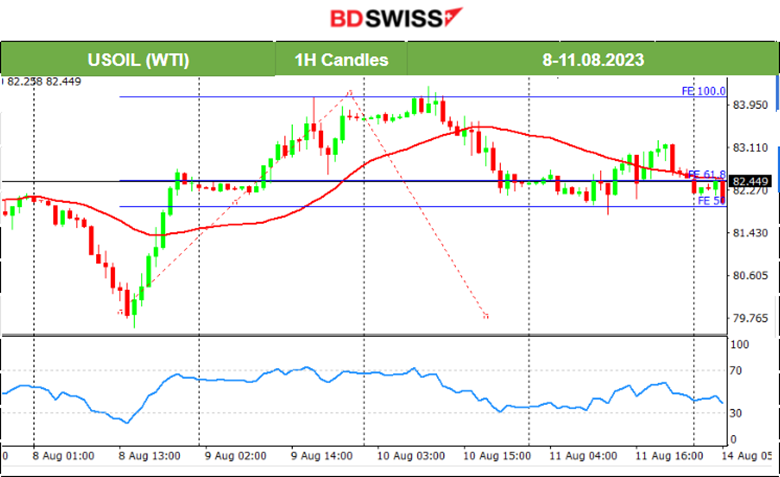
Crude shows signs of a slowdown. The RSI was in the overbought area and some reversal was expected. Eventually, a retracement took place back to the mean, finalising on the 10th of August. Crude is probably on a sideways path which is actually quite volatile with no clear direction.
XAUUSD (Gold) 4-Day Chart Summary
Server Time / Timezone EEST (UTC+03:00)
Price Movement
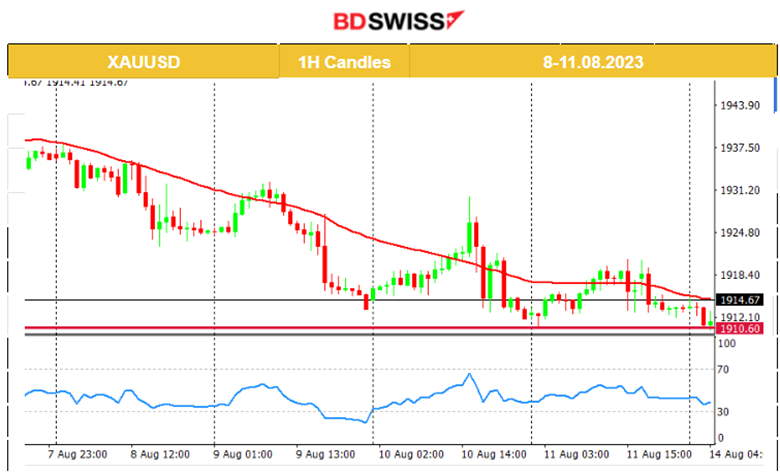
As the USD is gaining strength, we see Gold moving lower and lower. However, Gold has currently shown signs of slowing down testing the supports near 1910 USD/oz frequently. The RSI shows signs of bullish divergence, though will this continue? A downtrend is apparent, the MA is obviously going down and a reversal is possible but the price in that case will probably move only sideways in case the trend ends, at least for the short term.
______________________________________________________________
News Reports Monitor – Today Trading Day (14 Aug 2023)
Server Time / Timezone EEST (UTC+03:00)

- Midnight – Night Session (Asian)
No important news announcements or any special scheduled releases.
- Morning – Day Session (European and N.American Session)
No important news announcements or any special scheduled releases.
General Verdict:
______________________________________________________________


