PREVIOUS TRADING DAY EVENTS – 19 April 2023
Announcements:
The U.K. is the only country in Western Europe with double-digit inflation in March. Its headline inflation rate is now the highest within Western Europe compared to the average of 6.9% in the Eurozone and 5.0% in the United States. Austria recorded a higher inflation rate than Britain in February.
“It’s now clear the UK has an inflation problem that is worse and more persistent than in Europe and the U.S.,” said Ed Monk, associate director of personal investing at asset manager Fidelity International.
“Price rises here are proving more difficult to neutralise and the Bank of England will almost certainly add at least one more quarter-point hike to borrowing costs.”
European Central Bank policymakers have pointed out several times recently that interest rates need to keep rising. The debate appears to be between a 25 basis point and a 50 basis point increase to be determined at the upcoming meeting on May 4. There is still a high chance that the ECB will go for a bigger increase.
______________________________________________________________________
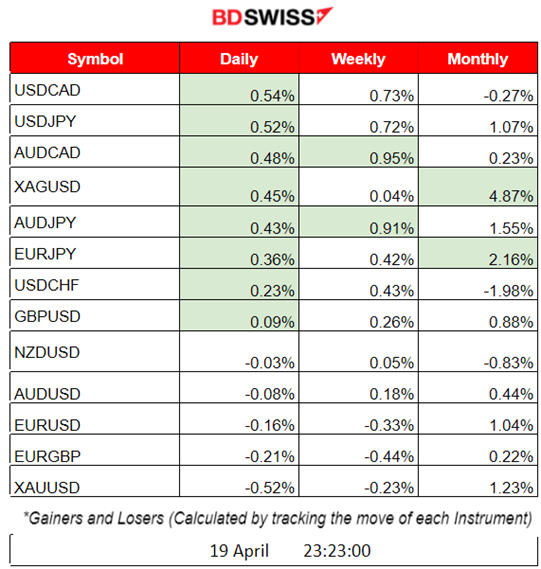
Summary Daily Moves – Winners vs Losers (19 April 2023)
______________________________________________________________________
News Reports Monitor – Previous Trading Day (19 April 2023)
Server Time / Timezone EEST (UTC+03:00)

- Midnight – Night Session (Asian)
No significant news announcements and no important scheduled releases.
- Morning – Day Session (European)
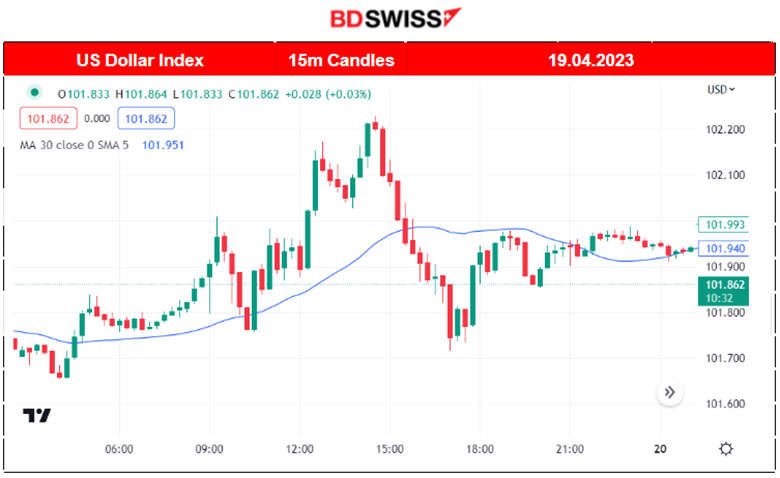
The U.K. CPI data was released early at 9:00. It was reported that the CPI change was 10.1% higher than expected but below the previous month’s figure. The GBP appreciated heavily.
The Final CPI figures for Europe were released at 12:00. All figures were as expected. Minimal impact on the EUR, with short depreciation.
General Verdict:
FOREX MARKETS MONITOR
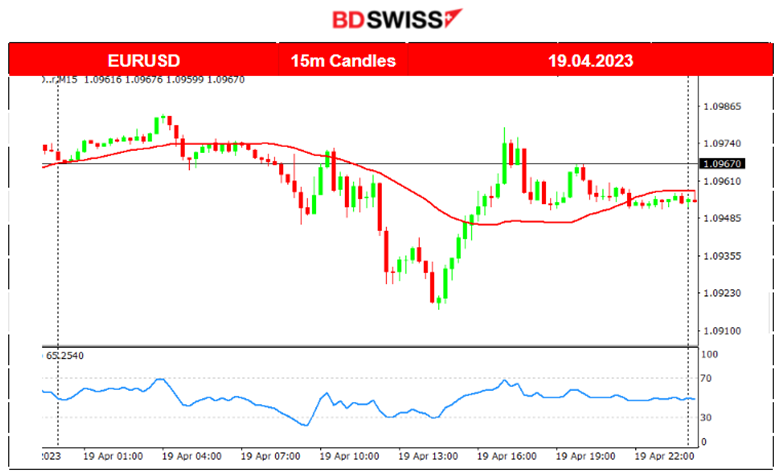
EURUSD (19.04.2023) Chart Summary
Server Time / Timezone EEST (UTC+03:00)
Price Movement
The pair started to move downwards while approaching the European Markets opening, dropping a little more after the Final CPI figures were released and around noon it stopped. The euro area’s annual inflation rate was 6.9% in March 2023, lower than the 8.5% in February. Price reversed after that, crossing the 30-period MA and moving upwards until it eventually stopped again and retraced. The price path after that was sideways and less volatile.
EURGBP (19.04.2023) Chart Summary
Server Time / Timezone EEST (UTC+03:00)
Price Movement
At 9:00, the reported yearly CPI figure for the U.K caused the GBP to appreciate heavily. EURGBP dropped at that time and soon retraced.
Trading Opportunities
No other major scheduled releases that day created room for the retracement opportunity after the CPI release. After dropping more than 30 pips, the pair showed resistance. By using the Fibonacci expansion tool we can see the 61.8% level at which the price might return. The pair indeed returned to the 50% level as depicted.

____________________________________________________________________
EQUITY MARKETS MONITOR
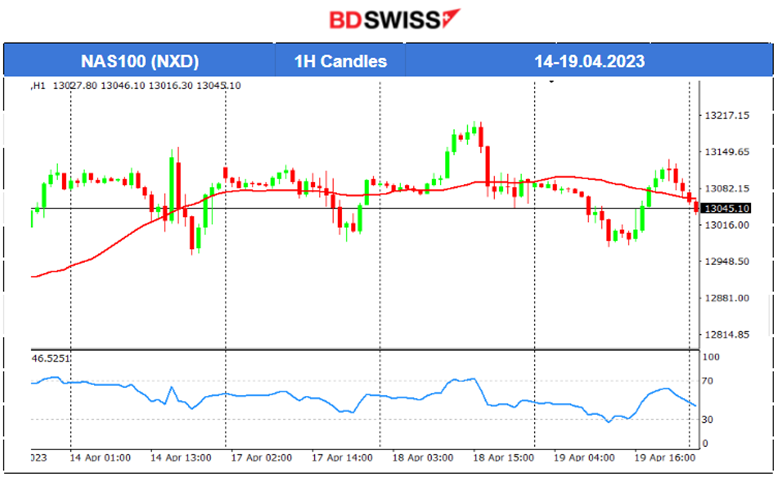
NAS100 (NDX) 4-Day Chart Summary
Server Time / Timezone EEST (UTC+03:00)
Price Movement
All U.S. benchmark indices have similar charts as NAS100 and continue their steady sideways path with high, but expected, volatility. This week the market had no important figure releases significantly affecting the USD or having any great impact on investment decisions. The only important fact to consider is that the cost of doing business is lower as Crude’s price is falling.
______________________________________________________________________
COMMODITIES MARKETS MONITOR
USOIL (WTI) 4-Day Chart Summary
Server Time / Timezone EEST (UTC+03:00)
Price Movement
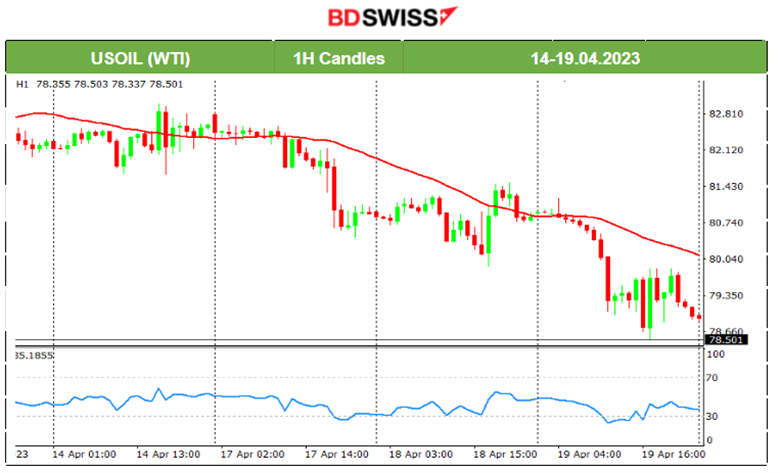
The downward trend is now clear as Crude is moving below the 30-period MA and RSI is mostly below the 50 level. Crude’s price fell below 78.5. The recent reports concerning the U.S. economy implied fears of less oil demand. On the 19th of April, the U.S. Crude Oil Inventories figures showed -a 4.6M change for the previous week explaining the elevated price. However, this week oil prices fell as the latest economic report revealed the slowdown effects of monetary tightening.
XAUUSD (Gold) 4-Day Chart Summary
Server Time / Timezone EEST (UTC+03:00)
Price Movement
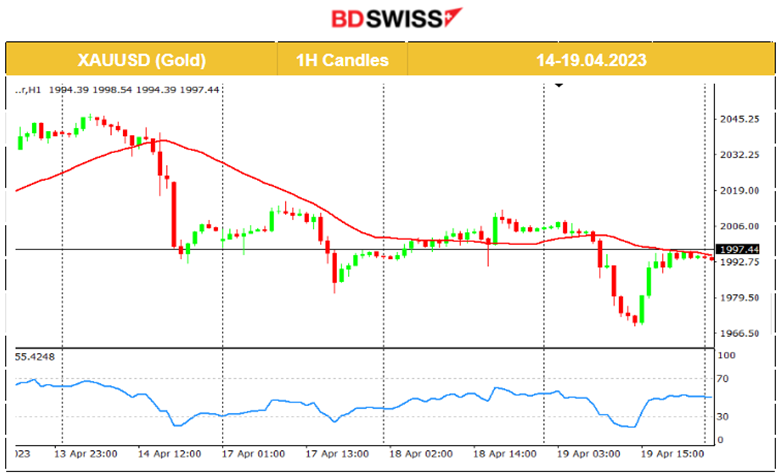
Gold is falling lower and lower as the USD appreciates the last few days. Some important supports are broken, however, the path downward is not clear for Gold. Especially now that the markets are moving in consolidation phases and investors are growing fears of U.S. recession. Investment mode might turn off soon. Demand for less risky, safe-haven assets might get triggered again as the economy slows down more.
______________________________________________________________
News Reports Monitor – Today Trading Day (20 April 2023)
Server Time / Timezone EEST (UTC+03:00)
- Midnight – Night Session (Asian)
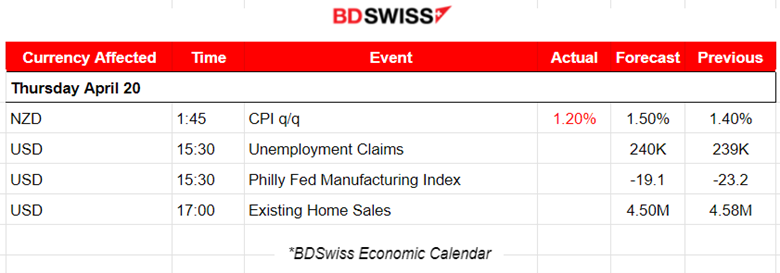
At 1:45 the CPI figure for New Zealand was released. 1.2% was less than anticipated and less than the previous 1.4% figure, showing that inflation slowed way more than economists’ expectations and that the central bank might stop raising interest rates aggressively. At that time the NZD depreciated heavily. NZDUSD dropped more than 30 pips.
- Morning – Day Session (European)
At 15:30 important figures for the U.S. are about to be released. Unemployment Claims and the Philly Fed Manufacturing Index. These figures are not expected to cause a shock for USD but they might create higher volatility to USD pairs than typical.
General Verdict:
______________________________________________________________


