PREVIOUS TRADING DAY EVENTS – 06 April 2023
Announcements:
The unemployment rate remained steady at 5%, near a record low. The high interest rates set by the Bank of Canada (BOC) may not have boosted the borrowing costs high enough when considering these figures.
Next week, on the 12th of April, BOC is scheduled to set rates again. Since the 8th of March, BOC has paused the rate hikes. They kept borrowing costs unchanged for the first time in a year. Job gains, high output growth and above- target inflation could push the BOC to implement a tightening policy.
“Bad news for the Bank of Canada was good news for Canadian workers in March,” Royce Mendes, head of macro strategy at Desjardins Securities, said in a report to investors. “They’ll keep the door open to more hikes, but the recent banking sector turmoil raises the bar to unleash any more rate increases.”
“Although today’s report isn’t enough to get the Bank off the sidelines, the fact that nothing so far seems to be able to crack the Canadian jobs market juggernaut must be worrying,” James Orlando, an economist at Toronto-Dominion Bank, said in a report to investors.
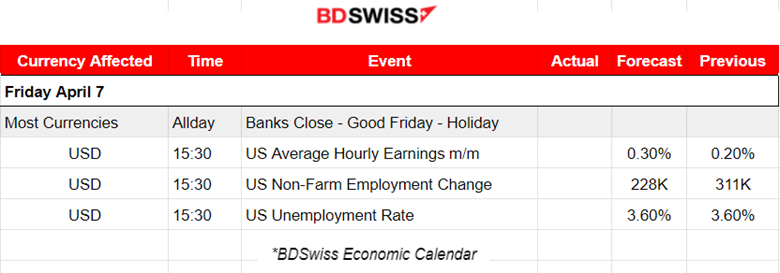
The U.S. jobs report is expected to show a 228K change, thus another strong hiring in March, and a historic low unemployment rate at 3.6%. Data show that the labour market remains relatively strong.
“Jobless claims this morning came in a little higher than expected and that lends credence to the idea that the Fed’s rate hikes are beginning to cool down the labour market and slow down the economy,” said Chris Zaccarelli, chief investment officer at Independent Advisor Alliance. “No one knows what it will take to bring inflation back down to the 2% target, but the odds are much higher that it will cause a recession – and even a significant recession – than most people are currently willing to believe.”
Bloomberg Economics’ recession-probability model estimates a 97% chance of a recession occurring as soon as July. The 12-month-ahead recession probability remains at 100%.
______________________________________________________________________
Summary Daily Moves – Winners vs Losers (06 April 2023)

______________________________________________________________________
News Reports Monitor – Previous Trading Day (06 April 2023)
Server Time / Timezone EEST (UTC+03:00)

- Midnight – Night Session (Asian)
No important announcements were released. No significant scheduled releases.
- Morning – Day Session (European)
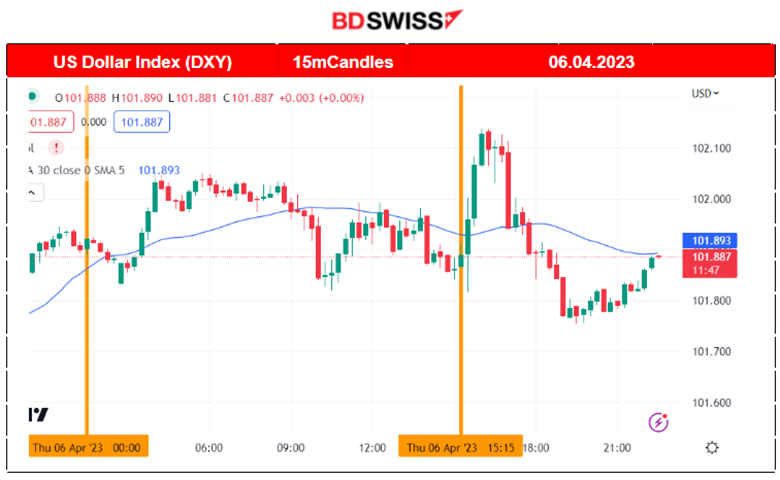
At 15:30, Canada’s employment change and unemployment rate figures were released. Employment rose by 35,000 (+0.2%) in March, and the unemployment rate held steady at 5.0%. This led CAD to appreciate but the impact was not significant.
The U.S. unemployment claims figure was also released at that time and the impact was again not great. The number of Americans filing new claims for unemployment benefits fell last week. This signalled that the labour market still remains relatively strong in the U.S. The USD appreciated after the release, so USDCAD did not deviate significantly in either direction at that time.
General Verdict:
______________________________________________________________________
FOREX MARKETS MONITOR
USDCAD 4-Day Chart Summary
Server Time / Timezone EEST (UTC+03:00)
Price Movement
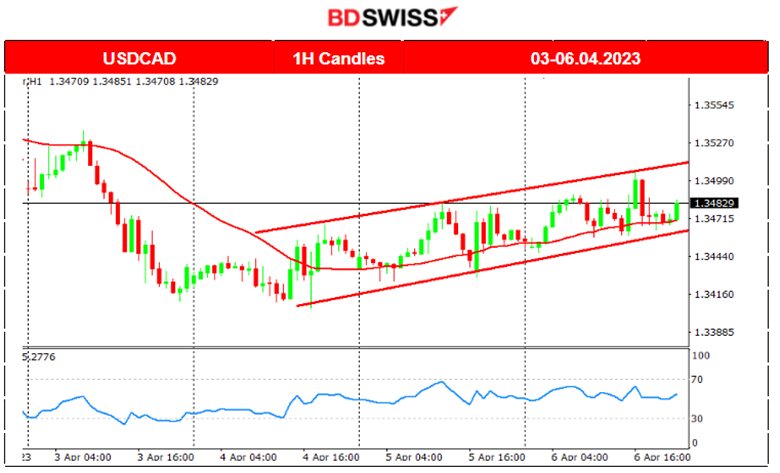
The USDCAD price reversed on the 4th of April by crossing the 30-period MA and moving upwards. After that, it continued with an upward trend moving above the MA at a steady but highly volatile pace. Deviations from the mean were 30-40 pips away. The price is moving within an upward channel as depicted.
USDCAD (06.04.2023) Chart Summary
Server Time / Timezone EEST (UTC+03:00)
Price Movement
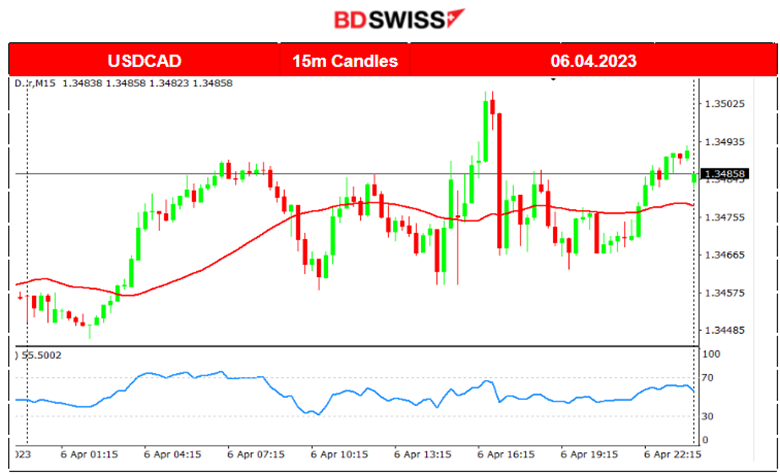
The pair experienced high volatility even from the beginning of the trading day, during the Asian session. It was moving sideways and around the 30-period MA. The shock that took place after the Canada Employment Change and Unemployment Rate figures was not significant. U.S. Dollar appreciated highly during and after the figure release and as a result, USDCAD moved higher before retracing back to the mean fully later on. The pair continued to move sideways until the end of the trading day.
EURGBP 4-Day Chart Summary
Server Time / Timezone EEST (UTC+03:00)
Price Movement
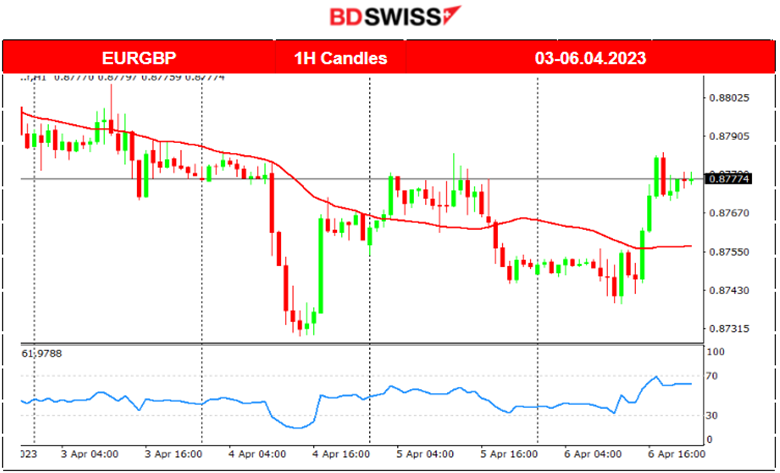
The pair is moving downwards in general and did not experience huge volatility until the 4th of April when it dropped more than 40 pips right after the European Markets opened at 10:15. It returned back to the 30-period MA later on. Since then, it has been moving around the 30-period MA showing typically normal deviations from the mean, of about 12-20 pips.
EURGBP (06.04.2023) Chart Summary
Server Time / Timezone EEST (UTC+03:00)
Price Movement
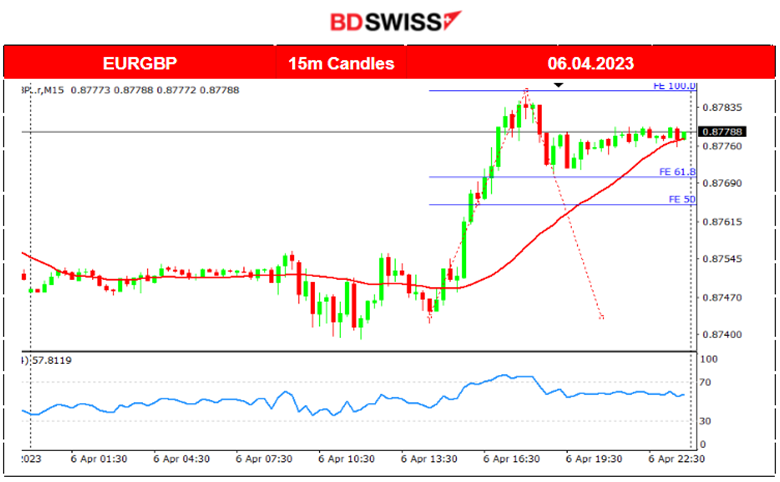
Volatility started to rise as the European Markets were about to open. The pair was moving around the 30-period MA until 15:45 when it experienced a rapid movement upwards over 30 pips.
Trading Opportunities
At around 18:15, the price started to settle and found resistance at 0.87850. A retracement back to the 61.8 Fibo level followed.
____________________________________________________________________
EQUITY MARKETS MONITOR
NAS100 (NASDAQ – NDX) 4-Day Chart Summary
Server Time / Timezone EEST (UTC+03:00)
Price Movement
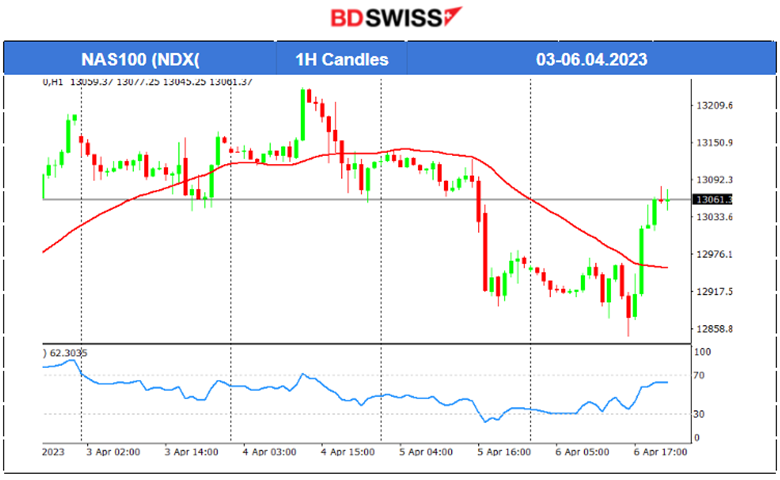
After a clear upward trend for U.S. stocks, they eventually reversed. The NAS100 U.S. index price has reversed and crossed the 30-period MA on the 4th of April, moving downwards. On the 5th of April at the NYSE opening, the index dropped even further due to signalling the risk-off preferences of investors after the recent announcements of OPEC+ that caused oil to jump and the latest news for the U.S. However, yesterday 6th of April, the index moved rapidly again significantly high after the NYSE opening confirming the mixed expectations of investors and the highly volatile current market conditions.
NAS100 (06.04.2023) Chart Summary
Server Time / Timezone EEST (UTC+03:00)
Price Movement
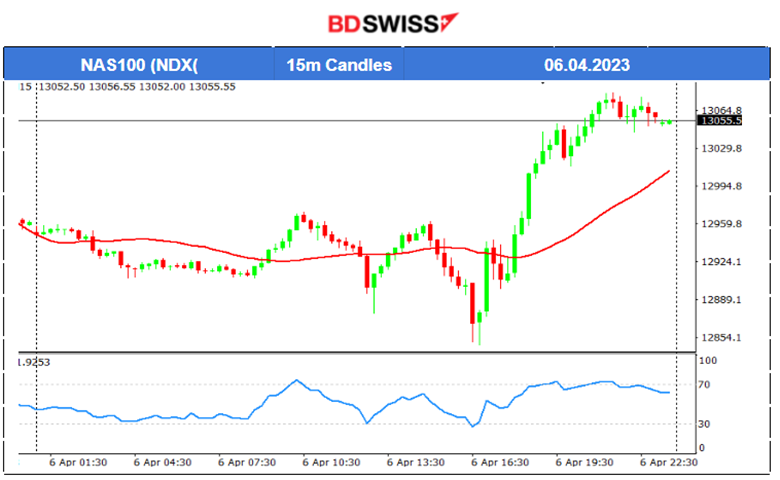
The price of NAS100 was moving sideways and around the 30-period MA showing low volatility during the Asian and European Sessions. After the NYSE opening at 16:30, the price started to move upwards, rapidly reversing and crossing the MA with a further upward movement until the end of the trading day.
______________________________________________________________________
COMMODITIES MARKETS MONITOR
USOIL (WTI) 4-Day Chart Summary
Server Time / Timezone EEST (UTC+03:00)
Price Movement
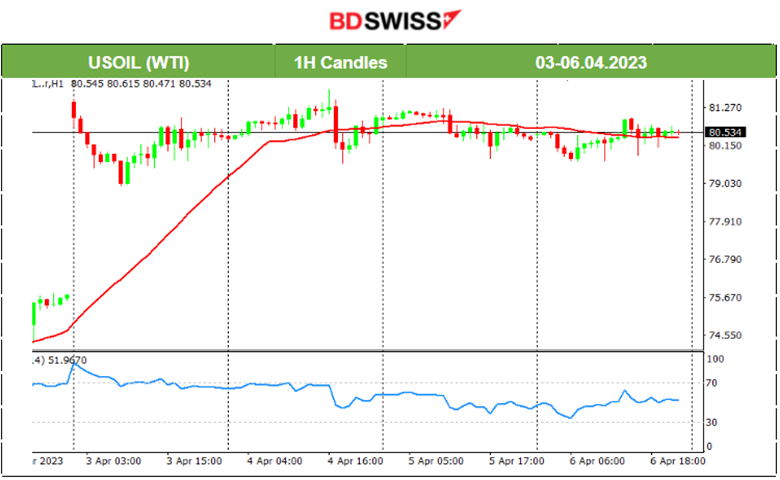
Crude has settled around the price of 80.5 USD after the big jump on the 3rd of April involving OPEC+ announcements to cut production. The price moved sideways around the 30-period MA with deviations from the mean near 1 USD.
______________________________________________________________
News Reports Monitor – Today Trading Day (07 April 2023)
Server Time / Timezone EEST (UTC+03:00)
- Midnight – Night Session (Asian)
No significant news. No important scheduled releases.
- Morning – Day Session (European)
At 15:30, important figure releases will take place that will greatly impact the USD. The Non-Farm Employment Change and Unemployment Rate figures are considered the most important announcements of the month. The U.S. Average Hourly Earnings m/m will also be released and expected to have an impact too. We usually have large deviations from the MA and retracement opportunities arise.
General Verdict:
______________________________________________________________


