Previous Trading Day’s Events (26 Dec 2023)
Winners vs Losers
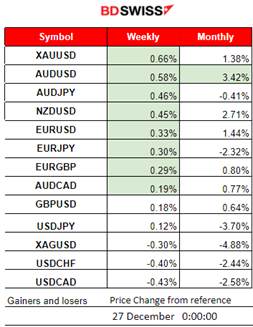
Gold is still on top for this week with 0.66% gains. AUDUSD remains the top performer for this month with 3.42% gains.
______________________________________________________________________
News Reports Monitor – Previous Trading Day (26 Dec 2023)
Server Time / Timezone EEST (UTC+02:00)

- Midnight – Night Session (Asian)
Japan’s jobless rate remained unchanged at 2.5%. Bank of Japan Governor Kazuo Ueda noted in a speech recently that labour conditions have tightened relative to last year, helping to support wage growth and spur workplace efficiency. There was no notable impact on the JPY at the time of the release.
At 7:00, the yearly core inflation figure was reported lower than expected 2.7% versus 3%. This supports the evidence that Japan’s inflation is cooling significantly, good news that supports their current policy. The central bank might scrap its negative interest rate in January and wait until April to abandon its control of bond yields. The report release had no major impact in the market at that time.
- Morning–Day Session (European and N. American Session)
No important news announcements, no special scheduled releases.
General Verdict:
____________________________________________________________________
FOREX MARKETS MONITOR
EURUSD 15m-Day Chart Summary
Server Time / Timezone EEST (UTC+02:00)
Price Movement
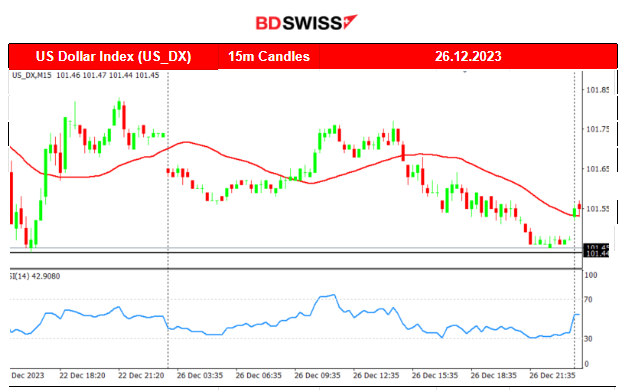
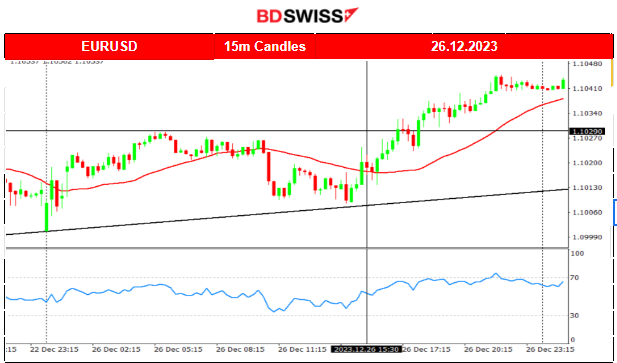
The pair was experiencing low volatility, moving sideways around the mean until 15:30. After that time the dollar started to experience weakness against the Euro and caused the pair to climb overall closing the trading day higher. The USD was the main driver as the dollar index chart clearly implies.
___________________________________________________________________
CRYPTO MARKETS MONITOR
BTCUSD (Bitcoin) 4-Day Chart Summary
Server Time / Timezone EEST (UTC+02:00)
Price Movement
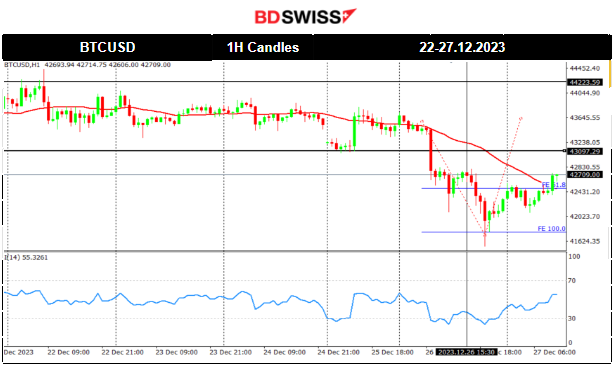
Since the 21st Dec Bitcoin’s price was experiencing low volatility and its levels got lower and lower as time passed. This is clear from the sideways path around the mean near 43700 USD that seems to form a triangle formation due to this lowering of volatility levels. The market for this asset opened lower on the 25th, breaking the triangle to the downside. This signalled a drop to the next support 42700 USD that was reached on the 26th Dec as per the chart. The price retraced soon after and continued further upwards to reach the MA eventually, reaching back to the 42700 USD once more.
Crypto sorted by Highest Market Cap:
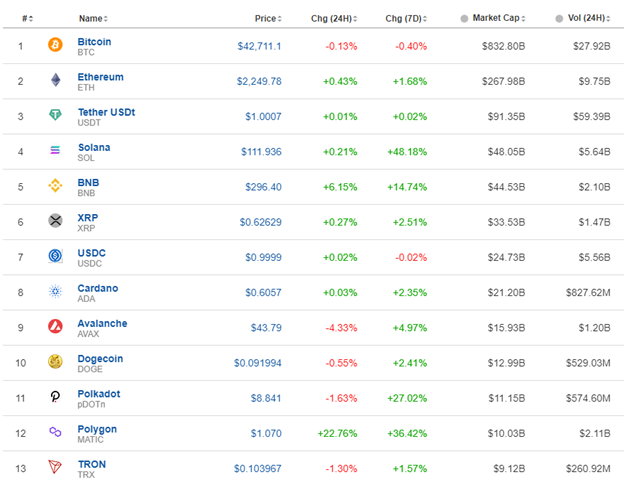
Mixed performance for the above crypto assets for the last 24 hours as some showed significant movement to the downside and try to recover with retracement.
Source: https://www.investing.com/crypto/currencies
______________________________________________________________________
EQUITY MARKETS MONITOR
NAS100 (NDX) 4Hour Timeframe Chart Summary
Server Time / Timezone EEST (UTC+02:00)
Price Movement
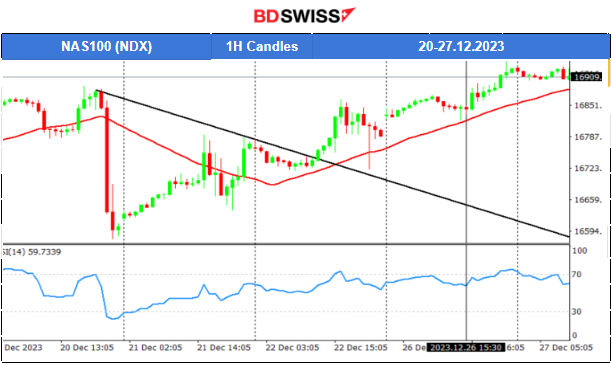
NAS100 and other indices were clearly on an uptrend when suddenly indices fell dramatically on the 20th Dec. The NAS100 experienced a near 300-dollar fall before retracing. A triangle formation was apparent after the retracement. Eventually the index broke the triangle and moved further to the upside testing the 16870 USD level before retracing on the 22nd Dec. Upon market opening on the 26th Dec the stock market saw a surge. It resumed its performance and climbed to higher and higher levels. Will this trend continue in January 2024? It is currently not showing signs that it might not, however, the seasonality effect is apparently affecting the market and should probably expect that this trend will stop at some point.
______________________________________________________________________
COMMODITIES MARKETS MONITOR
USOIL (WTI) 4-Day Chart Summary
Server Time / Timezone EEST (UTC+02:00)
Price Movement
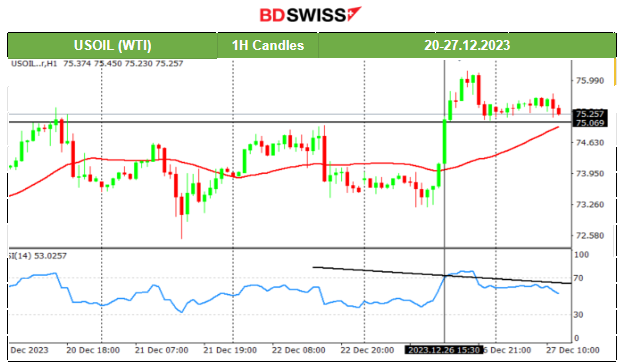
On the 20th Dec, the price crossed the 30-period MA ending an intraday upward but steady trend and now it seems to have great resilience to the downside even when news releases indicate that Angola is leaving the OPEC oil cartel after 16 years, after a dispute over the production cuts. The price tested the support near 72.5 USD/b, on the 21st, and then reversed. On the upside it tested the resistance near 75 USD/b and reversed again. It is clear that there is a volatile sideways path around the 30-period MA. On the 26th the price experienced a sharp significant movement to the upside crossing the MA and breaking the resistance at 75 USD/b, reaching 76 USD/b before retracing to the MA.
XAUUSD (Gold) 4-Day Chart Summary
Server Time / Timezone EEST (UTC+02:00)
Price Movement
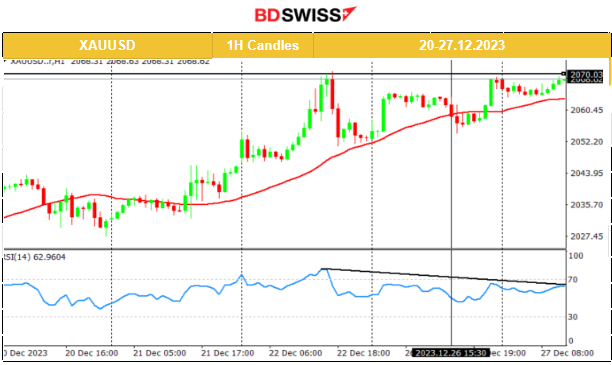
The price is currently moving upwards after the dollar loses strength. Important support now serves the level near 2070 USD/oz that the price tested twice so far for a breakout without success. Let’s see. The RSI is signalling a bearish divergence so no breakout upwards would mean a reversal to the downside as it seems or at least a sideways path for now.
______________________________________________________________
News Reports Monitor – Today Trading Day (27 Dec 2023)
Server Time / Timezone EEST (UTC+02:00)

- Midnight – Night Session (Asian)
No important news announcements, no special scheduled releases.
- Morning–Day Session (European and N. American Session)
At 15:00 the Richmond Manufacturing Index report will be released to give information regarding the responses of the surveyed manufacturers in Richmond. A less negative figure is expected meaning improvement. Let’s see. The dollar could be affected but only moderately at the time of the release. In any case the dollar weakening is something to expect, based on what we see so far in regards to U.S. Economy.
General Verdict:
_____________________________________________________________


