PREVIOUS TRADING DAY EVENTS – 12 June 2023
Announcements:
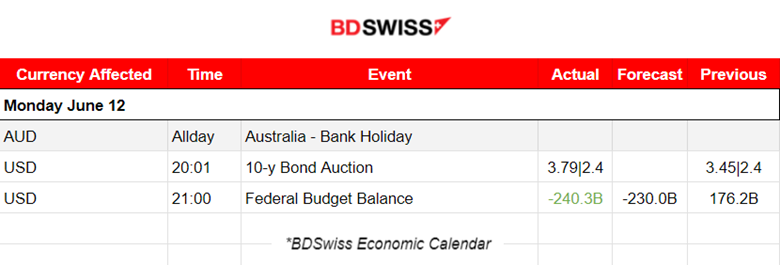
Through the first eight months of the fiscal year, which began in October, the Treasury reported a cumulative deficit of $1.165 trillion, up from $426 billion a year earlier.
U.S. President Joe Biden on June 3 signed legislation suspending the $31.4 trillion cap on U.S. debt until January 2025, after striking a deal with congressional Republicans. Since then, The U.S. Treasury Department has announced plans to rebuild its depleted cash position, which had fallen to below $23 billion earlier this month and was up to about $88 billion as of last Thursday.
Sources:
______________________________________________________________________
Summary Daily Moves – Winners vs Losers (12 June 2023)
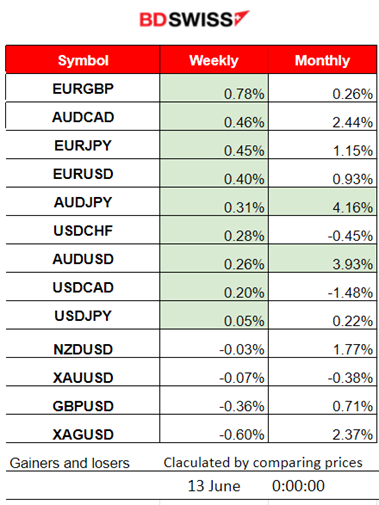
- EURGBP managed to lead this week so far with 0.78% price change.
- AUDJPY is on the top and has remarkably gained 4.16% so far this month, followed by AUDUSD having 3.93% gains so far.
______________________________________________________________________
News Reports Monitor – Previous Trading Day (12 June 2023)
Server Time / Timezone EEST (UTC+03:00)
- Midnight – Night Session (Asian)
No significant news announcements, no special scheduled releases.
- Morning – Day Session (European)
No significant news announcements, no special scheduled releases.
General Verdict:
______________________________________________________________________
FOREX MARKETS MONITOR
EURUSD (09.06.2023) Chart Summary
Server Time / Timezone EEST (UTC+03:00)
Price Movement
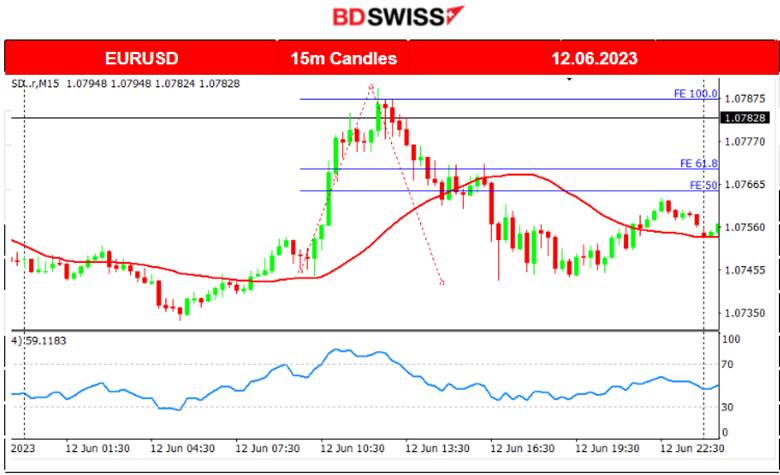
Yesterday, volatility was low due to the fact that no important scheduled releases took place. The pair moved significantly upwards after the European session started and found resistance 1.07895 before retracing back to the mean. The movement of the pair was sideways overall and around the 30-period MA.
____________________________________________________________________
EQUITY MARKETS MONITOR
NAS100 (NDX) 4-Day Chart Summary
Server Time / Timezone EEST (UTC+03:00)
Price Movement
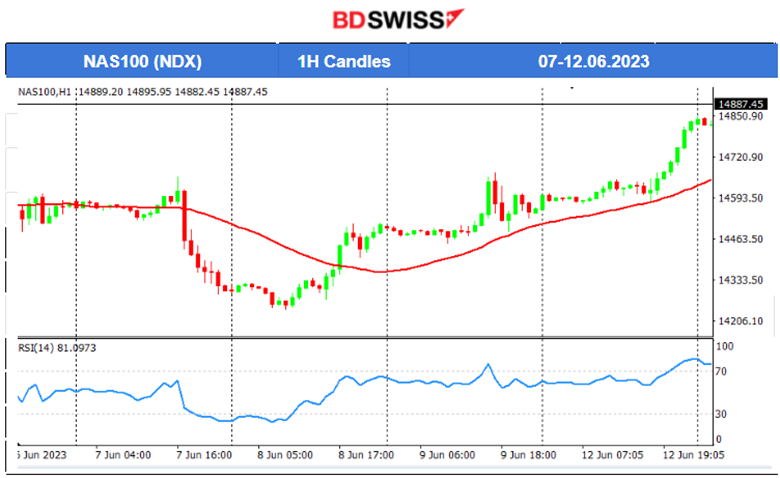
On the 7th of June, the index crashed after 17:00, near a 300 USD drop. This was after the BOC rate figure release at that time and the USD appreciation that followed immediately after. NAS100 dropped further following the next day, 8th June and reversed after that. It crossed the 30-period MA while moving upwards and followed an upward trend. All benchmark U.S. indices followed the same path recently signalling that the risk-on mood holds as the FOMC meeting is just around the corner.
______________________________________________________________________
COMMODITIES MARKETS MONITOR
USOIL (WTI) 4-Day Chart Summary
Server Time / Timezone EEST (UTC+03:00)
Price Movement
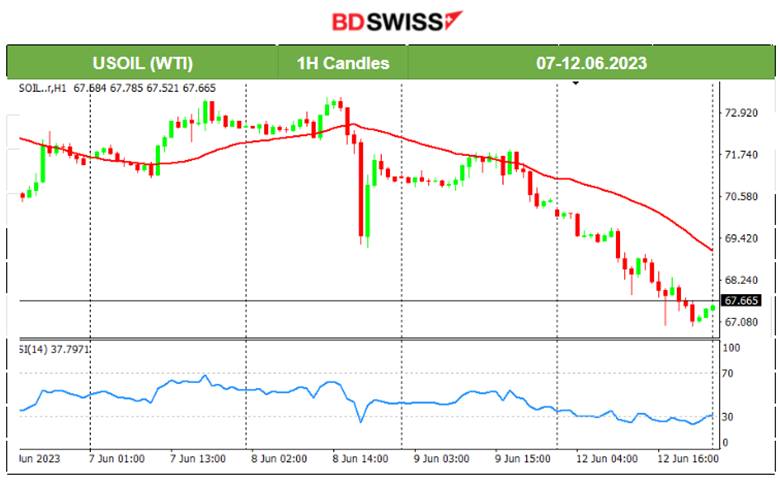
On the 8th of June, after the U.S. Unemployment claims figures were released, the price dropped rapidly finding resistance at 69 USD/b before retracing significantly. The claims were higher than the forecast, shifting the expectations towards a pause in hikes. This weak data caused turmoil and USD depreciated while actually crude dropped. On the 9th of June, its price experienced lower volatility and a drop overall settling at 70.4 USD/b. Crude experienced a steady fall on the 12th June and broke the support at 69 USD/b reaching the next support at 67 USD/b without retracing significantly.
XAUUSD (Gold) 4-Day Chart Summary
Server Time / Timezone EEST (UTC+03:00)
Price Movement
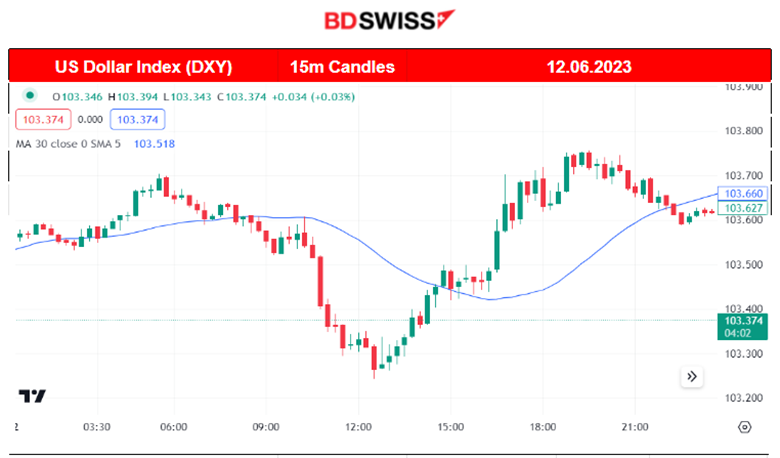
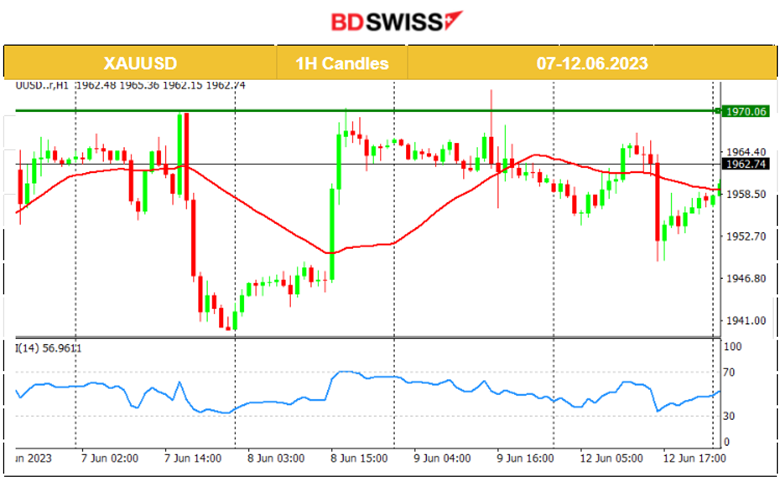
On the 7th of June, after 17:00, the USD appreciated greatly causing Gold’s price to crash and test the 1938 USD/oz support. Later on, it retraced fully back to the 61.8 Fibo level and even jumped further upwards when the USD depreciated greatly on the 8th of June after the high unemployment claims figures were released. It remained on a sideways path until the end of the week, even though on Friday it experienced a low-level intraday shock possibly affected by the CAD news at 15:30. On the 12th June gold price movement was quite volatile but again sideways. During the day at around 16:00 it dropped near 13 USD and found resistance before retracing back to the mean. The USD had shown high appreciation at that time explaining some of gold’s movement during that period.
______________________________________________________________
News Reports Monitor – Today Trading Day (13 June 2023)
Server Time / Timezone EEST (UTC+03:00)
- Midnight – Night Session (Asian)
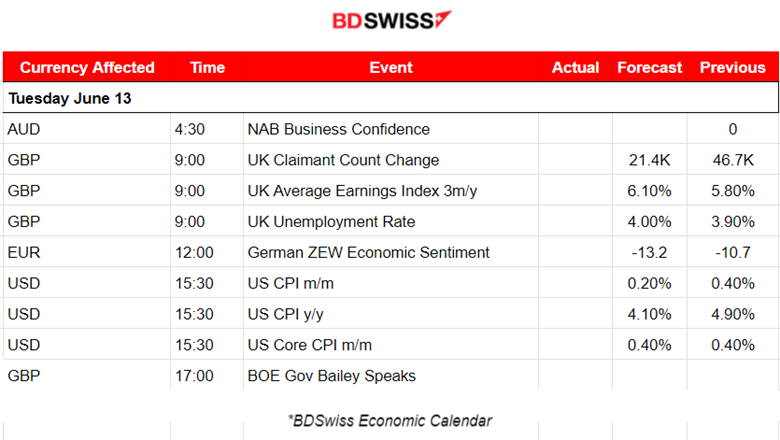
The result of the NAB Business Confidence survey will be released at 4:30 on the 13th of June. The impact on the AUD pairs is not expected to be high.
- Morning – Day Session (European)
The U.K. Claimant Count Change figure will be released at 9:00 and is expected to be reported lower. This is actually the unemployment claims change, an indication of the employment situation and is important for the BOE which wants to see figures of a weakening Labour market. Their fight to bring down inflation finally sees some progress since the latest data showed that the inflation rate fell below 10%. In any case, the GBP pairs will probably experience an intraday shock. The unemployment rate will be released as well and it is expected that it will be reported higher.
The CPI figures for the U.S. will be released at 15:30. Analysts expect that inflation will be reported lower. The USD will be affected greatly by the figure release. An intraday shock is also expected.
BOE Governor speaks at 17:00 commenting on the Labor Market data that were released the same day. Some volatility is expected but no shocks.
General Verdict:
______________________________________________________________


