

Previous Trading Day’s Events (29 Jan 2024)
______________________________________________________________________
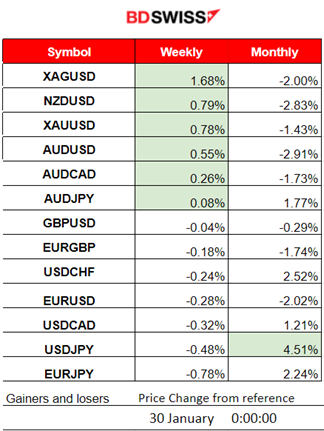
Winners vs Losers
Silver (XAGUSD) is leading this week after experiencing a high climb on Monday with 1.68% gains so far. USDJPY remains the top winner for the month with 4.51% gains. The dollar remained stable.
 ______________________________________________________________________
News Reports Monitor – Previous Trading Day (29 Jan 2024)
Server Time / Timezone EEST (UTC+02:00)
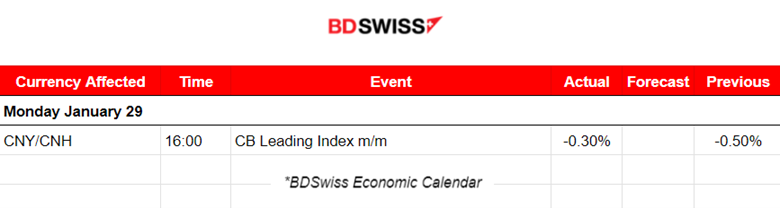
- Midnight – Night Session (Asian)
No important news announcements, no major scheduled figure releases.
- Morning–Day Session (European and N. American Session)
No important news announcements, no major scheduled figure releases.
General Verdict:
 ____________________________________________________________________
FOREX MARKETS MONITOR
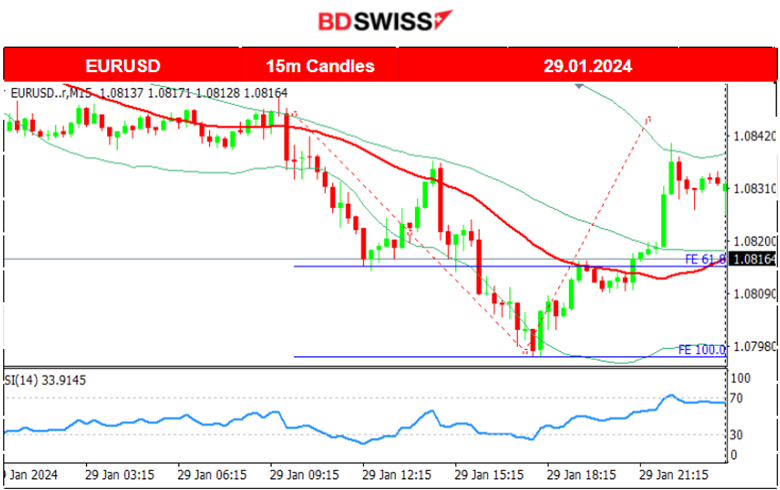
EURUSD (29.01.2024) 15m Chart Summary
Server Time / Timezone EEST (UTC+02:00)
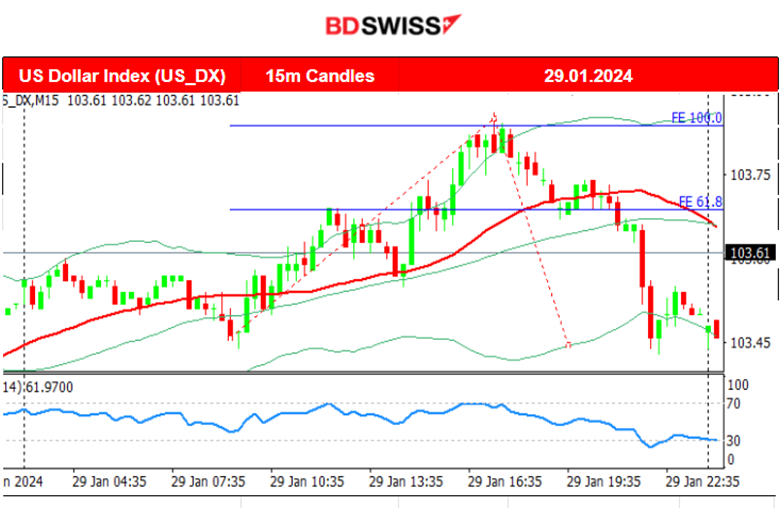
Price Movement
The pair experienced a similar path to the dollar index, mirrored, showing that the dollar was the main driver. After the start of the European session, the dollar started to appreciate significantly causing the EURUSD to drop. Several drops actually happened with their following retracements intraday to the 30-period MA. 1.07950 served as an important support and a turning point to the upside. The pair reversed upwards crossing the MA on its way up and touched the upper band of the Bollinger Bands indicator. Another reversal followed while entering the next trading day, 30th Jan.
 ___________________________________________________________________
CRYPTO MARKETS MONITOR
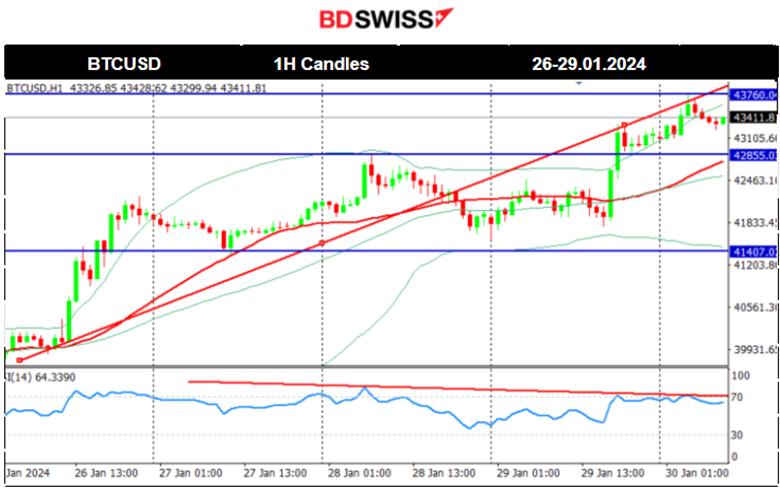
BTCUSD (Bitcoin) Chart Summary 1H Timeframe
Server Time / Timezone EEST (UTC+02:00)
Price Movement
Bitcoin started to recover slowly from the recent downturn that followed after the long-awaited ETF approval from the U.S. regulator for major asset managers. On the 26th Jan, it recorded a rapid price movement to the upside, leaving from the 40,000 USD mean, and reaching the resistance 42,250 USD. Retracement followed back to the 61.8 Fibo level that coincides with the 30-period MA. The price continued upwards steadily breaking that resistance and reaching the next at 42,800 USD before it reversed back to the MA and finally settled near the 42,250 USD level. On the 29th Jan, it showed its persistence to climb further breaking the resistance at 42800 USD and reaching 43750 USD. It could be the case that the uptrend continues, however, the RSI signals a bearish divergence with its lower highs and possibilities for high retracement or reversal soon before it continues its course upwards.
 Crypto sorted by Highest Market Cap:
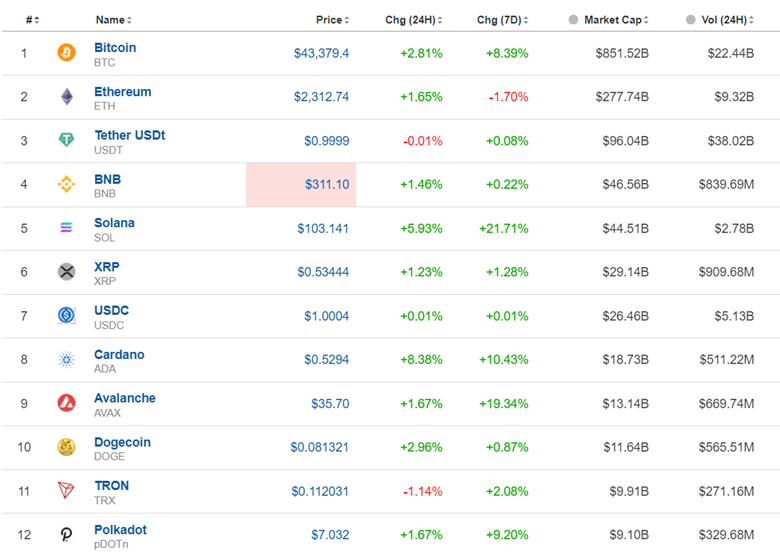
Obviously, the market is experiencing a significant recovery. High volatility returned back and steady correction is in place for now.
Source: https://www.investing.com/crypto/currencies
______________________________________________________________________
EQUITY MARKETS MONITOR
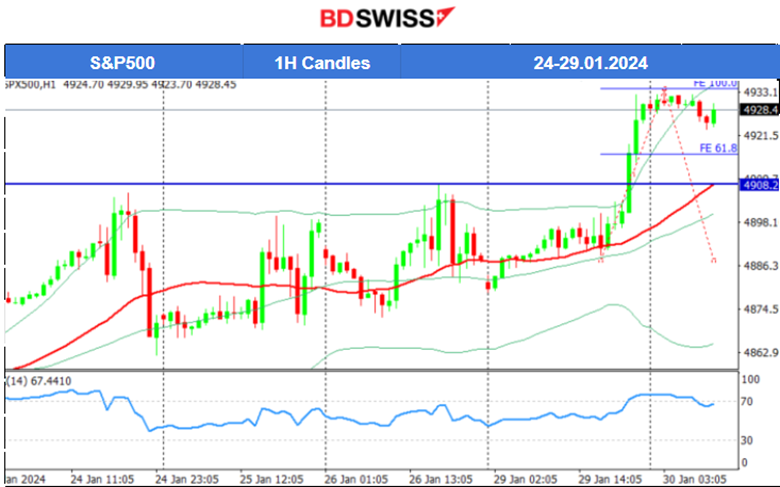
S&P500 (SPX500) 4-Day Chart Summary
Server Time / Timezone EEST (UTC+02:00)
Price Movement
The S&P 500 index broke the resistance near 4908 USD on the 29th Jan and jumped to the next resistance at 4933 USD. All benchmark indices followed the same path to the upside yesterday, an unexpected jump, late after 20:00. It is expected that the index will now see a retracement since it deviated a lot from the 30-period MA. The alternative scenario is that volatility levels might get higher ahead of NFP causing a breakout of the resistance 4933 USD to the upside.
Analysis on TradingView:
https://www.tradingview.com/chart/SPX500/F5tB2Jsq-S-P500-Retracement-30-01-2024/
 ______________________________________________________________________
COMMODITIES MARKETS MONITOR
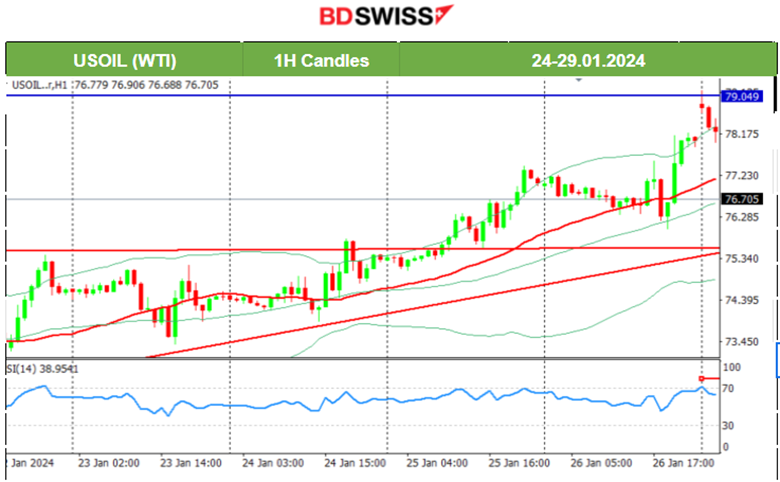
USOIL (WTI) 4-Day Chart Summary
Server Time / Timezone EEST (UTC+02:00)
Price Movement
Crude oil moved higher, as mentioned in our previous report since technicals were strongly supporting an upward movement. Recently, the price had steadily formed an upward wedge, as depicted on the chart, that was broken to the upside on the 25th Jan. Crude oil moved upwards to find resistance at near 77.5 USD/b before retracing to the 30-period MA and bouncing upwards until it reached 78 USD/b. On the 29th Jan, it saw more upward movement deviating from the mean and reaching the next resistance at 79 USD/b.
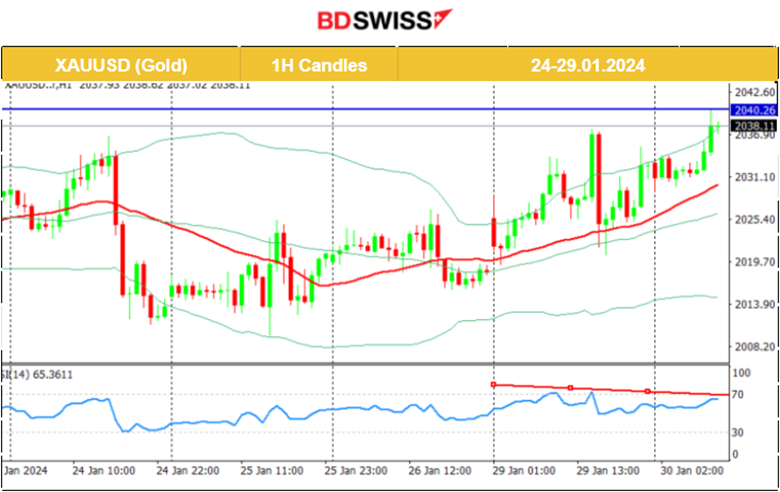
XAUUSD (Gold) 4-Day Chart Summary
Server Time / Timezone EEST (UTC+02:00)
Price Movement
On the 26th, Gold tested the resistance at near 2025 USD/oz without success during the volatile moves that took place, caused by the U.S. PCE Price Index news. It reversed immediately back to the MA continuing with the path around it and settled near the range 2018-2020 USD/oz once more. A clear short-term uptrend is clear after the 25th Jan. On the 29th the price rose significantly. However, the resistance at 2040 USD/oz looks strong and the RSI is slowing down. A breakout to the upside could lead to a rapid movement to 2050 USD/oz only if the comments from the FOMC news on Wednesday are in favour of such a direction. The dollar will probably be affected greatly causing Gold to move significantly.
 ______________________________________________________________
News Reports Monitor – Today Trading Day (30 Jan 2024)
Server Time / Timezone EEST (UTC+02:00)
- Midnight – Night Session (Asian)
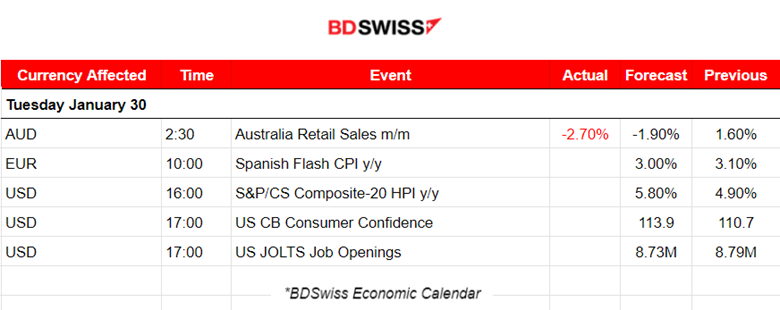
Australia’s Retail Sales figure was reported negative for December 2023, the seasonally adjusted estimate fell 2.7% month-on-month. That was more negative than the forecast but the market was not affected greatly at the time of the release.
- Morning–Day Session (European and N. American Session)
At 17:00, the CB Consumer Confidence figure will be released. These are the U.S. households’ views about the relative level of current and future economic conditions that affect policymakers’ decisions. The related figure shows optimism, expected to rise to 113.9. Since inflation is expected to fall further and borrowing costs to ease soon, consumers are more likely to continue spending, with the labour market getting hotter.
The JOLTS report at 17:00 will confirm if in December the labour market indeed was hotter than anticipated with more job opportunities, coinciding with the rest of the data, such as NFP. At the time of these two releases, a moderate intraday shock affecting USD pairs could occur.
General Verdict:
______________________________________________________________


