

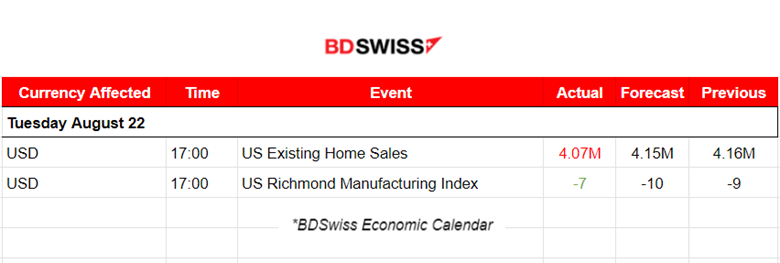
PREVIOUS TRADING DAY EVENTS – 22 August 2023
- Fifth District manufacturing activity remained slow in August, according to the most recent survey. The Richmond Manufacturing Index improved from -9 in July to -7 in August.
______________________________________________________________________
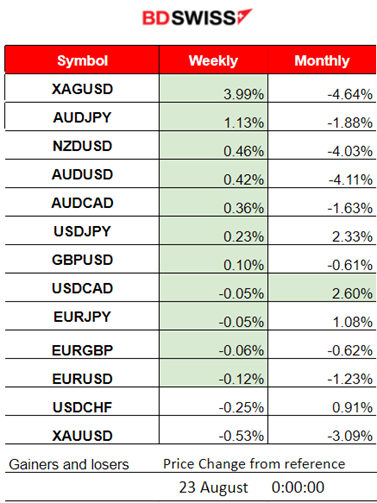
Winners vs Losers
- XAGUSD (Silver) has reached the top for this week as it moves on the upside significantly, having 3.99% gains so far.
- USDCAD is still leading this month with 2.6% gains, just a little bit more than USDJPY.
______________________________________________________________________
News Reports Monitor – Previous Trading Day (22 August 2023)
Server Time / Timezone EEST (UTC+03:00)
- Midnight – Night Session (Asian)
No important news announcements, no special scheduled releases
- Morning–Day Session (European and N.American Session)
Fifth District manufacturing activity remained slow in August, according to the survey from the Federal Reserve Bank of Richmond. The composite manufacturing index improved from -9 in July to -7 in August. More volatility with steady movements instead of major shocks for the USD pairs.
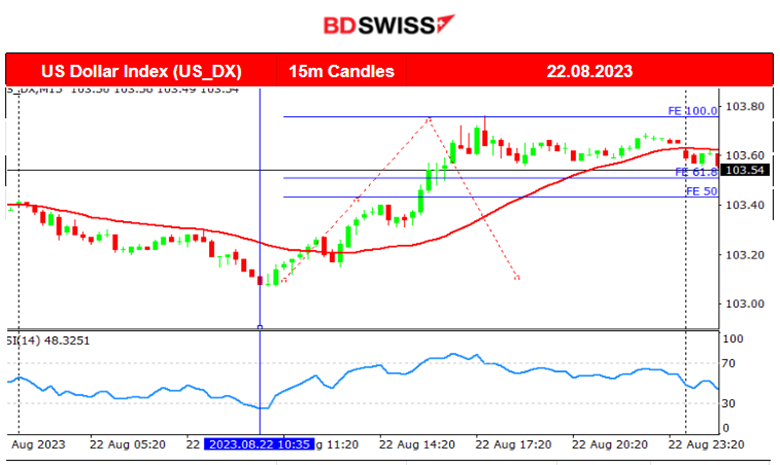
General Verdict:
- Absence of important scheduled releases.
- Higher volatility for USD pairs and U.S. indices.
- The DXY moved higher overall.
____________________________________________________________________
FOREX MARKETS MONITOR
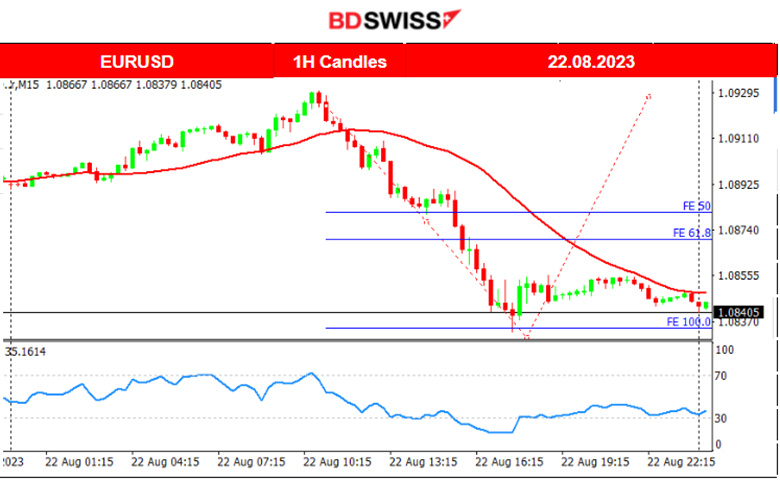
EURUSD (22.08.2023) Chart Summary
Server Time / Timezone EEST (UTC+03:00)
Price Movement
The pair started to move downwards significantly after the European session started. It was a steady downward movement over 80 pips. It found support eventually at near 1.0835 before settling to the sideways path. It eventually retraced back to near 1.08690 the next day.
___________________________________________________________________
CRYPTO MARKETS MONITOR
BTCUSD (Bitcoin) 4-Day Chart Summary
Server Time / Timezone EEST (UTC+03:00)
Price Movement
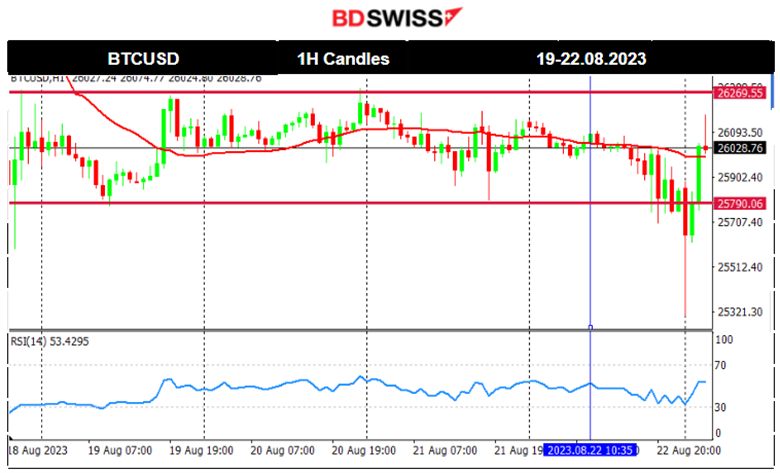
Bitcoin fell recently way below the 30K USD support and now is settled near 26K. In the last 4 days, the price seems to be in a consolidation phase until the next big move. The market is ranging between 26250 and 25780. No scheduled news releases today affect the USD much, therefore there is no expectation of a break. Other fundamental factors affecting the blockchain industry could push it to new levels but are not apparent. While investors are in a risk-off mood, as the U.S. stock market suggests, and the USD keeps on strengthening, bitcoin will probably continue to fall.
Low volatility during 19-20 August is due to weekend market conditions. Yesterday on the 22nd, by the end of the trading day, the price experienced volatility, caused also by the rollover, and should not be considered as a breakout to the downside. It still remains sideways.
Crypto Sorted by Highest Market Cap:
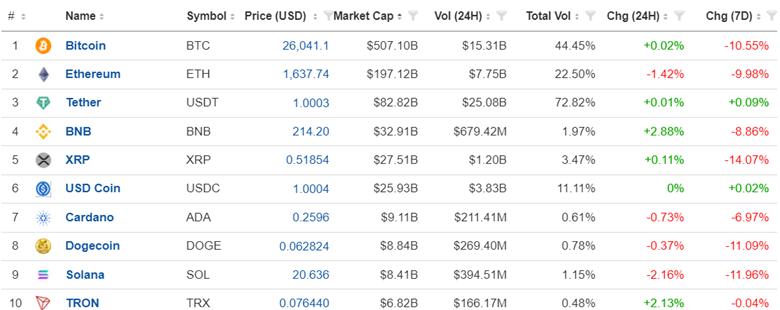
BNB has gained 2.88% the last 24 hours. Bitcoin down 10.55%, the last 7 days.
Source: https://www.investing.com/crypto/currencies
______________________________________________________________________
EQUITY MARKETS MONITOR
NAS100 (NDX) 4-Day Chart Summary
Server Time / Timezone EEST (UTC+03:00)
Price Movement
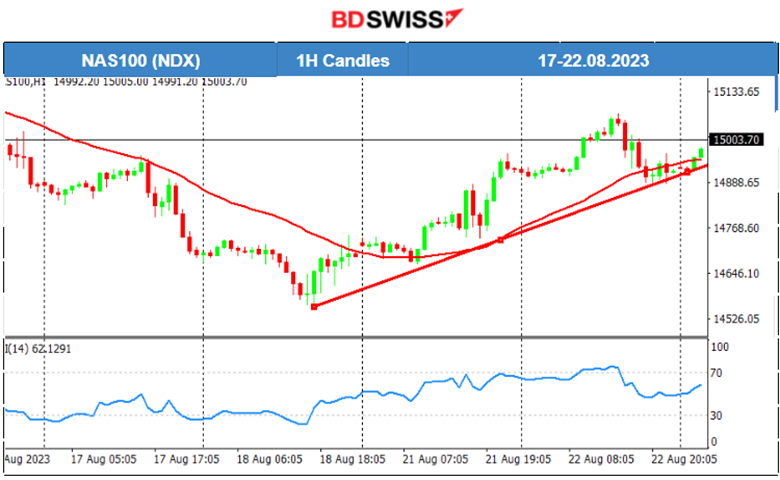
The data suggest that a start of an uptrend is on. The 30-period MA has reversed and is on an uptrend. Price is currently moving steadily upwards. However, when looking at the H4 chart, the MA is very far from the price. It is expected that the path would be volatile with movement to the downside, under the MA, on its way up if indeed this will be the future path.
______________________________________________________________________
COMMODITIES MARKETS MONITOR
USOIL (WTI) 4-Day Chart Summary
Server Time / Timezone EEST (UTC+03:00)
Price Movement
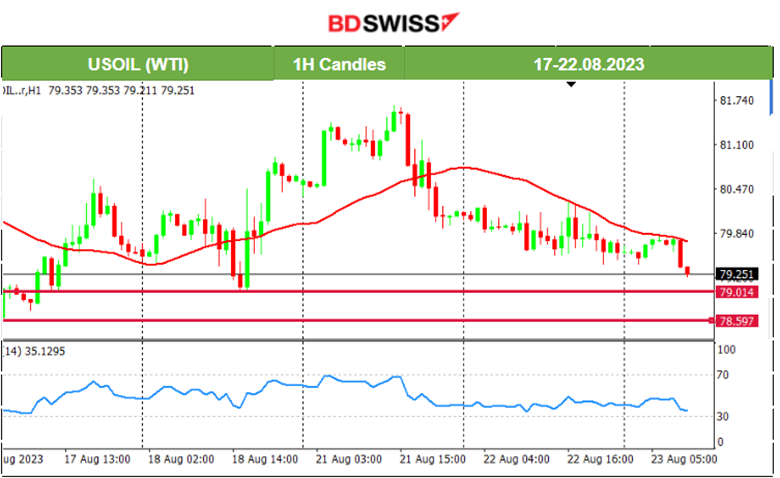
A downward steady movement for Crude is observed currently and breaks important support levels on its way down. Next support is at 79 USD/b and the next after that would be 78.60 USD/b. The price is currently under the 30-period MA indicating that it might continue the downward movement significantly.
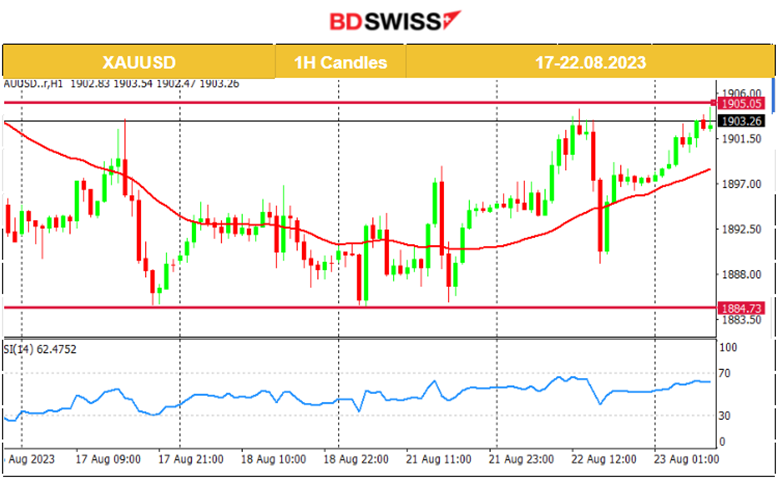
XAUUSD (Gold) 4-Day Chart Summary
Server Time / Timezone EEST (UTC+03:00)
Price Movement
Gold is testing the 1905 resistance level. It recently followed a downward trend and after some period of consolidation, it tries to find direction. That level could be the key to the upside.
______________________________________________________________
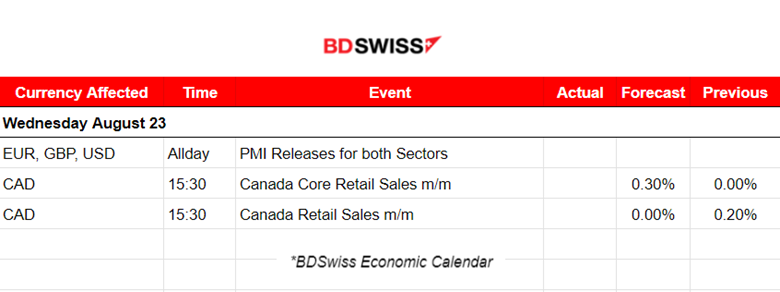
News Reports Monitor – Today Trading Day (23 Aug 2023)
Server Time / Timezone EEST (UTC+03:00)
- Midnight – Night Session (Asian)
No important news announcements, no special scheduled releases
- Morning–Day Session (European and N.American Session)
Today at 15:30 the retail sales data for Canada are going to be released. These figures will probably cause intraday shock for the CAD pairs. Timing is favourable for high deviations from the mean and could potentially create opportunities for retracement.
General Verdict:
- PMI releases today, more volatility is expected and small intraday shocks for pairs with EUR, USD, GBP upon PMI release.
- CAD pairs volatility kicks in at 15:30.
- Metals currently moving on the upside, eyes on Silver.
- Crude falls.
_____________________________________________________________


