

PREVIOUS TRADING DAY EVENTS – 30 August 2023
This is the latest indication that the labour market is finally cooling, though it still remains too tight. So far, the U.S. labour market is absorbing the effect of 525 basis points worth of interest rate increases from the Federal Reserve since March 2022.
Source: https://www.reuters.com/markets/us/us-private-payrolls-growth-slows-sharply-august-adp-2023-08-30/
______________________________________________________________________
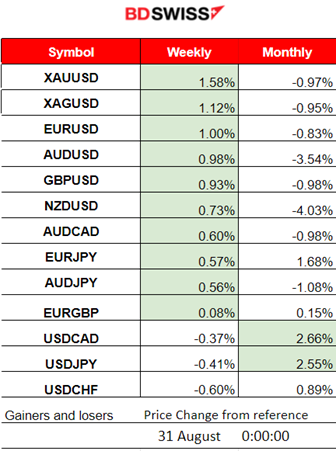
Winners vs Losers
______________________________________________________________________
News Reports Monitor – Previous Trading Day (30 August 2023)
Server Time / Timezone EEST (UTC+03:00)
- Midnight – Night Session (Asian)
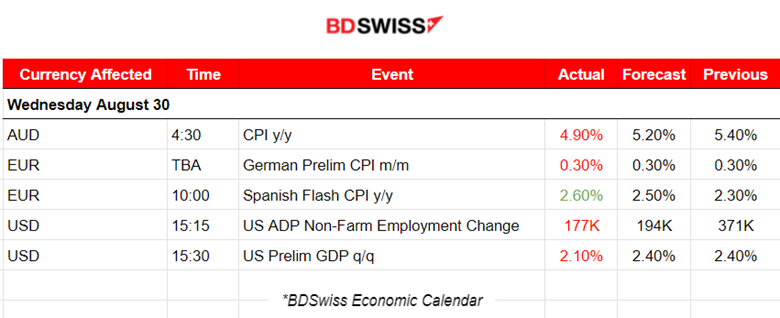
The latest Consumer Price Index (CPI) figures, released by the Australian Bureau of Statistics, showed the annual inflation at 4.9% in July, down from 5.4% in June. The market reacted with AUD depreciation at the time of the release. AUDUSD dropped nearly 20 pips before retracing shortly after.
- Morning – Day Session (European and N. American Session)
The Spanish Flash annual CPI figure was reported higher, at 2.6%. The EUR started to see more volatility after that time. The German Preliminary monthly CPI figure was reported actually unchanged. No major impact was observed.
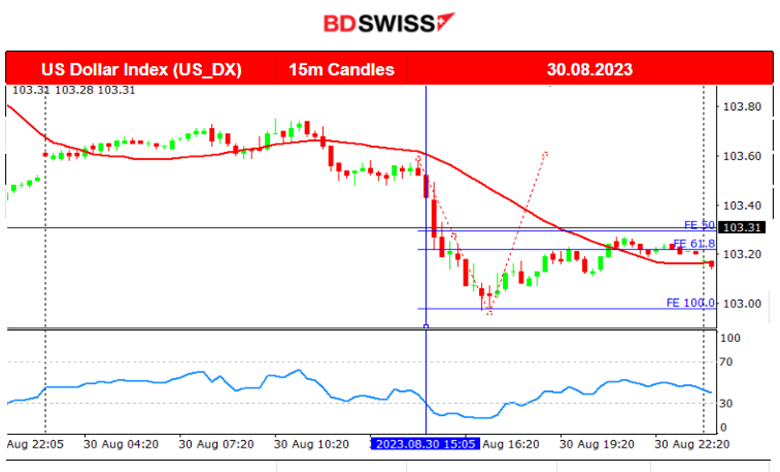
At 15:15 and 15:30, the USD pairs experienced a shock leading to USD depreciation. The ADP data showed a way lower figure in regards to employment change, only 177K against the previous 371K. This is ahead of NFP but the impact was great. While employment seems to take a hit from rising interest rates the market gets more confident that a hike pause will take place next.
The quarterly GDP figure for the U.S. showed a 2.10% increase, lower than what was expected. All figures pointed to the downside for DXY and that is what happened. The EURUSD moved upwards rapidly at the time of the releases, near 70 pips.
General Verdict:
____________________________________________________________________
FOREX MARKETS MONITOR
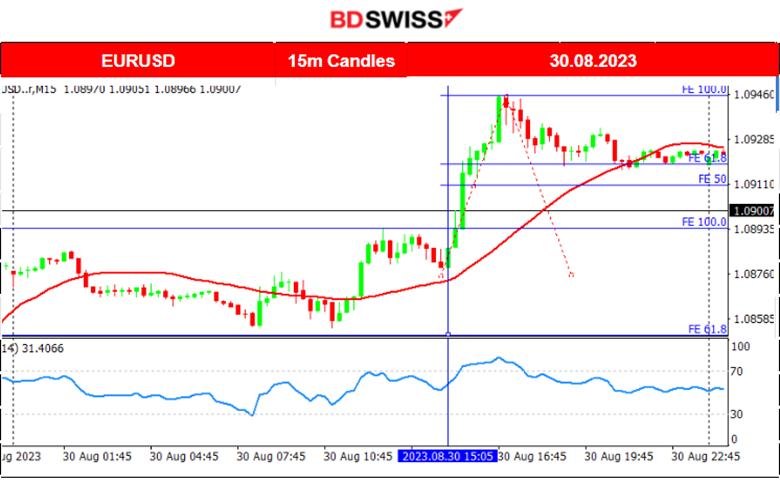
EURUSD (30.08.2023) Chart Summary
Server Time / Timezone EEST (UTC+03:00)
Price Movement
The pair started to experience more volatility after the European session started. It was moving to the upside and its momentum was boosted by the news after 15:15. It jumped to higher and higher levels by nearly 70 pips until it found resistance at 1.09460, before eventually retracing back to the mean. It is obvious that the jump was due to the USD depreciation from the market’s reaction to the labour market news.
___________________________________________________________________
CRYPTO MARKETS MONITOR
BTCUSD (Bitcoin) 4-Day Chart Summary
Server Time / Timezone EEST (UTC+03:00)
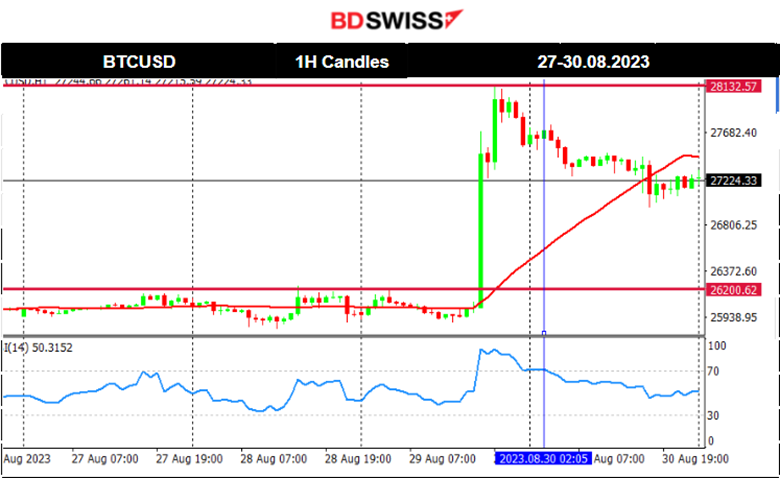
Price Movement
The price of Bitcoin (and of other major Cryptocurrencies) jumped the day before yesterday, breaking the boundaries that it experienced in the past few days. We see that the jump took place after the USD-related news releases at 17:00. Since the USD depreciated, Bitcoin, which is denominated in USD, jumped. It found resistance near 28132 before retracing. Yesterday, the 30th of August, the USD was hit by the news after 15:30 causing it to depreciate. Bitcoin’s price experienced some volatility but was not affected greatly. It closed lower, overall, since the correction from the previous day had a stronger effect.
Crypto sorted by Highest Market Cap:
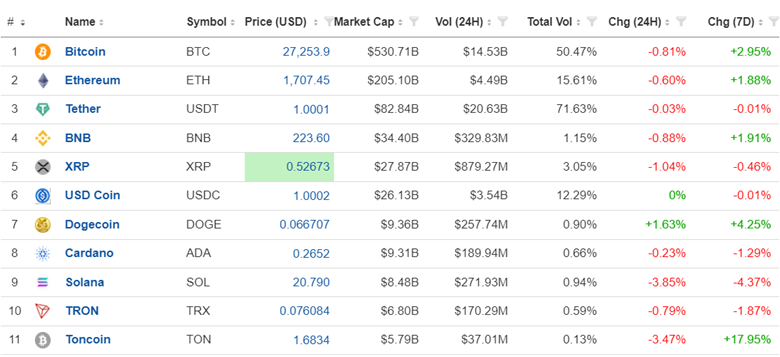
For the last 7 days, we have Toncoin on the top of the winners with 17.95% gains, followed by Dogecoin with 4.25%. Next is BNB, Ethereum and Bitcoin.
In the last 24 hours, we see that all have declined in value except Dogecoin.
Source: https://www.investing.com/crypto/currencies
______________________________________________________________________
EQUITY MARKETS MONITOR
NAS100 (NDX) 4-Day Chart Summary
Server Time / Timezone EEST (UTC+03:00)
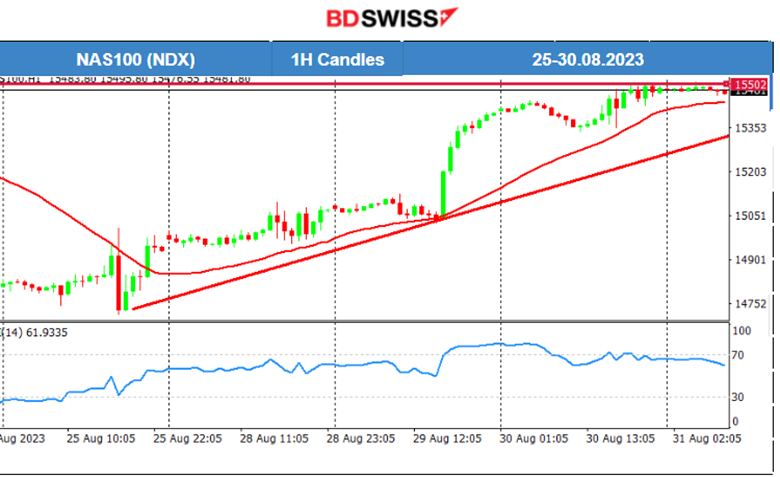
Price Movement
All the benchmark indices are on an uptrend. We see that the NAS100 now remains settled close to the 15500 level and there might be a chance of reversal as the RSI suggests. The RSI shows lower highs, thus a bearish divergence. As we will see below, most instruments are remarkably facing the same upward path recently. The Dollar index is following the opposite trend.
______________________________________________________________________
COMMODITIES MARKETS MONITOR
USOIL (WTI) 4-Day Chart Summary
Server Time / Timezone EEST (UTC+03:00)
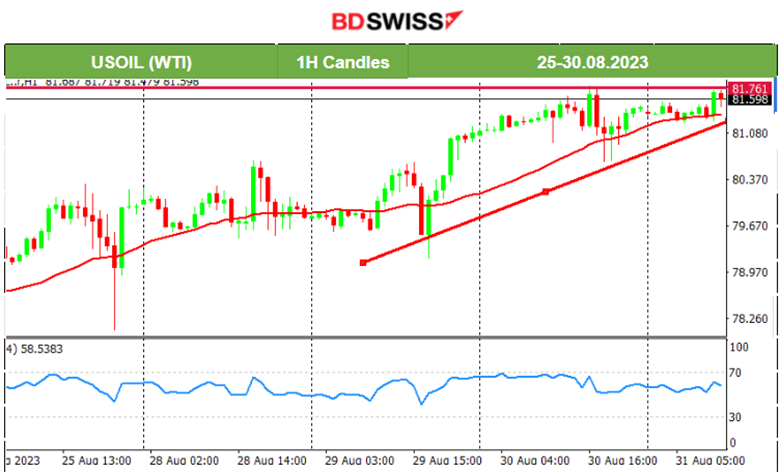
Price Movement
Crude price is on an upward trend and forming a rising wedge. It recently found resistance near 82 USD/b and keeps on testing that level.
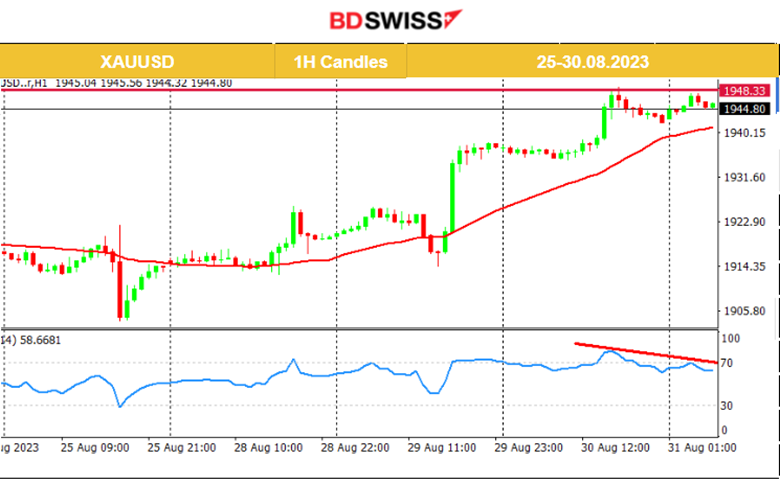
XAUUSD (Gold) 4-Day Chart Summary
Server Time / Timezone EEST (UTC+03:00)
Price Movement
Gold price is obviously on an uptrend as it moves above the 30-period MA. However, we see clearly the RSI slowed down and showed lower highs. The price found resistance near 1948 USD/oz and since the RSI suggests a bearish divergence, we expect that Gold will move to the downside. However, important is the fact that today at 15:30 we have important scheduled releases that could possibly distort the analysis since they affect the USD greatly, thus Gold. On every recent release so far, the USD is weakening so better to wait for the news first before decision-making.
______________________________________________________________
News Reports Monitor – Today Trading Day (31 Aug 2023)
Server Time / Timezone EEST (UTC+03:00)
- Midnight – Night Session (Asian)
No special news announcements or important scheduled figure releases.
- Morning–Day Session (European and N. American Session)
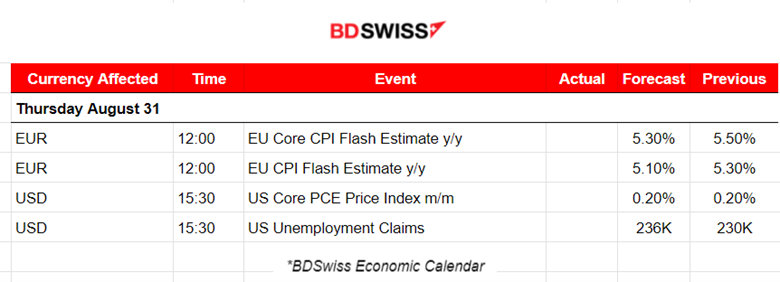
The annual CPI Flash estimates for the Eurozone by Eurostat are probably going to create some volatility upon release. The EUR pairs might be affected but the impact will not be so great. Figures are expected to be reported lower which is normal since the interest rate increases have actually had an impact on consumer spending and the economic business conditions in the Eurozone.
Another release related to inflation is the monthly Core PCE Price index change which is expected to be reported unchanged at 0.20%. The latest reported CPI data for the U.S. showed that monthly inflation remained unchanged so PCE expectations coincide with the latest inflation reports.
The unemployment claims for the U.S. are going to be released at the same time at 15:30. They are actually expected to be reported higher than the previous figure. Considering the fact that the ADP report showed way lower numbers, indicating the labour market is cooling, we expect no surprise in the number of claims and agree with the expected higher figure. The release at 15:30 will probably cause an intraday shock and create opportunities.
General Verdict:
______________________________________________________________


